ABSTRACT
Achieving the Dream: Success of Hispanic Students in Developmental Math Courses in a Texas Community College
Homer Guevara, Jr., Ed.D. Mentor: Albert B. Smith, Ph.D.
This investigation tracked Fall 2005 semester, first-time-to Northwest Vista College (NVC) student cohorts in order to more fully understand the success rates of students taking developmental coursework. This research specifically looked at the completion of developmental math courses by Hispanic students to see how well they succeeded in their first developmental math courses. The problem of this study was to determine whether or not there was a significant difference in success rates between Hispanic students enrolled in developmental math courses at NVC during the implementation of the Achieving the Dream initiative.
Three research questions were addressed related to: (1) a comparison of Hispanic male versus female success; (2) financial aid and success; and (3) the value of 17
background and personal variables in predicting success, as measured by student GPAs. A total of 1,905 students from each of the four developmental math courses were asked to participate in the study. Out of 1,905 surveys sent out for completion, 780 (40.9%) students responded, including 405 (21.3%) Hispanic students. The final sample for the
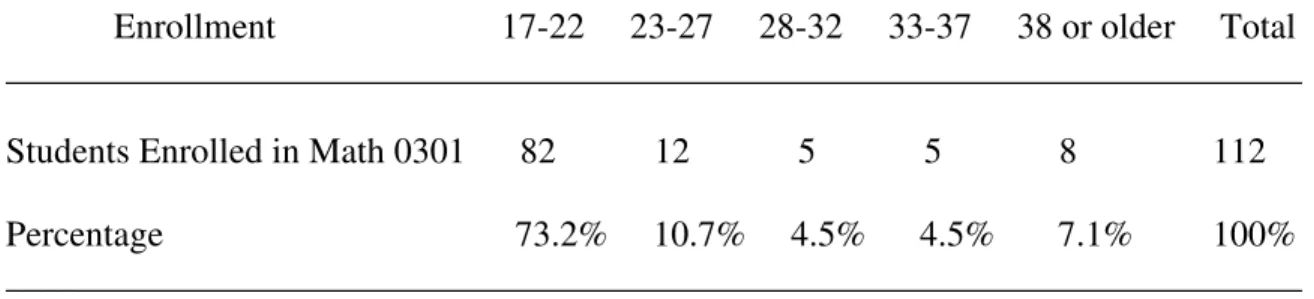
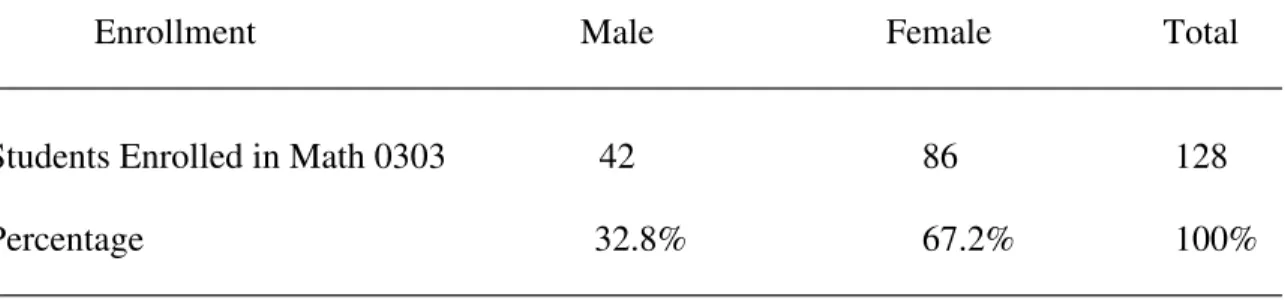
study included the following Hispanic students: (1) 27 in Math 0300; (2) 112 in Math 0301; (3) 128 in Math 0302; and (4) 138 in Math 0303.
To answer the first and second research questions, a proportion test was used to determine the success rates (a grade of C or better). In all four developmental math courses, the data analyses demonstrated that there were no significant differences between Hispanic male and female student success or in terms of the effect of financial aid on student success.
Logistic regression was the primary statistical technique used to answer research question three. Seventeen independent variables were considered in this model. The following variables were found to be significant variables in attributing to the success of Hispanic students in their respective developmental math courses: student age (Math 0301); social stimulation, peer group interaction, and faculty interaction (Math 0302); and family togetherness in (Math 0303).
This study was conducted in the hope that information could be provided as to what variables led to student success, especially in the Hispanic community. This research adds to the literature that is understudied—the motivation of Hispanic students to succeed in college.
Achieving The Dream: Success Of Hispanic Students In Developmental Math Courses In A Texas Community College
by
Homer Guevara, Jr., B.A., M.S. A Dissertation
Approved by the Department of Educational Administration ___________________________________
Robert C. Cloud, Ed.D., Chairperson Submitted to the Graduate Faculty of Baylor University in Partial Fulfillment of the
Requirements for the Degree of
Doctor of Education
Approved by the Dissertation Committee ___________________________________
Albert B. Smith, Ph.D., Chairperson ___________________________________
Sandra B. Cooper, Ph.D.
___________________________________ Douglas W. Rogers, Ed.D.
___________________________________ C. William Thomas, Ph.D.
___________________________________ Trena L. Wilkerson, Ph.D.
Accepted by the Graduate School December 2007
___________________________________ J. Larry Lyon, Ph.D., Dean
Copyright © 2007 by Homer Guevara, Jr. All rights reserved
TABLE OF CONTENTS
List of Figures……….. vii
List of Tables……….…………. viii
Acknowledgments……… xi
Chapter 1 – Introduction to the Study……… 1
Introduction……… 1
Significance of the Study………...……… 2
Developmental Mathematics Courses at Northwest Vista College…….. 4
Northwest Vista College’s Developmental Math Program………... 5
Conceptual Frameworks………..….. 9
Statement of the Problem and Purposes………... 11
Assumptions………. 17
Delimitations……… 17
Limitations of the Study………... 18
Definition of Terms……….. 18
Organization of the Study……… 21
Chapter Two – Review of Related Literature……….. 22
Introduction……….. 22
Latinos in Higher Education Today………. 23
Advocacy for Latino Educational Achievement……….. 26
Studies on Latino Retention in Colleges and Universities………... 32
The Developmental Student………. 36
Developmental Education……… 38
Goals of Developmental Education………. 41
The Need for Developmental Education……….. 43
Achieving the Dream………... 45
Participation in College……….…... 51
Tinto’s Theory of Departure……… 55
Tinto’s Student Integration Model………... 57
Incorporating Boshier’s EPS with Tinto’s Theory of Student Departure………... 59
Review of Current Studies………... 60
Summary Review of Literature……… 64
Chapter Three – Methodology………. 66
Introduction……….. 66
Research Design………... 66
Population and Sample………... 67
Instrumentation……….... 68
Variables……….. 69
Description of Exogenous (External) Variables………... 69
EPS Variables……….. 69
Background Variables……….………..………... 72
Description of Endogenous (Internal) Variables………...….. 74
Academic System………. 77 Academic Integration………... 77 Social Integration………. 77 Pilot Study………….…..……….……… 78 Data Collection……… 78 Analysis of Data……….. 79 Summary……….. 83
Chapter Four- Results……….. 86
Introduction……….. 86
Hypothesis……… 86
Research Question One……… 88
Math 0300……… 88
Math 0301……… 90
Math 0302……… 92
Math 0303……… 94
Research Question Two………... 96
Math 0300……… 96
Math 0301……… 97
Math 0302……… 99
Math 0303…..……… 101
Research Question Three………. . 103
Math 0300………. 104
Math 0302……….. 111
Math 0303……….. 115
Summary……… 126
Chapter Five – Summary, Discussion, Major Findings, and Recommendations…….. 129
Introduction……… 129
Summary of Results………... 130
Review of Methodology……… 131
Major Findings………... 132
Success of Hispanic Male Students Compared to Hispanic Compared to Hispanic Female Students……… 132
The Effect of Financial Aid on Success………. 133
The Effect of Other Variables……… 135
Discussion……….. 136
Recommendations for Practice……….. 145
Further Research……… 147
Conclusion………. 149
Appendix A – Cover Letter……….... 152
Appendix B – Student Education Participation Survey………. 154
Appendix C – Educational Participation Scale……….. 160
LIST OF FIGURES
Figure 1 – Tinton’s Model for Student Dropout From College……….…….. 12 Figure 2 – Boshier’s Model to Explain Adult Participation and Dropout………... 14 Figure 3 – Path Model of Educational Participation Scale Impact on Tinto’s Model…. 62 Figure 4 – Hypothesized Effects of Variables on Persistence………. 84 Figure 5 – Hypothesized Effects of Variables on Persistence………..………. 144
LIST OF TABLES
Table 1 – Success and Enrollment in Developmental Math by Ethnicity…………...…. 7
Table 2 – Students Surveyed and Their Response Rates in Fall 2005 Developmental Classes……… 68
Table 3 – Listing and Definition of EPS Variables……….…... 70
Table 4 – Listing and Description of Background Variables………. 73
Table 5 – Listing and Description of Endogenous Variables………. 74
Table 6 – Hispanic Males Compared to Hispanic Female Students Enrolled in Developmental Math 0300……….. 89
Table 7 – Proportion Test First Hypothesis Math 0300……….. 90
Table 8 – Hispanic Males Compared to Hispanic Female Students Enrolled in Developmental Math 0301………...………... 91
Table 9 – Proportion Test For First Hypothesis Math 0301………..……. 91
Table 10 – Hispanic Males Compared to Hispanic Female Students Enrolled in Developmental 0302…...………... 93
Table 11 – Proportion Test For First Hypothesis Math 0302……….. 93
Table 12 – Hispanic Males Compared to Hispanic Female Students Enrolled in Developmental Math 0303……….……… 94
Table 13 – Proportion Test For First Hypothesis Math 0303……….. 95
Table 14 – Hispanic Students Receiving Financial Aid Compared to Hispanic Students Who Did Not Receive Financial Aid Enrolled in Developmental Math 0300.………...……….. 97
Table 15 – Hispanic Students Receiving Financial Aid Compared to Hispanic Students Who Did Not Receive Financial Aid Enrolled in Developmental Math 0301….………... 98
Table 17 – Hispanic Students Receiving Financial Aid Compared to Hispanic Students Who Did Not Receive Financial Aid Enrolled in Developmental Math
0302….……….. 99
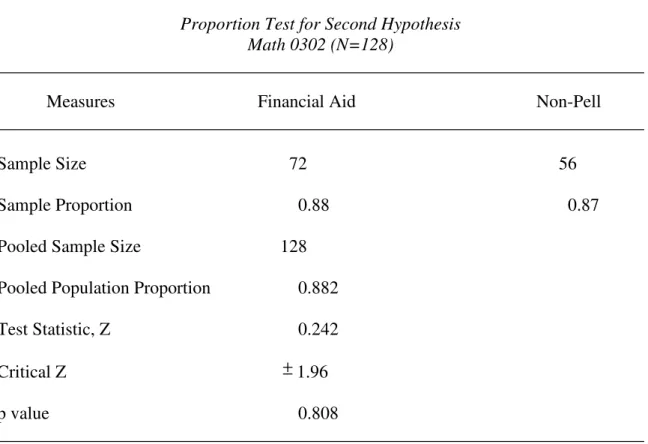
Table 18 – Proportion Test For Second Hypothesis……..………. 100
Table 19 – Hispanic Students Receiving Financial Aid Compared to Hispanic Students Who Did Not Receive Financial Aid Enrolled in Developmental Math 0303……….. 101
Table 20 – Proportion Test For Second Hypothesis Math 0303……….... 102
Table 21 – Pell Grant Eligibility……….... 104
Table 22 – College Attendance of Parents………... 105
Table 23 – Age Range of Developmental Students in Math 0300…... 105
Table 24 – Gender of Math 0300 Developmental Math Students………. 106
Table 25 – Initial Placement in Developmental Math Courses………. 106
Table 26 – Summary of Chi-Square Results for Math 0300………... 107
Table 27 – Pell Grant Eligibility……… 108
Table 28 – College Attendance of Parents……... 108
Table 29 – Age Range of Developmental Students in Math 0301………... 109
Table 30 – Gender of Math 0301 Developmental Math Students………. 110
Table 31 – Initial Placement in Developmental Math Courses………. 110
Table 32 – Summary of Chi-Square Results………... 111
Table 33 – Pell Grant Eligibility……… 112
Table 34 – College Attendance of Parents……….… 112
Table 35 – Age Range of Developmental Students in Math 0302……….... 113
Table 36 – Gender of Math 0302 Developmental Math Students………. 113
Table 39 – Pell Grant Eligibility……… 115
Table 40 – College Attendance of Parents………...……... 116
Table 41 – Age Range of Developmental Students in Math 0303…...……... 116
Table 42 – Gender of Math 0303 Developmental Math Students………. 117
Table 43 – Initial Placement in Developmental Math Courses………. 117
Table 44 – Summary of Chi-Square Results for Math 0303………. 118
Table 45 – Logistic Regression for Math 0300………. 119
Table 46 – Classification Table for Math 0300……...………... 120
Table 47 – Logistic Regression Results for Math 0301………... 121
Table 48 – Classification Table for Math 0301………... 122
Table 49 – Logistic Regression Results for Math 0302………. 123
Table 50 – Classification Table for Math 0302………... 124
Table 51 – Logistic Regression Results for Math 0303………. 124
Table 52 – Classification Table for Math 0303…………...………... 126
ACKNOWLEDGMENTS
A number of people have played a tremendous role in helping me get to this point. First, I would like to thank my committee, Dr. Doug Rogers, Dr. Trena Wilkerson, Dr. Bill Thomas, and Dr. Sandi Cooper. I would especially like to thank Dr. Al Smith, my committee chair. Your commitment and dedication in helping me with my educational process at Baylor University has been greatly appreciated.
Next, I would like to thank my wonderful family. My beautiful wife, Leticia, has provided me with undying love, reassurance, understanding, and most of all, patience throughout this journey. Without you this would never have been possible. You have always been the foundation of my success. I love you with all of my heart! I want to thank my children, Brianna, Kristine, and Derek, for their patience and understanding throughout my educational process. I sometimes could not devote my entire attention to you as I pursued my degree, but you were always my inspiration. My parents, Homero and Angelina Guevara, were instrumental in pushing and encouraging me to pursue my education. Thank you for your tremendous support and assistance in everything that I have accomplished throughout my life.
I am also thankful for the encouragement and support of so many of my colleagues at Northwest Vista College. I would like to especially thank the A.C.C.D. Director of Achieving the Dream, Dr. Jo-Carol Fabianke, a fellow Baylor product, for pushing wholeheartedly for me to enroll in the Scholars of Practice doctoral program. Thank you for championing my goal of “achieving my dream”. I want to thank
Edgar Garza for his unwavering support. I would also like to thank Wesley Anderson and Mike Munoz, Jr. for their assistance with the many statistical questions I had.
I am also especially grateful to Cindi Bluhm, Academic Leader for the Academic Foundations cluster, for assisting me in the coordination of my surveys and to all the faculty members in the developmental math department for assisting me in the collection of my data. And I would like to thank the developmental math students who were willing to share their experiences in this study.
Finally, I would like to thank God for His blessings and care throughout my educational journey at Baylor University.
CHAPTER ONE Introduction to the Study
Introduction
The student withdrawal from colleges in United States has long been recognized as a significant social, economic, and educational problem. Therefore, improving student retention has become and continues to be, a crucial challenge for higher education. It is a challenge sparked by the increased number of students leaving colleges or universities prior to degree completion and the decreased number of college going student population in the United States. Improvements in the extent and quality of education will raise the economic prospects, well-being, and civic engagement of the Hispanic population. At the beginning of this decade, Hispanics became the most poorly educated major
population group in the United States. White males averaged 13.3 years of schooling and black males averaged 12.2. Latino males lag behind with 10.6 years of schooling (Smith, 2001).
Community colleges have done an outstanding job of providing post-secondary opportunities to broad populations. Access, though, does not always lead to success for community college students. A study conducted by Bailey (2004) found that among students seeking an associate’s degree or higher, only 53% earned a degree or transferred to a four-year institution within eight years of initial enrollment. Another study
conducted by the National Center for Education Statistics (2003a) found that of all students that enrolled in community colleges in 1995-1996, only 35% attained a
degree or certificate within six years, compared with 38% of the Whites and 39% of the Asians.
A significant challenge facing community colleges is providing developmental education to help a growing, diverse student population. Many students are coming to the community college without the skills to do college level work (McCabe & Day, 1998). The question arises whether developmental education is worth the time, effort, and money to the student, the college, and society as a whole. A controversial aspect of developmental education is that it breeds uneven academic experiences for students of color. It also raises other points such as: (a) the appropriateness of remediation at the higher education level, (b) the real cost to college-level programs when developmental programs draw from the total college budget, and (c) the quality of instructional
methodologies for the remediation and development of basic skills in students (Roueche, Ely, & Roueche, 2001). The fact is that more than 50 % of all first-time students in community colleges need remedial or developmental work in one or more basic skill areas before enrolling in college-level courses (McCabe & Day, 1998). Proponents of remediation suggest that developmental courses help under-prepared students gain the skills necessary to excel in college and may serve as a tool to integrate students into the school population, thus helping the cause of retention and persistence (Soliday, 2002).
Significance of the Study
Some measures show that greater shares of Hispanic students are enrolled in postsecondary education than non-Hispanic Whites, but many Hispanic students are pursuing paths associated with lower chances of attaining a bachelor’s degree. Even though many Hispanic students are enrolled in community colleges, many attend school
part-time, and yet others delay or prolong their college education well into their 20s and beyond. Hispanic students also lag behind in the pursuit of graduate and professional degrees. Among 25 to 34 year old high school graduates, nearly 3.8 % of Whites are enrolled in graduate school, whereas only 1.9% of similarly aged Hispanic high school graduates are pursuing post-baccalaureate studies. Nearly 85% of White students 18-24 years of age, the traditional ages for college attendance, are enrolled full-time. Hispanic students’ high levels of part-time enrollment and work have adverse effects on their levels of degree completion (Fry, 2002).
The Lumina Foundation has funded a multi-year initiative called “Achieving the Dream: Community Colleges Count”, which addresses a national imperative to increase the success of low income students and students of color. Northwest Vista College, along with each of the other colleges in the Alamo Community College District, is participating in the initiative and will develop interventions to improve student outcomes in the
following areas:
• Successful completion of developmental courses and progression to
college-level courses.
• Successful completion of identified college-level courses. • Productive grades in all courses (A-C).
• Semester to semester persistence. • Graduation.
This study will focus on the successful completion of developmental courses, specifically, the successful completion of the four developmental math courses at Northwest Vista College.
Northwest Vista College (NVC) is an institution of approximately 9,000 students located in Northwest quadrant of San Antonio, Texas. Northwest Vista College offers Associate of Arts; Associate of Science; Associate of Applied Science degrees and certificates; continuing education; and development education programs. In 2002, Northwest Vista College was the third fastest growing community college in the United States in terms of enrollment.
Developmental Mathematics Courses at Northwest Vista College
The following is a list of the developmental math courses offered at Northwest Vista College:
1. 0100-Math Lab for Cooperative Learning-This lab is required for all developmental math classes. It is designed to facilitate the learning of developmental math through assisted cooperative learning activities. Co- requisite: Math 0300, 0301, 0302, 0303.
2. 0300-Basic Mathematics-This course focuses on basic mathematical operations (addition, subtraction, multiplication, division, and square root) with signed numbers (including integers, decimals, and fractions); ratios and proportions; interpreting charts and graphs; informal geometry; and the use of these concepts in problem solving. A student who is required by the college to take this course must pass it with C (75%) or better before being allowed to take a higher-level course in the mathematics sequence.
3. 0301-Introduction to Algebra and Geometry-Prerequisite: Appropriate placement score or “C” (75%) or better in Math 0300, or equivalent. This course focuses on solution methods for linear equations and inequalities, graphs of linear functions, linear models, and the use of these concepts in problem solving. A student who is required by the college to take this course must pass it with C (75%) or better before being allowed to take a higher-level course in the mathematics sequence.
4. 0302-Elementary Algebra-Prerequisite: Appropriate placement score or “C” (75%) or better in Math 0301, or equivalent. This course focuses on factoring, arithmetic operations on polynominals and rational expressions, and the use of these concepts in problem solving. A student who is required by the college to take this course must pass it with C (75%) or better before being allowed to take a higher-level course in the mathematics sequence.
5. 0303-Intermediate Algebra-Prerequisite: Appropriate placement score or “C” (75%) or better in Math 0302, or equivalent. This course focuses on solution methods for quadratic equations and inequalities, graphs of quadratic
functions, quadratic models, and the use of these concepts in problem solving. A student who is required by the college to take this course must pass it with C (75%) or better before being allowed to take a higher-level course in the mathematics sequence (Northwest Vista College Catalog, 2005-2006, p. 127).
Northwest Vista College’s Developmental Math Program Community colleges are the port of entry into higher education for many people, including the majority of postsecondary students who are low-income and students of color. Many community college students achieve their goals, but a number of students that are low-income and students of color face challenges that impede their progress. The math department at Northwest Vista College has set up institutional structures that help ensure student retention and success. The following is the philosophy of math instructors at Northwest Vista College concerning developmental math courses:
1. Cause no more harm
a. Use Ips (insufficient progress) instead of “Fs” for developmental courses
b. Never say “you are already supposed to know that” and other abusive phrases
2. Bring students up to class level
a. Explore students’ work and questions for areas of deficiency or misunderstanding.
b. Always review and help students develop competencies for areas which are deficient
3. Teach deep, not wide
a. Fewer topics and more depth
b. Maintain a heavy emphasis on curriculum essentials 4. Be flexible, delivery may be everything
a. Lecture and write notes for those who learn through observation b. Use group collaboration to verify that the material is understood c. Individual tutoring is sometimes necessary
The math department at Northwest Vista College has a focused analysis of student outcomes in helping it design effective responses for helping students succeed in
developmental math. In order to help with the retention of developmental math students, a Drop Advising Program was established in the Fall of 2003 and has served an estimated 250 student per year. This program was established to help students wishing to drop their developmental math classes with counseling services. Students are given an advisement slip and are referred to a designated faculty member to be counseled before dropping the classes. Another service aimed at retaining students in developmental math courses is the Math, English, Reading Advocacy Center where an estimated 1,000 plus students will be served per year. Students who are at risk of dropping or failing their developmental classes are invited to use the services of the Advocacy Center. These students are assisted in areas of weakness to include study skills and organizational strategies. These services are offered in a quiet, supportive atmosphere. A third service provided to
developmental math students at Northwest Vista College is the Math Laboratory. The lab is used as a center for math students to receive tutoring in collaborative groups. This collaborative effort allows for NVC to serve more students while at the same time improves the students’ independence and success in their courses.
Table 1 shows a breakdown of success and enrollment in developmental math by ethnicity for the Fall 2005 and the Spring 2006 semesters at Northwest Vista College. This information includes the breakdown of enrollment by course to include the four developmental math courses offered at Northwest Vista College. The breakdown in ethnicity includes: a) American Indian/Alaskan Native, b) Asian/Pacific Islander, c) Black/Non-Hispanic, d) Hispanic, e) International, and f) White/Non-Hispanic.
According to Table 1, Hispanic students’ success rates in all developmental courses are comparable to the overall success rates in each of the four developmental courses but, their success rates did fall short of expectations, percentage-wise, in
comparison to White/Non-Hispanic students and some other groups. Hispanic students’ success rates fell below the overall student success rates in Math 0300, 0302, and 0303 for the Spring 2006 semester. Math 0301, where all students had an overall success rate of 60%, was the only course where Hispanic students exceeded success rates with a 61% success rate. In the Fall 2005 semester, Hispanic students’ success rates fell below the overall student success rates in Math 0301 and 0302. Math 0300, with an overall student success rate of 67%, was the only course where Hispanic students exceeded overall student success rates with a 69% success rate. Hispanic students matched the overall student success rate in Math 0303 with a 64% success rate.
Table 1
Success and Enrollment in Developmental Math by Ethnicity
________________________________________________________________________ Term Course Ethnicity Enrollment Success
(C or better) ________________________________________________________________________
Spring 2006 2208 64%
Math 0300 TOTAL 197 68%
American Indian/Alaskan Native 1 100%
Asian/Pacific Islander 0 - Black/Non-Hispanic 15 60% Hispanic 101 66% International 1 100% White/Non-Hispanic 79 71% Math 0301 TOTAL 598 60%
American Indian/Alaskan Native 4 100%
Table 1 . Success and Enrollment in Developmental Math by Ethnicity
_______________________________________________________________________ Term Course Ethnicity Enrollment Success
(C or better) ________________________________________________________________________ Black/Non-Hispanic 51 55% Hispanic 292 61% International 4 75% White/Non-Hispanic 238 60% Math 0302 TOTAL 682 65%
American Indian/Alaskan Native 8 75%
Asian/Pacific Islander 9 89% Black/Non-Hispanic 39 59% Hispanic 352 62% International 0 - White/Non-Hispanic 274 69% Math 0303 TOTAL 731 66%
American Indian/Alaskan Native 0 -
Asian/Pacific Islander 19 84% Black/Non-Hispanic 42 67% Hispanic 323 65% International 1 100% White/Non-Hispanic 346 66% Fall 2005 2496 63% Math 0300 TOTAL 308 67%
American Indian/Alaskan Native 2 50%
Asian/Pacific Islander 5 100% Black/Non-Hispanic 18 50% Hispanic 162 69% International 2 100% White/Non-Hispanic 119 65% Math 0301 TOTAL 711 57%
American Indian/Alaskan Native 9 56%
Asian/Pacific Islander 8 38% Black/Non-Hispanic 39 54% Hispanic 377 55% International 1 100% White/Non-Hispanic 277 61% Math 0302 TOTAL 736 65%
American Indian/Alaskan Native 3 33%
Asian/Pacific Islander 9 78% Black/Non-Hispanic 41 66% Hispanic 361 63% International 2 50% White/Non-Hispanic 320 67% (table continues)
Table 1 . Success and Enrollment in Developmental Math by Ethnicity
_______________________________________________________________________ Term Course Ethnicity Enrollment Success
(C or better) ________________________________________________________________________
Math 0303 TOTAL 741 64%
American Indian/Alaskan Native 3 67%
Asian/Pacific Islander 16 75% Black/Non-Hispanic 43 63% Hispanic 365 64% International 1 100% White/Non-Hispanic 313 63% ________________________________________________________________________ Conceptual Frameworks
The research on student persistence is concentrated on persistence or departure models (Tinto 1975, 1988, and 1993; Pascarella & Terenzini, 1980). The main emphasis is the question as to what leads students to voluntarily leave institutions of higher
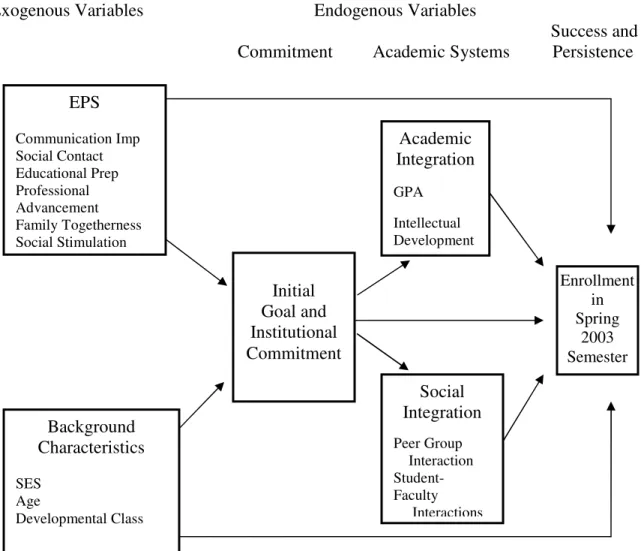
learning. The work of Tinto (1975, 1988, 1993) is cited most often in the literature. Tinto’s theory of student departure focuses on the structural conditions that lead to departure and identifies integration as key to student persistence. His theory of student departure has been consistently tested and support exits for his key theoretical constructs: academic and social integration. Tinto theorized that what motivates individuals to leave colleges and universities before graduating results from interactions between a student and his/her educational environment (see Figure 1, p. 10).
This study used parts of Tinto’s model and Boshier’s model of Adult Education Participation and Dropout to identify and classify 17 independent variables. Boshier’s model is based on Maslow’s Hierarchy of Needs and on the first major study of adult participation in education by Houle (1961). Houle’s study suggested that participants in school could be categorized into three learning orientations: (1) goal-oriented students,
(2) activity-oriented students, and (3) learning-oriented students. Using Maslow’s hierarchy, Boshier suggests that people are either primarily growth-oriented or deficiency-motivated. His model, therefore, is based on the assumptions that
participation and persistence in adult education are determined by how people feel about themselves and the match between the self and the educational environment. Boshier (1971) developed the Educational Participation Scale, which has been revised twice in 1983 and 1991, in order to test Houle’s typology. He also expanded on Houle’s original three learning orientation groups into seven: (1) Communication Improvement, (2) Social Contact, (3) Educational Preparation, (4) Professional Advancement, (5) Family Togetherness, (6) Social Stimulation, and (7) Cognitive Interest.
Boshier’s and Tinto’s models point to the importance of students and institutions fitting well with each other, but Boshier’s model (see Figure 2, p. 12) focuses more on the motivations of the student. Studies of Tinto’s theory (Attinasi, 1989; Braxton,
Sullivan, & Johnson, 1997) have found that a shortcoming may be that it does not include complex psychological aspects that may explain student departure. Hurtado and Carter (1997) questioned Tinto’s model by saying that it is problematic in that it does not acknowledge that racially tense environments complicate integration for diverse groups of students whose responses to adversity are complex. Incorporating the motivational aspects of Boshier’s Educational Participation Scale (EPS) into the background characteristics of Tinto’s model may strengthen Tinto’s model.
Statement of the Problem and Purposes
According to data collected, the National Study of Developmental Education showed that only 27.5% of minority students enrolled in developmental programs in community colleges and universities were retained through graduation, while 36.2% of White students at these institutions were retained through graduation (Boylan, Sutton, & Anderson, 2003). A study involving more than 130 Texas colleges and universities showed that 1-year retention rates for African-American and Hispanic students enrolled in developmental courses ranged from under 30% to over 80%, depending upon the institution (Boylan & Saxon, 1998). Some community colleges had 50% of their minority students graduate within three and a half years, whereas others had less than a 20% three and a half year graduation rate for minority students (Boylan, Sutton, & Anderson, 2003).
With societal changes that include an aging United States population, a growing demand for skilled labor, an increase in poverty, an increase in immigration, and an increase in the diversity of the population, remediation has become an issue in college education (Roueche & Roueche, 1999). Over 95% of community colleges offer remedial education courses in multiple ability levels and over 41% of entering community college students are under prepared in at least one of the basic skills which include reading and math. Over one million under-prepared students enter college and enroll in remedial programs on an annual basis. Thirty-four percent of these students are deficient in math, with 12% being Hispanic (McCabe, 2000).
P re E n tr y In it ia l C o m m it m en ts A ca d em ic S y st em S u b se q u en t C o m m it m en ts C h ar ac te ri st ic s G ra d e P er fo rm an ce A ca d em ic F am il y I n te ll ec tu al In te g ra ti o n B ac k g ro u n d D ev el o p m en ta l G o al G o al C o m m it m en t C o m m it m en t In d iv id u al P er si st en ce A tt ri b u te s In st it u ti o n al In st it u ti o n al C o m m it m en t C o m m it m en t P ee r-G ro u p P re -C o ll eg e I n te ra ct io n s S ch o o li n g S o ci al In te g ra ti o n F ac u lt y I n te ra ct io n s F ig u re 1 . T in to ’s M o d el f o r S tu d en t D ro p o u t fr o m C o ll eg e (M ad d o x , 2 0 0 4 )
For a national retention study, historical data for the Fall 2002 and Fall 2003 first-time-to-Northwest Vista College student cohorts were collected. Included in each cohort were students entering NVC in the Fall terms, regardless of their status as full-time/part-time, transferred, or entering as first-time degree or certificate seeking. The overall persistence rate for students at NVC during this time was 68%. For the Fall 2002 cohort, Blacks persisted at 72% from Fall 2002 to Spring 2003, while Whites persisted at a rate of 70%. The Fall to Spring persistence rate for Hispanic students in the same cohort was lower than that of the other ethnic groups as they persisted at a rate of 67%. For the Fall 2003 cohort, Fall to Spring persistence for White students was at 74%, while Fall to Spring persistence for Hispanics was at 64%.
Hispanic and Black students had the lowest success rates in developmental math in the Fall 2002 cohort. In 2002, out of 2,244 students enrolled in developmental Math courses, 65% Hispanic students successfully completed remedial Math courses as lower than that of the other ethnic groups as they persisted at a rate of 67%. For the Fall 2003 cohort, Fall to Spring persistence for White students was at 74%, while Fall to Spring persistence for Hispanics was at 64%.
Hispanic and Black students had the lowest success rates in developmental math in the Fall 2002 cohort. In 2002, out of 2,244 students enrolled in developmental Math courses, 65% Hispanic students successfully completed remedial Math courses as compared to 70% of their White peers. Out of the 2,138 students in the 2003 cohort that were enrolled in developmental Math courses, Hispanic success rates in remedial Math were at 64% as compared to 71% for their White peers.
S el f/ o th er s tu d en t in co n g ru en ce S o ci al a n d P sy ch o lo g ic al D ef ic ie n cy m o ti v at io n I n tr a-se lf i n co n g ru en ce S el f/ te ac h er i n co n g ru en ce M ed ia ti n g D ro p o u t S el f/ in st it u ti o n i n co n g ru en ce S el f/ o th er s tu d en t co n g ru en ce S u b en v ir o n m en ta l M ed ia ti n g G ro w th m o ti v at io n In tr a-se lf c o n g ru en ce S el f/ te ac h er c o n g ru en ce V ar ia b le s P er si st en ce S el f/ in st it u ti o n c o n g ru en ce F ig u re 2 . B o sh ie r’ s M o d el t o E x p la in A d u lt P ar ti ci p at io n a n d D ro p o u t (M ad d o x , 2 0 0 4 )
The problem of this study was to determine whether or not there was a significant difference in success rates between Hispanic students enrolled in developmental math courses at Northwest Vista College during the implementation of the Achieving the Dream initiative in the Fall 2005 semester. There were three specific questions in this investigation. They were:
1. Is there a significant difference in the success of Hispanic male students who were enrolled in their first developmental math course in the Fall 2005 semester compared to Hispanic female students who were enrolled in their first developmental math course in the Fall 2005 semester?
2. Is there a significant difference in the success of Hispanic students who were enrolled in their first developmental math course in the Fall 2005 semester who received financial aid compared with Hispanic students who were
enrolled in the same developmental math course during the Fall 2005 semester who did not receive financial aid?
3. Were background variables (socioeconomic status, gender, students’ age, parents attending college, and math ability), Education Participation Scale variables (Communication Improvement, Social Contact, Educational Preparation, Professional Advancement, Family Togetherness, Social Stimulation, and Cognitive Interest), and personal variables (goal
commitment, institutional commitment, intellectual development, peer group interactions, and faculty interactions) significant predictors of Hispanic
student success in each of the four developmental math courses during the Fall 2005 semester?
Since 1988, practices and policies in institutions of higher education have been dramatically affected by changes in affirmative action and the diminishing emphasis on need-based financial aid, even while growing numbers of Latinos have collegiate ambitions. The fastest growing ethnic group in the nation, Latinos have become a force that higher education must consider with more overt intention. The college-going rate for Hispanics between the ages of 18 and 22 has increased to 35% and their enrollments in undergraduate education by over 200% in the last 25 years. About 10% of Latino high school graduates now attend college (Fry, 2002). Just over 10% of Hispanics in the country now have a college education—less than the national average for adults, which is over 25%, but a large increase for their educational attainment even 10 years ago (U.S. Census Bureau, 2000).
One characteristic prevalent among first-time-in-college Hispanic students is high representation in remedial courses. Those that favor developmental coursework believe that institutional efforts provide several benefits to developmental students, including the impact on persistence (Boylan, Bonham, & Bliss, 1994). Opponents of developmental coursework say that remedial coursework may not be preparing students to handle non-remedial coursework and that the attrition rates of these students remain high once the students are enrolled in college-level courses (Cronholm, 1999).
The major purposes of this study were to:
1. Use the findings of this study to propose a model for improving Hispanic student success in community college developmental math courses.
2. Make recommendations for improving practices related to retaining Hispanic students in developmental math courses.
3. To offer recommendations for future research studies related to success frameworks in community colleges.
Assumptions
Listed below are the assumptions associated with this study:
1. The students selected for this study were representative of Hispanic students at Northwest Vista College.
2. The normal populations all had equal variance.
3. That the participants in the study were representative of the growing group of Hispanic students needing to enroll in developmental math courses in
community colleges.
Delimitations The delimitations for this study were:
• This study only involved the use of Northwest Vista College student data. • Only Hispanic students enrolled in developmental math classes at Northwest
Vista College were studied.
• The study was limited to evaluating the effectiveness of Achieving the Dream
initiatives as they related to developmental math education for Hispanic students and did not include these three student outcome indicators: (a) the successful completion of identified college-level courses, (b) productive grades in all courses (A-C), and (c) graduation.
Limitations of the Study There were several limitations in the study:
• This study was conducted at a single, Hispanic Serving, public community
college in Texas, so the results may not be generalized to other different community colleges.
• This study only looked at Hispanic student and success over one semester
(Fall 2005).
• This study only used a Hispanic population of developmental math students as
developmental math classes have more students enrolled in them than in developmental English and reading, according to Northwest Vista College institutional data.
• This study did not consider students who may have transferred elsewhere and
completed their education at other institutions.
Definition of Terms
1. Accuplacer- an adaptive test used by many colleges to provide placement,
advisement, and guidance information for students entering higher education. It is adaptive, meaning there is a pool of test times that are calibrated for difficulty and content.
2. Culture: Culture may be defined as a vigorous relationship comprised of beliefs, feelings, perceptions of experiences, and conduct in a certain situation (Bruner, 1986).
3. Curriculum: Curriculum is defined as an academic plan that includes the following components: purpose, content, sequence, learners, instructional process, instructional resources, evaluation, and adjustment (Stark and Lattuca, 1997).
4. Diversity: Diversity is traditionally defined as an assortment of individuals based on socioeconomic class, race, gender, and ethnicity (Alicea, 1995).
5. Developmental Math – Developmental math first focuses on basic
mathematical operations (addition, subtraction, multiplication, division, and square root) with signed numbers (including integers, decimals, and fractions); ratios and proportions; interpreting charts and graphs; informal geometry; and the use of these concepts in problem solving. Developmental math students progress through solution methods for linear equations and inequalities, graphs of linear functions, linear models, and the use of these concepts in problem solving. Next, the agenda includes factoring, arithmetic operations on polynominals and rational expressions, and the use of these concepts in problem solving. Finally, the focus falls on solution methods for quadratic equations and inequalities, graphs of quadratic functions, quadratic models, and the use of these
concepts in problem solving.
6. Ethnicity – Ethnicity encompasses the shared feelings, ways of thinking, and actions that comprise a culture based on a common ancestry. However, this definition is too expansive and does not included issues of the group’s power in society. Also, ethnicity may be a matter of choice for individuals as they may have roots in various ethnic backgrounds (LeCompte, 1999).
7. Financial Aid – Financial aid in this study was specifically referred to as the Pell Grant.
8. Hispanic student – a term that referred to any student who self-identified, on college information data as “of Hispanic origin” or who had a Hispanic surname (Brown, 2003).
9. Latino/a: Used interchangeably with the term “Hispanic”. Also refers to a group of Americans who share a language and common cultural origins but who come from diverse nations and backgrounds with distinctive histories and socio-economic and political experiences (Brown, 2003).
10. Minority: A term “minority” concerns the power position of a racial or ethnic group that is the object of discrimination and prejudice. A minority group includes the four characteristics of identifiability such as language or gender; differential power based on the group’s degree of difference; differential and pejorative treatment and the resulting loss of power; and increased group awareness (LeCompte, 1999).
11. Recruitment: The process of adding new individuals to a population. In this case, seeking to enroll Hispanic or Latino students (Fry, 2003).
12. Retention – A preservation of experience. Recognized variables related to student retention include: various student characteristics and student-institutional interaction; academic aptitude and performance; level of aspiration and motivation; institutional type, image, student services offered; and student involvement-plus the development of a sense of belonging or degree of fit that results from student and institution interactions (Bean, F., Capps, R. & Tyler, M, 2001).
13. Success – Success in this study referred to students achieving grades between an A and a C.
Organization of the Study
Chapter Two contains a review of literature as it related to research on retention of Hispanic students in institutions of higher education; retention and success of Hispanic students and other ethnic student populations; institutional significance; the need for developmental math; and societal implications.
Chapter Three contains a description of the methodology used to analyze data collected relative to Northwest Vista College’s participation in the Achieving the Dream initiative. Chapter Four contains a report of the results of the analysis of the data.
Chapter Five includes a summary, major findings, discussion, and recommendations for future practice and research.
CHAPTER TWO Review of Related Literature
Introduction
The following literature provided information on the enrollment and retention of Latino students in higher education. This chapter addresses Latinos in higher education today and focuses on how many Latinos attend college today and addresses the advocacy for Latino educational achievement in higher education. There is a need to enhance public understanding of the challenges Latinos face in accessing higher education. This can be accomplished by supporting public policies that help Latino educational
achievement and targeting resources toward the effort. This chapter also deals with institutional leadership. In order to improve a student’s educational achievement, it is required that thoughtful leadership determines student success, regardless of ethnicity. Another area covered in this chapter details the backgrounds of Latino college students. The patterns in college enrollment among Latino populations are closely linked with their socioeconomic profile. Mexican-origin Latinos have the lowest average household income among the native born. Among Hispanics, as with the U.S. population, the children from higher income families are more successful in obtaining a college education. Developmental education is addressed as there is a need for continued
Latinos in Higher Education Today
Many Latinos are first-generation college students, are low-income, have less academic high school education than their peers, and enroll in community colleges. Latinos are concentrated geographically in a small number of states and institutions of higher education. Between 50 and 55% of Latinos enrolled in higher education were in two states: California and Texas (National Center for Educational Statistics, 2001). Additionally, over 40% of Latino students were enrolled in the approximately 220 institutions identified as Hispanic Serving Institutions (HSIs) (National Center for Education Statistics, 2000a).
A large number of Latinos are enrolled in postsecondary education. Some
measures showed that greater shares of Latinos were enrolled in postsecondary education than non-Hispanic whites. Studies showed that many Latinos are pursuing paths
associated with lower chances of attaining a bachelor’s degree. Many Latinos are enrolled in community colleges, many attend school part-time, and yet others delay or prolong their college education well into their 20s and beyond. Many Latino students are also caring for a family. The aforementioned characteristics influence the decisions Latino students make in participating in and completing higher education. Latinos also lag behind in the pursuit of graduate and professional degrees. Among 25 to 34 year old high school graduates, nearly 3.8% of Whites were enrolled in graduate school, whereas only 1.9% of similarly aged Latino high school graduates were pursuing
post-baccalaureate studies. Nearly 85% of white students 18 to 24 years of age, the traditional ages for college attendance, were enrolled full-time. By comparison, only 75% of Latino traditional college-age students attended full-time. Latinos’ high levels of part-time
enrollment had adverse effects on their levels of degree completion (Fry, 2002). According to the U.S. Department of Education, part-time college enrollment was associated with a greater risk of accumulating college credits with no degree to show for the effort.
Economics and an attachment to family and community are factors in Latinos’ high rate of enrollment in two-year colleges. Among 18 to 24 year olds, 44% of Hispanic undergraduates attended a two-year school, as opposed to about 30% of both white and black undergraduates. Latino students over the age of 24 years old were more likely than their peers of any other ethnic/racial group to be enrolled at two-year institutions. As Latinos get older, there was a greater share that attended two-year colleges. An
extraordinary percentage of Latino undergraduate students over the age of 35 years old attended two-year colleges.
Community colleges and other two-year institutions typically feature a number of characteristics that appeal to Latino students. Tuition is lower at community colleges compared to four-year institutions. Degree programs are designed to accommodate part-time students and classes are scheduled in the evenings to accommodate students with full-time jobs. Many two-year colleges offer courses that aim more at improving job skills rather than at advancing a student towards a degree. Community colleges are usually located near residential areas and rarely feature dormitories. One characteristic shared by most Latinos regardless of national origin or income is an emphasis on close family ties. Many community colleges also welcome students with low levels of academic achievement or aptitude, with many offering classes in English as a second language. Also, many community colleges have transfer agreements with baccalaureate
institutions so that credits earned at a two-year school can be applied towards a four-year degree. This provides an inexpensive and accessible way for a student to complete a bachelor’s degree. Degree completion lagged for students who began at two-year colleges. More than half of students that initially enrolled at two-year colleges never completed a postsecondary degree. In comparison, almost six in ten four-year college entrants completed at least a bachelor’s degree (Kane and Rouse, 1995a). A recent study was conducted that followed college students for three years after their initial enrollment. Among Latino students, 39% of those who began at other than four-year colleges had no degree and were no longer enrolled after three years. In comparison, only 18% of those who began at four-year schools had no degree and were no longer enrolled in school (National Center on Education Statistics, 2000a).
Even though many Latino high school graduates may be furthering their
education and skills at college campuses nation-wide, few are gaining a bachelor’s degree and then moving on to the highest levels of the United States higher education system. Latinos are trailing in the pursuit of graduate and professional education. In the 25 to 34 year-old age bracket, which is the typical age for graduate school attendance, 3.8% of White and 3.0% of African-American high school graduates are enrolled in graduate school. Only 1.9% of similarly aged Latino high school students were pursuing a
graduate degree. Latinos have the lowest rate of graduate school enrollment of any major racial/ethnic group. Graduate school enrollment mirrors a number of factors. First is the relatively low number of Latino students gaining a bachelor’s degree, which is obviously a necessary prerequisite for graduate studies. Lacking advanced degrees, Latinos have
been underrepresented in the nation’s most prestigious job opportunities that would undoubtedly hurt our economy in the future (Kane and Rouse, 1995b).
Even though Latino enrollment in college is extensive, it is low at the traditional college-going age. Studies have shown that college is most advantageous for students who are 18 to 24 years old, the traditional age for college attendance. Among high school graduates 18 to 24 years old, 35% of Hispanics were enrolled in college compared to 46% of Whites and 40% of Blacks. College students in the traditional age range were more persistent in pursuing their education. These students were more likely to earn a bachelor’s degree and go on to attain valuable advanced degrees (National Center for Education Statistics, 2001). From a strictly economic standpoint, the wage gains from completing a college education diminished as the student aged. Individuals who earned their degrees at a younger age earned more earning power than older graduates. The earnings are not only bigger, but a person had more time to reap those benefits by completing their postsecondary training earlier in their lives. College enrollment at a later age was also more costly. Older students usually earned more money and they wound up deferring more income than a younger student if they chose to pursue an education than work. Significant numbers of Latinos attended college at ages that did not provide them with maximum benefits (Monks, 1997).
Advocacy for Latino Educational Achievement
There are a significant number of first-generation Latino students who are unfamiliar with our educational system and they look to their families for guidance. Many Latino parents, though, are limited in their ability to help them with higher education decisions. Latino students navigating the system alone feel the absence of
family and community members who have already gone through the process. As first-generation college students, many Latino students relied on formal sources of information to tell them how to prepare for and participate in higher education. College information that is available through high school counselors or through college fairs typically did not target parents. It was up to the student to gather the necessary information and then have the parents help in some manner. Advocates of Latino education needed to understand how Latino parents and first-generation college students viewed the education system and then inform them about the choices they needed to make and the consequences of those choices. One important concern that Latino parents had was the cost of college (Lowell & Suro, 2002).
Many Latino families did not research the cost of college or the sources of
financial aid. Because of this, they deemed college to be too expensive for their children. Many Latino families did not have an understanding of the different aspects of financing a college education. This has led Latinos to either not consider college or limit
themselves to choices that meet a particular sticker price. The financial concern moved students to enroll in community colleges because it was both affordable and closer to home.
The admissions process was another hurdle that many first-year Latino students faced. Latino students may not have known the process needed to register for entrance exams, such as the SAT, nor have applied for financial aid before applying for college. Research showed that if students took the SAT, applied for college, and then applied for financial aid, their chances of going to college were deemed to be high regardless of what
they scored on their SAT or the amount of financial aid offered (National Center for Education Statistics, 2000b).
There was a national strategy aimed at addressing any informational gaps in promoting a college education to Latino families called College is Possible. The
American Council on Education offered this and it focused on getting the word out early and often to students and their parents that a college education was both affordable and possible. An application of this strategy was part of the Kellogg funded ENLACE (Engaging Latino Communities for Education) initiative that involved 13 communities throughout the country in a linked effort to support students ranging from the seventh grade to college entrance (American Council for Education, 2002).
Education policy had always had an impact on the access and retention of students from different backgrounds. Only since the mid-1990s, had there been broader federal and state policies that focused explicitly on Latinos in higher education. Because of the rollback of affirmative action practices, California, Texas, and Florida adopted a plan in which a given percentage from the top of the graduating class of each high school in the state would be given automatic admission to the states’ universities. In 1997, Texas adopted a plan that mandated that all 35 public universities must have offered automatic enrollment to students who graduated in the top ten percent of their high school class. Unfortunately, research showed that many Latino youth were segregated in
schools with poor academic and physical resources. While more Latinos might have been eligible for automatic admission, they may not have been academically prepared to take advantage of this benefit. This automatic admission did not address students’ financial or support needs. Many universities in Texas found that they still needed to
combine need and merit-based financial aid and academic and social support to successfully recruit and retain Latinos in higher education (Brown, 2003).
The most important piece of federal higher education legislation affecting Latino access and success in college was the Higher Education Act. This piece of legislation authorized student outreach and support programs such as TRIO (Upward Bound, UB Math/Science, SSS, Talent Search, and McNair) and GEAR Up that were run by the U.S. Department of Education. These programs have helped facilitate increased access to higher education for Latinos and other historically underserved populations while at the same time, also promoting institutional and community alliances. Title V’s Developing Hispanic-Serving Institutions (HSIs) program provided support on a competitive basis to HSIs. HSIs are accredited, nonprofit institutions of higher education that enroll a quarter or more Hispanic undergraduate full-time (FTE) students as long as the institutions have low educational and general expenditures and enroll a large number of needy students. Identifying a specific set of institutions to receive state or federal resources was one way to facilitate success for Latinos in higher education. Not all Hispanics attended HSIs, though, so aid to HSIs could not be the answer to satisfy the needs of Latino students. Focusing on the policies and practices of institutions that graduated larger numbers of Latino students was another way to help ensure Latino educational achievement (Brown, 2003).
There are over 200 HSIs in the United States. Of these, 66 institutions were in California, which served almost 130,000 undergraduate FTE Latino students. Estimates revealed that three-quarters are two-year institutions with most being public. HSIs were not created explicitly to serve Latinos, but they were located in communities that had
high concentrations of Latino students. HSIs were there to create an opportunity to aim services, resources, and information about opportunities for higher education at large numbers of Latino students throughout the K-16 educational mode (Brown, 2003).
Institutional Leadership
Campus leaders can shape the climate by articulating institutional goals and holding faculty and staff accountable for meeting expectations with respect to student success. For policy implementation to be effective, it required a commitment from all sectors of the campus to eliminate barriers that were high for first-generation Latino students. A commitment that began at the top could filter on down to the faculty, whose composition should mirror the student body. It could also be evident in the hiring of new colleagues who valued the student population. Administration had to make sure that efforts to retain students should not be isolated but systemic. The institutional culture must have created a successful environment for Latino students that were understood as a learning experience. A committed college would welcome Latino students as assets and should have viewed their arrival as a part of achieving its mission. An example of such a college is Northeastern Illinois University. The school had adopted a student/learner-centered goal that defined specific actions the entire community took in improving achievement. Among these was an early intervention program for students on probation after one semester. The school had been successful in reducing the percentage of
students on probation by almost half. A Faculty Teaching and Learning Center was established with external funding that offered workshops on pedagogy. Advising first-year students became a big component of the program. At the end of the first five first-years
of the program, retention of first-year students increased by seven percent. Latino students were retained at the same rate as white students (Brown, 2003).
Backgrounds of Latino College Students
Native-born Latino high school graduates were more successful in pursuing college studies than their immigrant peers. About 42.4% of second-generation 18 to 24 year old Latino high school graduates were attending college (Vernez & Abrahamse, 1996). This was near the white rate of 45.8%. The performance of the Latino second generation in attending college was widespread across all origin groups. Among the 18 to 24 year old high school graduates, nearly 55% of second generation Central and South American youth attended college. About half of Cuban and 42.7% of Mexican
generation high school graduates attended college (National Center on Education Statistics, 2000b).
In regard to income, Cubans as well as Central and South Americans tended to be among the better-off Latino households with average household incomes above $40,000. Mexican origin and Puerto Rican households tended to be less well off, with average household incomes below $37,000, which was below the average household level of African-Americans (Bean, 2001). As stated earlier, Native-born Latino households tended to be richer than foreign-born households. Mexican-origin Latinos had the lowest average household income among the native-born at $42,000. This was well above the African-American average household income. The more one was wealthy meant that they would become more successful in obtaining a college education (Vernez & Mizell, 2001).
Studies on Latino Retention in Colleges and Universities
Amaury Nora developed his Model of Student Engagement that incorporated theoretical perspectives from sources such as Tinto. The model held major components such as pre-college/pull factors, sense of purpose and institutional allegiance, academic and social experiences, cognitive and non-cognitive outcomes, goal
determination/institutional allegiance, and persistence. Studies conducted by Nora, Castaneda, and Cabrera (1992) and Cabrera, Nora, and Castaneda (1993) established that the educational dedication of Hispanic college students was a prominent component in affecting the intentions of this group of students to have returned for their second year in college. Research indicated that Hispanic college students possessed the desire to earn an undergraduate degree that they brought with them upon entering college. The high expectations Hispanics had were formed as early as elementary school (Rendon & Nora, 1997) and remained high even though research indicated that most of them would enroll in community colleges.
Other studies (Cabrera & Stampen, 1988; Cabrera, Stampen & Hansen, 1990; Cabrera, Nora, & Castaneda, 1993) conducted validated the importance of financial assistance in the persistence process. Cabrera (1992) found in his study that financial aid did create an equal playing field among recipients that were mostly minorities and non-recipients that were largely non-minorities. Cabrera, Nora, and Castaneda (1993) revealed in their study two tangible aspects of financial aid. The first aspect, which they referred to as the tangible component, was the actual awarding of financial aid. The attitude associated with having received financial assistance was referred to as the intangible component. Both components were found to directly and indirectly influence
the decisions of Hispanic students to remain in college. The assumption was that the intangible component was not only a reflection of stress reduction that came from being able to pay for college-related expenses but, this may have also represented a student’s commitment to their respective institution that centered on the idea that the institution provided students the financial means to have remained in college.
The majority of research on the influence of social experiences on minority student persistence had centered on informal contact between students and faculty (Pascarella, 1985; Iverson, Pascarella, & Terenzini, 1984; Smart & Pascarella, 1986). More recent research had focused on the impact of the adjustment of students to college and not simply on persistence (Nora & Cabrera, 1996; Cabrera, Nora, & Castaneda, 1993). The influence of social experiences on persistence had mostly been found to be minimal for minorities. Nora’s (1987) research on Hispanics at community colleges established that the influence of social experiences was felt on the student’s academic performance and, in some extent, on persistence decisions (Nora & Cabrera, 1996).
Studies that have been conducted by Cabrera and Nora (1994); Nora, Castaneda, and Cabrera (1992); Allen (1988); and Braddock (1981) found that the student’s
commitment to an institution exerted a positive affect on a minority student’s decision to remain enrolled in college. Nora and Cabrera (1996) tested the influence of a minority student’s commitment to his or her institution separately from those of non-minority students. The results validated this commitment as a driving force for non-minority students in their decisions to re-enroll. This factor, though, was not significant in
institution affected non-minorities, other cognitive and non-cognitive factors were much more powerful in affecting minority students’ retention.
Nora and Wedham (1991) studied the influence of environmental pull factors on the persistence of college students. In their analysis they identified three constructs that exerted a pulling-away effect both on the student’s decision to remain enrolled in college and his or her social and academic integration on campus. The three factors included: family responsibilities, such as taking care of a family member or an entire family; working off campus while enrolled in college courses; and commuting to college every day. They confirmed that those students that had family responsibilities or were having to go to work off-campus could not fully integrate socially and academically and ultimately had to drop out of college. Nora, Cabrera, Hagedorn, and Pascarella (1996) found that minorities who had to leave campus to work were 36 percent more likely to have dropped out of college and minority women who had to deal with taking care of a family member were 83% more likely to have withdrawn from college. This sample consisted of both Hispanic and African-American college students. Having to commute to college was found to affect student decisions to remain enrolled, although there were no differences found between minorities and non-minorities.
In a study by Nora and Cabrera (1996), they found that Hispanic students were more prone to sense discrimination and prejudice in the classroom and on campus. These perceptions were found to have affected their academic performance, their academic experiences with faculty, their social experiences on campus, their academic and
intellectual development, their commitment to an institution, and their decisions to have remained in college. They also found that almost every aspect of a Hispanic college