Seshadri Tirunillai
Gerard J. Tellis
Seshadri Tirunillai is a doctoral candidate and Gerard J. Tellis is Professor of Marketing, Management and Organization, Director of the Center for Global Innovation, and Neely Chair in American Enterprise at Marshall School of Business, University of Southern California. This study benefitted from a grant by the Marketing Science Institute and a generous gift of Don Murray to the USC Marshall Center for Global Innovation. Address: HOH 814, Los Angeles, California, 90089-0443. USA. Tel: +1.213.740.5031, fax: +1.213.740.7828, E-mail:
Does Chatter Really Matter? Dynamics of
User-Generated Content and Stock Performance
Abstract
User-Generated Content (UGC) in online platforms provides a valuable source of
consumer feedback on market performance of firms. This study examines whether UGC is related to stock market performance, which metric of UGC has the strongest relationship, and what the dynamics of the relationship are. The authors aggregate UGC (in the form of product reviews) from multiple websites over a four year period across six markets and fifteen firms. They derive multiple metrics of UGC and use multivariate time series models to assess the short and long term relationship between the metrics of UGC and stock market performance (abnormal returns, risk, and trading volume).
The findings reveal that UGC is moderately correlated with abnormal returns, risk, and trading volume. Of all the metrics of UGC, chatter (volume) shows the strongest relationship with abnormal returns and trading volume. The effect of negative and positive metrics of UGC on abnormal returns is asymmetric. Whereas negative UGC has a strong effect on abnormal returns and trading volume with a short “wearin” and long “wearout,” positive UGC has no effect on these metrics. Idiosyncratic risk increases with negative information in UGC. These results have important implications for managers and investors.
Keywords: User-Generated Content, stock returns, online word-of-mouth, Vector Auto-Regression (VAR), computational text processing.
Introduction
With the popularity of online media, consumers now go beyond their role as passive seekers of information to actively and regularly share their experience with others on online platforms such as communities, blogs, product reviews, and wikis. The body of information that consumers so generate is popularly referred to as User-Generated Content (UGC). UGC is one aspect of a broad phenomenon of inter-consumer communication called word-of-mouth. While consumer input is available to a small extent in traditional media (e.g., letters to editors and consumer complaints), its popularity in new online media is relatively massive (thousands per day) and growing rapidly. Estimates for 2010 are that 131.4 million users consume and 95.3 million users create UGC (eMarketer, January 2009). UGC may be more important and impactful than traditional word-of-mouth because of its instant availability, low cost, ease of use, wide subscription, wide access, and wide reach. It is also growing more rapidly and easier for firms to measure and monitor than traditional forms of word-of-mouth. Studies suggest that UGC has higher impact on subsequent consumer choice than traditional marketing activities of the firm (Trusov et al 2009). Most importantly, UGC is available at a highly disaggregate temporal level (days, hours, minutes). Thus, when sales or customer satisfaction are not available at such a disaggregate level, UGC could provide some indication of how the brand is doing.
This study focuses on the relationship between UGC and stock market performance of the firm. Prior research indicates that the stock market responds to the assessment of quality by experts’ published reviews of products (Tellis and Johnson 2007). Studies in finance investigate the impact on stock market performance of print news (e.g., Tetlock 2007; Tetlock et al 2008) or traders’ online financial
recommendations in Internet message boards (e.g., Das and Chen 2007). Unlike the print media or third party reviews, UGC reflects the opinions and experiences of a large number of active users of the product, thus benefitting from the “wisdom of crowds” (Surowiecki 2005). It reflects the accumulation of
We restrict our study to two forms of UGC – product reviews and product ratings. These two forms of UGC are rich in product related information. Other forms of UGC such as videos and blogs have a greater deal of information with little relevance to specific products and brands. Thus, the signal to noise ratio in product ratings and reviews is much higher than that in videos, blogs, and networking sites.
Table 1 classifies the literature on consumer generated data on five dimensions. The current study differs from prior research in many respects (see Table 1). First, while Luo (2009) conducts an insightful study on the impact of negative word-of-mouth on stock returns, his study draws data from traditional media and uses one form of negative content (complaints), in one industry (airlines). UGC, unlike other forms of word-of-mouth communication, leaves a digital trail of consumer opinion on all aspects of a product, including both positive and negative word-of-mouth. Second, several studies examine the interaction among consumers or the impact of UGC on demand/sales (e.g., Dellarocas et al. 2007; Dhar and Chang 2009; Liu 2006; Chintagunta et al 2009; Chevalier and Mayzlin 2006; Trusov et al 2009; Moe and Trusov 2011) but not the impact of UGC on stock market performance. Third, most studies on UGC use a narrow set of metrics such as numerical ratings or volume, ignoring the information content of text in these reviews, which is rich in consumer expressions (see Table 1). Fourth, all prior studies focus on a single market such as movies, books, or airlines. In contrast, the current study is unique in that it focuses on the impact of UGC on stock market performance, using four metrics of UGC, and three metrics of stock performance, across 6 different markets (see Table 1).
In particular, this study seeks answers to the following questions:
Is there a relationship between UGC and the stock market performance of the firm? If a relationship exists, what is the direction of causality?
Among the various metrics of UGC, which metric bests relate to stock performance of the firm? What are the dynamics of the relationship in terms of wearin, wearout, and duration?
Our choice of stock market performance as the dependent variable has three benefits. First, as a measure of shareholder value, market performance is the ultimate concern of the firm and increasingly
at the daily level allowing for granular analysis, whereas sales, profits, and earnings are not as easily available at this level for most firms. Third, by indicating what metrics of UGC impact stock
performance, this study suggests the metrics of UGC that should concern managers.
The rest of the paper is organized as follows. The second section presents the theory, the third section explains the method, the fourth section describes the measures, the fifth section describes the models, and the last two sections present the results and discussion.
Theory: Relationship between UGC and Stock Market Performance
This section builds the theory for the relationship between UGC and stock market performance. It answers four questions. Why might UGC be value-relevant to investors? Why would UGC be a leading indicator of stock market performance? Why would its effect be delayed? Why would this effect be asymmetric across measures?Value-Relevance of UGC to Investors
Although firms provide information to investors through financial statements and other
disclosures, numerous studies have shown the existence of asymmetric information between firms (e.g., managers) and investors, resulting in capital market imperfections (Healy and Palepu 2001). Hence, investors may seek information on firms’ performance from alternate sources such as investigative reports or experts’ reviews in various news media. Investigative reports have a direct impact on stock market performance (e.g., Mitchell and Mulherin 1994); the effect of an expert’s reviews on stock prices is also known and is fairly instantaneous (Tellis and Johnson 2007). However, UGC is a direct expression of consumers’ personal experience and uncovers feedback on products which may not be evident in
investigative reports or experts’ reviews in the media. Investors may consult UGC for such unanticipated information about product performance that is not already available in established media reports or experts’ reviews. In a study by Brunswick group of over 448 investment personnel (equity analyst or institutional investors) about 43% of them suggested that UGC has become an important determinant in
their investment decision in the recent years1. Also, our discussions with investment houses suggested that many of them regularly monitor new media for various firm related information.
UGC as a Leading Indicator of Stock Market Performance
UGC could predict stock market performance for two reasons. First, in a perfect market with transparent information systems, all information on the firm would be available immediately to all investors. Unfortunately, information on the firm is usually available sporadically (e.g., disclosures, company press releases) or at a low frequency, usually monthly or quarterly (e.g., corporate reports, earning statements, or sales reports). Most investors probably depend on firm specific information in media stories, site visits, or reports from security or industry analysts, which are also available at a low frequency. Unlike these sources of firm performance, UGC could be observed at a relatively high
frequency (daily). Thus, UGC could present new information about the current performance of the firm at a greater temporal frequency than otherwise available to investors. Subject to Granger causality tests, it also has the potential to act as a leading indicator of firm performance (for more details refer Srinivasan, et al 2010).
Second, consumers who have bought the product might chat about the product on the web. Other consumers who are uninformed about products or who are undecided about which brand to buy may consult UGC to finalize their decision. The online reviews and discussion could subsequently affect their decisions. At the aggregate level, these decisions would translate into future sales, cash flows, and stock market performance. Thus, daily UGC could predict future performance ahead of firms’ reports on quarterly sales and cash flows.
Delay in Response to UGC
The information in UGC might take from a few days to weeks to be fully reflected in stock market performance, for three reasons. Firstly, for traders to benefit from the information, they have to
systematically monitor and extract information from UGC as has been done in this study. Unfortunately, most investors may as yet not have the awareness and sophistication to monitor UGC continuously at a daily level. Investors might as yet incorporate the information slowly over a couple of days. Secondly, transaction costs for the investors may be high enough that they cannot make profitable trades by immediately acting on the information gained. Thirdly, these dynamics can also be attributed to the slow diffusion of information about the firms (e.g., Lo and MacKinlay 1990; Hong and Stein 1999). This pattern holds even more strongly in the case of UGC as the information has to diffuse systematically and evenly between the consumer markets and the stock markets. Thus, the information in UGC might take a few days or weeks to be fully reflected in stock market performance.
Asymmetric Response Across UGC Metrics
The content of UGC, as either overall positive or negative, could affect the decisions of investors asymmetrically for three reasons. First, investors discount or overlook the positive information because they suspect it is unreliable or because they find it less diagnostic than negative information. This effect may be due to negativity bias, according to which negative information elicits a stronger response than positive information (Baumeister et al 2001; Rozin and Royzman 2001). Second, for investors, negative information may be more important than positive because losses loom larger than gains (Tversky and Kahneman 1981). Third, positive information about products, especially on new products, are usually well known and actively propagated by firms even before the launch, through actions such as
announcements and advertisements; whereas negative information is usually not anticipated as it is an uncontrolled outcome of experience of consumers. For any of these reasons, negative metrics may have a stronger impact on returns than positive metrics of UGC.
In sum, because investors do not currently have perfect information about the firm’s performance from firm and media reports, UGC could provide an additional source of information and may affect investors’ decisions and stock market performance.
Method
This section describes the research design and data collection.Research Design
The following subsections explain the sampling of firms and markets, time, and media.
Sampling of Firms and Markets
We select firms, products, and markets on several criteria to ensure the feasibility, validity, and reliability of the study. First, the product categories must have rich data on UGC across the time period of investigation. Digital products, high tech products, and popular consumer durables fall in this class. Second, the products reviewed have to constitute a major fraction of the firm’s sales, so that web chatter about the product would provide a strong signal about the firm’s performance. For example, mobile phones constitute the bulk of Nokia’s sales. However, for highly diversified firms such as GE, P&G, or J&J, the chatter about individual products may not always be congruent and may not provide a single clear signal. Third, firms have to be listed on one of the U.S. stock exchanges (NASDAQ/ NYSE/ AMEX) because stock market performance is the dependent variable. Fourth, firms included in the sample should not have undergone identity changes (such as by mergers or acquisition) during the given time period. Fifth, the sampled markets should represent a cross section of markets.
The use of these criteria, leads to our selection of the following six markets: (firm sampled are in parentheses) - personal computing (Hewlett Packard Company and Dell, Inc.), cellular phones (Motorola, Inc. and Nokia Corporation), personal digital assistants or smartphones (Research In Motion Limited and Palm, Inc.), footwear (Skechers USA , Inc., Timberland Company and Nike, Inc.), toys (Mattel, Inc., Hasbro, Inc., and Leap Frog, Inc.) and data storage (Seagate Technology, Western Digital Corporation and SanDisk, Inc.). In each of these markets, we sample as many firms as fit the above criteria. To the best of our knowledge, this is the broadest sample among all published studies on UGC in marketing.
Time Sampling
We choose four and a half years from June 2005 to January 2010 for our analysis. UGC on selected websites is rather sparse before June 2005. Because both UGC and stock prices are available at very low granularity, we chose the daily level of analysis. Higher levels of aggregation (weekly or monthly) may lead to biased estimates (Tellis and Franses 2006) while lower levels of aggregation (hourly) have sparse data on UGC.
Sampling of Media and Sources
We use four criteria to select the format and sources of the media for this study.
First, consumers generate content in a variety of online media formats such as text (blogs, product reviews) and videos (video blogs, postings on video sharing sites such as YouTube). However, during the period under consideration, consumers did not use media such as video much to voice their opinions on products . They used UGC such as product reviews extensively for this purpose.
Second, we choose consumer reviews of products because consumer reviews focus tightly on product evaluations, unlike blogs, forums, and bulletin boards, where the conversations digress greatly from product-related issues, greatly diluting the signal to noise ratio.
Third, we focused on consumer reviews rather than expert reviews (e.g., cnet.com, zdnet.com) because consumer reviews reveal experiences of a large number of consumers of actual product
performance over extended periods in natural environments (Chen and Xie 2008). As such, they provide strength in numbers or the “wisdom of crowds” (Surowiecki 2005. Moreover, consumer reviews have a big and growing influence on their purchase decisions (A. C. Nielsen report 2007).
Fourth, for sources of consumer reviews, we use three popular websites - Amazon.com, Epinions.com (a service of Shopping.com, Inc., an eBay company), and Yahoo Shopping (service of Yahoo.com that allows us to access reviews from affiliate sites). These sources are among the most popular websites for consumer reviews and have a very high reach and acceptance among consumers, reflected in the number of unique visitors and the number of years of existence. The parent websites of all
the unique visitors during data collection (Nielsen report 2007). This ranking is also consistent with the comScore ranking (Yahoo! sites – 2, eBay – 6 and Amazon – 7) (comScore Media Metrix, 2008).
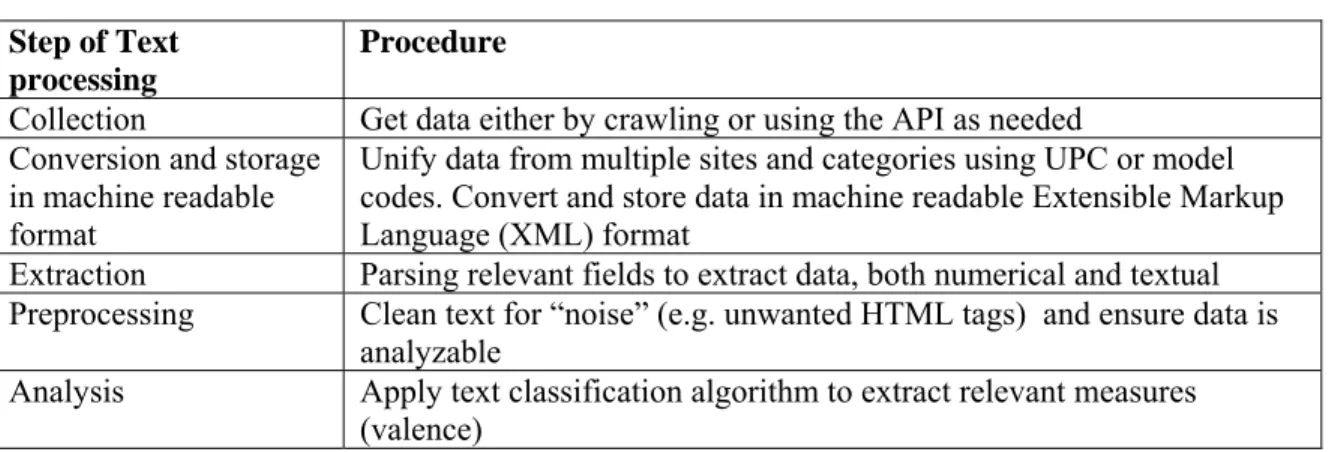
UGC Data Collection
Since the UGC data is not efficient to collect or process manually, we resort to automated techniques for data collection and analysis. Here, we briefly outline the procedure adopted for data collection and pre-processing. Details are in the attached Online Appendix A.
The data collection for UGC varies for each site, as no one standard method can get data from these disparate sites. In the cases where the sites allow access to data through some Application Programming Interface (e.g., Amazon Web Services or Yahoo Shopping), we use that approach. In the case of epinions.com, where no web service is available, we develop scripts to collect data from the site periodically. We store the collected reviews at a disaggregate level (individual review) so that we can parse the individual reviews and aggregate them for our analysis. We extract and store numerical data, such as ratings, in numeric format. In total, the sample contains 347,628 reviews between June 2005 and Jan 2010.
To arrive at the valence of the reviews, we use two algorithms proven to be reliable for text classification applications in a specific domain (such as product evaluation): Naïve Bayesian classifier and Support Vector Machine classifier. Thedetails are in the attached Online Appendix A. We use voting between these algorithms to arrive at the valence of the review as has been done in the prior literature (Das and Chen 2007). Almost 94% of classifications of the reviews are in agreement between the two algorithms. Among the rest, we resort to manual classification if the total number of words in the reviews is more than ten. We discard those reviews that have ten words or less due to lack of information content in these text. We then aggregate the individual consumer reviews of a particular firm in any given day. Doing so, we derive the daily time series data for each metric of UGC for every firm in our sample.
Measures of UGC
UGC can be characterized by several metrics (e.g., Godes and Mayzlin 2004; Liu 2006). We restrict our analysis to four important metrics: ratings, chatter, positive valence, and negative valence. We explain each of these metrics below.
Ratings
The simplest measure that we use is consumer ratings. Ratings are the numerical assessment of the product by consumers based on a numeric scale designed by each website (on a one (bad) to five (good) scale). We measure the aggregate rating of a firm by taking the arithmetic mean of all the individual ratings of a firm across websites in a day.
Chatter
Chatter refers to the total number of reviews posted by consumers about the products of a firm in a day. This measure reflects the magnitude of coverage received by the firm in UGC.
Valence
Valence of UGC refers to whether the overall review is positive or negative. We derive the valence of a review from an analysis of the text in the reviews using computational procedures as explained in the Online Appendix A. The statistical algorithms used for the binary text classification of the reviews are proven to be robust (e.g., Domingos and Pazzani 1997. Joachim 1998). We classify the review as positive or negative and then count the number of classified reviews for a given firm in each time period which constitutes the positive or negative chatter, respectively. In the tests of Robustness, we test alternate measures of valence by counting the number of positively (or negatively) laden words for each firm in a given time period.
Measures of Stock Market Performance
This subsection explains the method for the measurement of the three measures of stock market performance: abnormal returns, idiosyncratic risk and trading volume. We first specify the firm’s daily
expected return using the Fama-French (1993) three factor (plus the Carhart (1997) momentum factor) model, where the factors account for market wide factors influencing a firm’s returns. Prior studies in marketing have used this technique to measure for firm’s abnormal returns and idiosyncratic risk (e.g., Sood and Tellis 2009; Luo 2009; Wiles et al 2010; Tuli and Bharadwaj 2009). We derive two financial measures from this model: the estimated abnormal returns and estimated conditional volatility (risk) this model.
We model the conditional variance of the error in this model as an EGARCH process
(Exponential Generalized Autoregressive Conditional Heteroskedasticity, Nelson 1991) to account for the time varying nature of the firm’s risk. The EGARCH specification is proven to have a better fit than any of the other conditional heteroskedasticity specifications and helps capture the asymmetry of conditional volatilities (e.g., Fu 2009; Huang et al 2010; Engle and Ng 1993). We specify the returns of a firm as:
i,t f,t i i,MKT MKT,t f,t i,SMB t i,HML t i,MOM t i,t
1/ 2 , , 2 2 , , , 1 , 1 1 , , ,
R -R = +
(R
-R )+
SMB +
HML +
MOM +
2
(
)
(
)
~
(0
,
p q i t k i t k i t i i t i t i k j k i t k i t k i t itln
a
b ln
c
r
N
whe e
ò
ò
(1)where, t is the subscript for the time period, i the firm specific index,
R
i t, is the returns2 of the stock i in time t,R
MKT t, is the market portfolio return (CRSP value weighted index),R
f t, is the risk-free rate of return (thirty day treasury bill),SMB
t is the small minus big capitalization factor,HML
t is thehigh minus low book-to-market equity factor, and
MOM
t is the momentum factor in the given time period. The are the factor loading and a, b, and c are the coefficients of the risk process.Prior studies across marketing and finance use similar measures of idiosyncratic abnormal returns and risk (e.g. Tuli and Bharadwaj 2009, Luo 2009; Fu 2009; Huang et al 2010). We run this regression for a rolling window of 250 trading days prior to the target day to get the estimated factor coefficients of
the Fama-French model (Equation 1). The risk adjusted returns (abnormal returns) on time period 1 is taken as the estimated abnormal returns of a firm for that period (e.g. Avramov et al 2009). Specifically, the abnormal return for a firm in time period 1 is:
MKT,t+1 t+1 t+1 t+1
i,t+1 f,t+1 i,MKT f,t+1 i,SMB i,HML i,MOM
[R
-R
]-{
(R
-R
)+
SMB +
HML +
MOM }
(2)Henceforth, in the interests of brevity we use the term “returns” for “abnormal returns.” The idiosyncratic risk is the estimated conditional variance , of the residuals. Prior studies (e.g., Fu 2009) show that the estimated conditional variance provides an accurate estimate of the idiosyncratic risk3. . We repeat this procedure on a rolling basis for all the trading days in the sample to get the returns and
idiosyncratic risk for each day.
We measure trading volume as the daily turnover which is measured as the volume of trade of a firm in a given day adjusted for the number of shares outstanding at the end of the day (e.g., Campbell, Grossman, Wang 1993; Chordia and Swaminathan 2000), thus controlling for any potential firm size effects. All the financial data for calculating stock returns, trading volume, and the factors used in the model are from the Center for Research in Security Prices (CRSP).
Measures of Control Variables
We describe the measures of four control variables: analysts’ forecasts, advertising, media citations, and new product announcements.
Analysts’ Forecasts
The analysts’ forecasts are measured as the median estimate of the analysts’ consensus forecast of the earnings obtained from the I/B/E/S database.
3 We find different permutations of EGARCH (p, q) specifications (EGARCH (1, 1), EGARCH (1, 2) and so on till EGARCH (3, 3)), for day t+1 for each of the individual stocks. We then choose the specification with the lowest
Advertising
A firm’s advertising spending is the daily dollars spending on television advertising by a firm obtained from TNS Media Intelligence.
Media Citations
Media citations are the number of articles in the print media on the firm in any given day from Lexis Nexis and Factiva. We search for relevant firms or firms in these databases as follows. First, we do an elaborate search for all articles that mention the name of the firm or brands (or sub-brands) in our sample. We search across major newspapers, dailies, and news wire services (including Wall Street Journal which is covered by Factiva) in each of these databases for each day within the time horizon of our study. Lexis Nexis assigns a relevancy score for each article in its index and assigns it in the
corresponding tags in the results. We use this score to ensure that the articles do indeed discuss the brand or the firm of interest and are not incidental mentions in the article. Specifically, we identify the articles that are relevant to the firm if an article is identified as having a relevancy score of 60% or more in the Lexis Nexis indexing with respect to the given firm name. Similarly, for Factiva, we use the company tag, which shows if the search result is indeed relevant to the firm under investigation.
New Product Announcements
We also use the above databases and method to obtain announcements of new products for each firm in each category. In addition to the rules above, we identify firm specific new product
announcements using the procedure outlined in Sood and Tellis (2009).
We then merge the UGC data with the financial data (returns, idiosyncratic risk, trading volume), advertising data, new products data and analysts’ forecasts based on firm and date, to get the 1112 trading days of data.
Models
This section describes the models for estimating the relationships between measures of UGC and measures of stock market performance. It covers rationale for the model, tests for stationarity and units roots, test for Granger Causality, model specification, and modeling dynamics.
Rationale for VAR
We adopt the persistence modeling framework using the Vector Auto-Regression (VAR) for our empirical investigation. VAR is suitable for examining the dynamics of the relationship between UGC and stock performance for several reasons. First, VAR is appropriate for this study as opposed to event studies, as UGC is generated continuously over time and not a discreet event (Campbell, Lo and McKinley, 1997; Srinivasan and Hanssens 2009). The VAR model allows us to examine the immediate and lagged term effects of different UGC metrics on stock market performance (Dekimpe and Hanssens 2004). Second, it allows us to account for direct and indirect feedback effects among the endogenous variables (here, the three stock market performance metrics and four UGC metrics) through the system of equations. Third, it captures the dynamics of carryover effects over time through the Generalized Impulse Response Functions (GIRFs) which helps in and also assesses the relative contribution of the different metrics of UGC through the Generalized Forecast Error Variance Decomposition (GFEVD) (Pesaran and Shin 1998) – both of which are robust to the assumptions of causal ordering of the variables. Fourth, it helps control for trends, seasonality, non-stationarity, serial correlation, reverse causality (Luo 2009) and is robust to such deviations. Prior studies in marketing and finance have successfully used Vector Autoregressive models for similar purposes (e.g., Joshi and Hanssens 2010; Luo 2009; Pauwels et al 2004; Tetlock 2007). Thus, our system of equations in the VAR model assesses the dynamics of the relation between the UGC metrics and the stock performance metrics accounting for exogenous factors and is robust to deviations from the assumptions of stationarity, heteroskedasticity and serial
We carry out the analysis in the following steps: 1) Estimate the stationarity properties of various metrics of stock market performance and UGC using the unit root and cointegration tests. 2) Test for causal relationship among the variables through Granger Causality test. 3) Estimate dynamics of carryover effects through analysis of the impulse response functions. 4) Estimate the contribution of the metrics using variance decomposition. Finally, to check the generalizability of the results across
categories, in the Robustness section, we run a Panel VAR model.
Test for Stationarity, Unit Roots and Cointegration
We conduct stationarity and unit root tests to examine the stability of the statistical properties of the metrics of stock market performance and UGC. These unit root tests investigate if the variables entering the system evolve continually or are stationarity. Following the literature (Dekimpe and Hanssens 2004), we used both Augmented Dickey-Fuller (ADF) test for the evolution of variables and Kwiatkowski-Phillips-Schmidt-Shin (KPSS) test (Kwiatkowski et al 1992) so as to ensure that our results are robust to alternate formulations of the null hypothesis. If the variables are integrated in their levels, we run the Johansen’s procedure to test for cointegration (Johansen 1995) to examine if any linear combination of these variables exhibit lower order of integration. The results would indicate whether the variables share an equilibrium relationship over a long time, i.e. exhibit a permanent shift in the
equilibrium rather than reverting to their mean levels after a few time periods. Depending on the results of the stationarity tests and the cointegration tests, we choose the appropriate specification for the variables entering the VAR model. If the variables are stationary, we choose it in the levels; if the variables evolve, we use the first difference of the series in the model and if the series are cointegrated we have to adopt error correction models with an error term for adjustment. The metrics of stock market performance are stationary in the levels and the metrics of UGC are evolving but not cointegrated, hence we use the first differences of the UGC metrics. The details of implementation of these steps are discussed along with the results.
Test for Granger Causality
The details of the tests for Granger Causality are in Online Appendix C2.
Model Specification
We specify the relationship among the metrics of UGC and stock market performance through the following VAR model (with exogenous variables):
1 p t n t n t t n
Y
Y
X
e
4where ∈ , , , … . is the time period index, is the vector of the endogenous variables in the system, are the coefficients matrices of the lags of endogenous variables, is the vector of control variables and is its coefficients and is the error term. The optimal lag order (‘ ’) for the VAR model is chosen by the (Schwartz’s) Bayesian Information Criteria (BIC) (Lütkepohl 2005). We specify the variables in levels or first differences depending on the order of integration of the variables, which is determined through the unit root and co-integration tests. For example, the metrics of UGC and the trading volume enter the model in first differences as they are stationary in their first difference, but not in the levels and they also do not exhibit cointegration (discussed in detail in the results). Taking these factors into account, Equation (5) is specified as:
1 11 19 91 99 t t n t t n t t n t t n t t n t t n t t t n p n n AbRet AbRet IdioRisk IdioRisk TrdVol TrdVol Chtr Chtr Ratings Ratings NegChtr NegChtr PosChtr CompChtr CompNegChtr
1 2 11 , , , , , , , , 1 1 t n t n t n AbRet t IdioRisk t TrdVol t Chtr t Ratings t NegChtr t PosChtr t CompChtr p p pp Co p t PosChtr CompChtr CompNegChtre
e
e
e
e
e
x
x
e
e
x
e
, mpNegChtr t
(5)where is the abnormal returns, the idiosyncratic risk, the trading volume (daily turnover). These three are the measures of stock performance. The UGC metrics in the model are the the UGC Chatter, the UGC ratings, the negative chatter, the positive chatter, the competitor chatter and the negative chatter of the competitor. The off-diagonal terms of the matrix - (k and l being the rows and columns of the matrix) estimate the indirect or the cross carryover effects among the endogenous variables and the diagonal elements ( ) estimate the direct effect. The vector X comprises the (p ) control variables - analysts’ forecasts, advertising, media citations, new product announcements and the seasonal dummies (month of the year for November, December, and January, holidays such as Labor Day, Memorial Day). Each of the Equations in the system explains the influence of UGC after controlling for the above control variables.
We estimate the model using Generalized Method of Moments (GMM) (Hansen 1982), which does not make distributional assumptions on the data and controls for heteroskedasticity and temporal autocorrelation in measures of stock performance and UGC. Campbell, Lo, and MacKinklay (1997, pp. 173-175) suggest that estimating models explaining the returns using firm (or marketing) characteristics by GMM are consistent and unbiased (pp. 173-175). Further, they suggest using Heteroskedasticity consistent standard errors to overcome any temporal heteroskedasticity. To this end, we use the Heteroskedasticity and Autocorrelation Consistent covariance estimator 4 (also referred as the Newey-West standard error, Newey and Newey-West 1987) calculated for up to five lags. More details of the estimation procedure and its econometrics properties can be found in Hayashi 2000 Chapter 6 and Hamilton 1994 Chapter 14 (p 409-416).
Modeling Dynamics and the Relative Contribution of Metrics
We model the dynamics in the system with the help of the Generalized Impulse Response Function (Pesaran and Shin 1998) based on the above VAR estimation. We use the Generalized Impulse
Response Function for these as it is not sensitive to the causal ordering of the variable entering the system. We compute the confidence intervals of the impulse response functions using Monte-Carlo simulations. We further assess the relative impact of the metrics of UGC on the stock performance using the Generalized Forecast Error Variance decomposition techniques (Koop et al 1996; Pesaran and Shin 1998).
Results
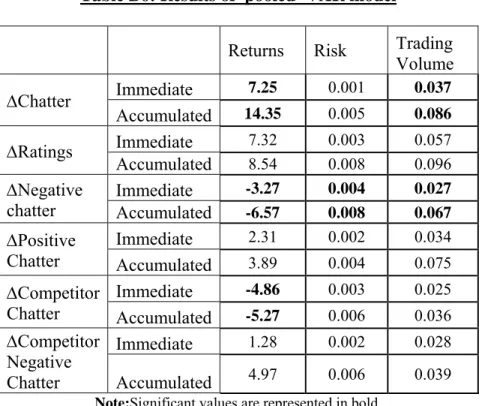
Table 2 shows the distribution of positive and negative metrics of UGC across the various
markets for the sampled time. Note that positive comments dominate the reviews across markets. Figure 1 depicts the trend of metrics of UGC over time aggregated to the weekly level. Note how all metrics show an upward trend as UGC becomes a more popular medium in the population. Figure 2 shows the time series plots of chatter and stock prices (adjusted for corporate actions such as splits and bonuses). The sampled time covers a period when the overall stock market went up substantially and fell steeply. Moreover, each stock shows a varying and deferring pattern in upward and downward movement. Thus, there is substantial variation in the raw data. The figure shows a moderate relationship between stock prices and chatter for all firms. The subsequent sub-sections examine this relationship systematically using the models outlined above.
We first present the tests for stationarity, unit root, cointegration, and Granger causality. We next estimate the model and derive the impulse response functions to examine the short and accumulated (long term) relationship between UGC and stock performance and the duration of the impact. We next estimate the relative importance of the metrics of UGC by Generalized Forecast Error Variance Decomposition. Finally, we describe a portfolio analysis and various tests for robustness.
Tests for Stationarity & Unit Root and Cointegration
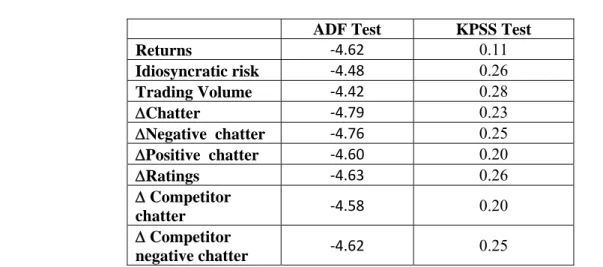
We use the Augmented Dickey-Fuller (ADF) test to determine if the variables are evolving or stationary. We also examine the variables with the Kwiatkowski-Phillips-Schmidt-Shin (KPSS) test
root. For the returns, the presence of a unit root in ADF test is safely rejected (Table 3), suggesting that the returns are stable and stationary in the given time period. Alternately, the KPSS test also confirms the absence of unit root for stock returns as the null hypothesis for this test cannot be rejected at 95%
confidence level (here, the null hypothesis assumes stationarity or absence of unit root). We run these tests on the various metrics of UGC with and without the trend to account for growth of the online media during the time period under consideration. The results of the ADF tests on the levels of various metrics of UGC have values ranging from -0.25 to -3.26 (much less than the range of critical values at 0.05 level of significance), suggesting that the metrics of UGC evolve in levels. We then ran the cointegration tests (Johansen 1988; Johansen and Juselius 1990) to see if combination of the UGC metrics and stock
performance variables (returns, trading volume or risk) show cointegration over the given time period (the details of the cointegration tests are in online appendix C1). Since no cointegration is observed among the variables, we take the first differences of the metrics of UGC and run the ADF and the KPSS tests to assess their suitability as possible endogenous variables in the VAR model5. The first differences of the metrics of UGC are stationary as shown in Table 3.
Granger Causality Tests
We test for the presence and direction of a causal relationship between each metric of UGC and returns or risk by conducting the Granger causality tests. In the first set of tests, we assume the null hypothesis that the metric of UGC (e.g., chatter) does not Granger cause returns. We use five6 lags considering the Akaike Information Criterion and the Schwarz Bayesian Information Criterion. Table 4 shows the median p-values of the Wald Test (chi-square) statistic for Granger Causality. The results suggest that some metrics of UGC significantly Granger cause returns while others do not. Chatter shows a strong impact on returns (median p=0.04, ranging from 0.02 to 0.07 across firms) followed by negative chatter (median p =0.05 ranging from 0.03 to 0.07) and then positive chatter. The average ratings do not
5
Granger cause stock market performance. The reverse feedback (causality) from returns to metrics of UGC is not significant (median p value ranging being 0.23, ranging from 0.13 to 0.49). The instantaneous causality also emerges to be insignificant across the metrics (median p value of 0.29). These results confirm the temporal causal relationship between the metrics of UGC and stock returns.
We do similar tests for risk and trading volume. The details of the result are in Table 4. The results suggests that negative chatter Granger causes risk (median p=0.05, range, 0.02 to 0.08). Other metrics, (chatter, positive chatter or average ratings) do not exhibit statistical significance. The reverse feedback from risk to any of the metrics of UGC is not significant (median p= 0.28). We do not find any significant change in the results of returns or risk due to the inclusion of higher order lags.
Short and Long Term Relationship Between UGC and Stock Performance
We estimate the VAR-model with the returns, risk, trading volume, and the metrics of UGC (chatter and negative chatter) as the endogenous variables. We test the residuals of the models for some of the assumptions of the VAR model using standard diagnostic tests7. The optimal lag length for the VAR models is three as determined by the Schwartz’s Bayesian Information Criterion.We show the short term and long term dynamics between the metrics of UGC, returns, and risk using the estimated VAR model through simulations of the Generalized Impulse Response Function (Pesaran and Shin 1998; Dekimpe and Hanssens 1999). The Generalized Impulse Response function uses the VAR estimates to trace the effect of a unit shock (one standard deviation) in any one of the variables (a measure of UGC) on all other variables (returns, risk or trading volume) in the system over subsequent periods. We define the short term impact as the effect derived from estimates of the VAR model for the first three time periods, the average time taken for the effect of UGC metrics to reach their peak effect. We define the long term or cumulative impact as the accumulated impact of the impulse response function (of the metrics on UGC on metric of stock performance) to reach its asymptote. Most of the
7 We test the assumption of autocorrelation using the Durbin-Watson and Lagrange multiplier tests; we test the assumption of multivariate normality using the Jarque-Bera test. Since we do not get significant positive results in
accumulated effect on stock returns reaches the long run (asymptotic) levels within 10 time periods. Hence, in effect, we take the long term (accumulated) duration as a period of 15 days, ensuring that we have captured the total effect of UGC metrics on stock performance. To avoid ambiguities in the representation of the effect of returns, we follow the convention in the finance and accounting literatures and express the short and cumulative impact on stock returns in basis points (one basis point is one hundredth of a percentage).
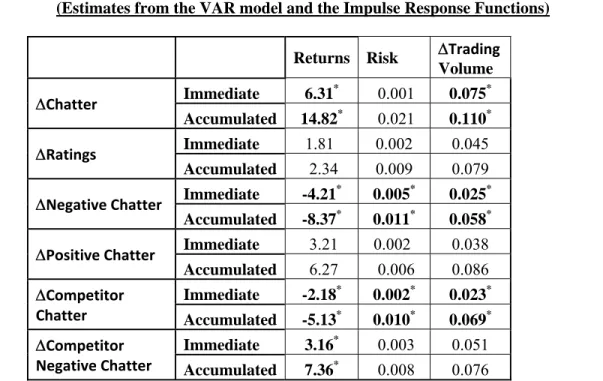
Table 5a presents the results, averaged across the firms, of the short term and accumulated impact of the metrics of UGC on returns and risk8. Among the various metrics, chatter shows a high positive impact on returns in the short term (6.3 basis points p < 0.01) and similar accumulated impact of 14.8 basis points (p< 0.01). Chatter also has a significant positive influence on the trading volume with the short term and an accumulated impact of 0.08 percent and 0.10 percent of daily turnover respectively (p< 0.01). While chatter has a significant impact on returns, it has no significant impact on firm’s risk.
Positive chatter does not have a significant impact on returns, risk, or trading volume. Negative chatter on the other hand, influences returns negatively both in the short term (-4.2 basis points, p< 0.05) and in the long term (-8.4 basis points, p < 0.05). This figure is comparable with that in the study of Tellis and Johnson (2007). In contrast to the effect on stock returns, negative chatter increases the risk and trading volume of the firm. These results are over and above the effects of advertising, which is separately accounted for in our model. This result shows that the word of mouth effects are significantly larger than advertising.
Though these effects seem to be small in basis points, yet they have a substantial impact in terms of the dollar value. In monetary terms, the negative relationship between chatter and returns could
translate into a substantial impact on the market capitalization of the firms. Other factors remaining equal, a unit shock to negative UGC could erode about $1.4 million from the average market capitalization in the short term and an accumulated value of $3.3 million over the fifteen days following the chatter.
Surprisingly, the influence of the ratings assigned by consumers to the products does not seem to have any significant effect on returns or trading volume. We also test the model by separating the ratings as positive (greater than three) and negative (less than three). The inclusion of the positive and negative ratings in the Granger causality test or the VAR model does not change the results. This result suggests that textual content of the reviews has more information content than a summary measure of rating.
Effects of Competitor UGC
Similar to the effect of own UGC on the returns, we also assess the effect of the competitor UGC on a firm’s UGC metrics, and financial metrics (returns, risk and trading volume). Increase in competitor negative chatter UGC increases the overall chatter of the firm. A percentage increase in competitive chatter increases the overall chatter of the target firm by seven percent on an average (range 2%-13%). The last two rows of Table 5a show that an increase in competitor chatter has an adverse effect on the returns of the target firm. An increase in competitive chatter decreases the returns of a target firm by 2.2 basis points in the short term and by 5.1 basis points cumulatively (both significant at 0.01 levels). Competitor chatter also have an influence on the risk of the target firm (0.2 percent change in stock price in the short term and 1.0 percent cumulatively, p<0.01). Similar result holds for the effect of competitor chatter on the target firm’s trading volume. On the other hand, an increase in competitor’s negative chatter has a positive influence on the firm’s returns. The firm stands to gain 3.2 basis points from changes in competitor’s negative chatter with an accumulated gain of 7.4 basis points. But the negative chatter of competitors does not seem to influence the risk or the trading volume.
Duration of Impact
Figures 3 illustrate the results of the impulse response function for the Hewlett Packard in the personal computer market. The first panel on Figure 3 shows that a one unit shock in chatter has an increasing impact on returns, reaching a peak (wearin) in the second day. Returns then wear out over the next few days to long term equilibrium resulting in an accumulated value of around 14.8 basis points. The
and third panel of Figure 3 depicts the impact of a unit shock of negative chatter on stock returns and volatility respectively. Negative chatter has a negative impact on returns immediately with an
accumulated loss of 8.4 basis points over the next few days; while the negative chatter increases the risk associated with the stock which peaks in about 4 days. The negative metrics of UGC show a strong immediate impact on returns on the subsequent day and decay to the equilibrium levels over the next four days. Table 6 summarizes duration of these effects.
Relative Importance of Metrics of UGC
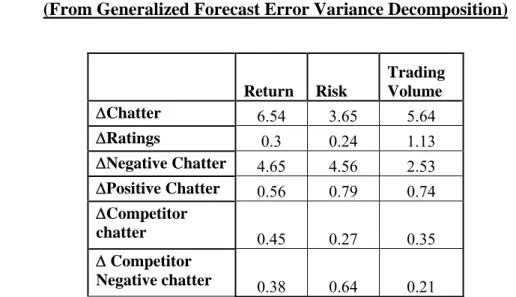
We use the generalized forecast error variance decomposition (Pesaran and Shin 1998) of returns and risk to assess the relative importance of the various metrics of UGC. The decomposition ascertains the extent to which change in various metrics of UGC contributes to the deviation of returns, risk, and trading volume from baseline expectations. We use the different metrics of UGC (ratings, chatter, negative chatter of those of the firms and the chatter and negative chatter of the competitors)
endogenously with the stock performance variables in the VAR specification described in Equation 4. Table 7 shows the relative importance of these metrics in determining the stock returns, risk, and trading volume. The results show chatter to be the most important metric that influences the stock
performance followed by negative chatter. While chatter explains 6.5% of variance of returns and 5.6% of the variance of trading volume; negative chatter explain 4.7% of variance of returns and 4.6% of variance of change in trading volume9. Competitor’s UGC explains 0.83% with competitor’s chatter contributing 0.45% and competitor’s negative chatter contributing 0.38% of variance). Similar results holds for the influence of chatter on risk, where negative chatter accounts for the largest variation (4.56%) in risk among all the UGC metrics. We could safely conclude that the firm’s risk increases due to the increase in negative information and uncertainty of future stock market performance.
Consistent with prior results, the effect of chatter persists for about six days (Figure 4). After an immediate influence on returns, the contribution of chatter and negative chatter to the variance of the
stock returns diminishes rapidly after four days. Similar results holds good for the influence of chatter on trading volume. Negative chatter shows a similar influence on returns over time though the percent of variance explained is not as much as that of chatter. But the influence of negative chatter on risk is strong and persists for about six days.
Impact of Control Variables
The impact of chatter on stock market performance holds after controlling for several exogenous variables: advertising, new product announcements, media citations, and analysts’ forecasts. We next describe the impact of these control variables.
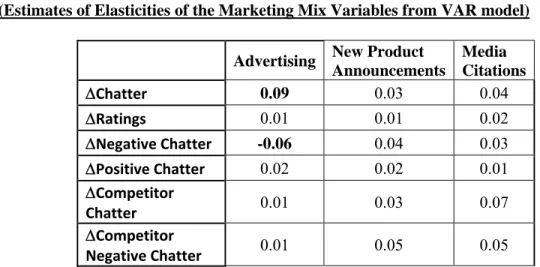
Advertising has a significant positive influence on chatter. A one percent increase in advertising expenditure increases chatter by 9.5% and decreases negative chatter by 18.9% (p = 0.05), averaged across the firms. This effect is significant at 0.05 levels in all the firms. These figures translate into an advertising elasticity of 0.09. These estimates of advertising elasticity are slightly lower than the average advertising elasticity of 0.12 in the literature (Sethuraman, Tellis and Briesch 2011). Though advertising has a strong influence on the chatter, it does not have a statistically significant effect on the positive chatter or ratings of the firms. The elasticity is higher for firms in market categories such as data storage products, footwear, and toys than for firms in other categories. This difference could occur because of the greater brand differentiation in the latter categories, especially footwear and toys. Advertising has a negative impact on the negative metrics. For every percent increase in advertising the negative chatter decreases by 6.4%.
New product announcements have a positive impact on chatter in certain product categories such as cell phones and computers. However, this relationship is not statistically significant for product categories such as toys and footwear. This result may be because online consumers are more responsive to digital products than to other products. The elasticities of all the metrics are shown in Table 5b.
Media citations and analyst forecasts do not influence any of the UGC metrics. The results of the effect of metrics of UGC on the stock performance holds good even after these factors are accounted in our model.
Analysis Over Time
We repeat the analysis over rolling windows of time to investigate if the phenomenon changes over time. We use a rolling window of two years starting from June 2005 till December 2009, repeatedly re-estimating Equation 4. Table B7 (Online Appendix B) summarizes the results for the three UGC metrics, which were significant in the prior analysis. We find that on an average, the magnitude of the effect seems to be decreasing to a small extent over time for all the metrics (both in short and long term). The size of the effect is much more pronounced for the accumulated response than for the short term response. The immediate response to chatter decreases over time from 6.85 basis points (in the period 2005-07) to 6.4 basis points, (in the period 2007-09). This amounts to an average decrease of 3.1% for the short term response and an accumulated decrease of 8.8% over time to the change in chatter. Similarly, we find that the immediate response to negative chatter averages a 2.5% decrease over the years and the accumulated response decreases by an average of 12.1%. These results may imply increasing market efficiency as investors increasingly become aware and process UGC. However, we must be cautious in interpretation as this analysis over time is done over a period of only three years. .
Robustness Tests
We carry out several tests to ascertain the robustness of the above results.
Analysis using Panel Time Series
Alternately, we also model the relation between the metrics of UGC and stock performance as a dynamic system of simultaneous equations using the Panel Vector Auto Regressive model (e.g. Horvath et al 2005; Pauwels and Srinivasan 2004) to account for possible heterogeneity among firms and find out
could be pooled (the overview of the test for pooling are Online Appendix C3 and the complete details are in Baltagi 2008 p. 57-63). After ensuring that the model can be pooled across firms, we specify the relationship among the metrics of UGC and stock market performance as:
, , , 1 p i t n i t n i t i n it t
Y
Y
X
e
6where ∈ 1,2, … . .,15} is the firm index, ∈ , , , … . is the time period index and accounts for firm specific effects. The rest of definitions of variables remain same as in Equation 4. We further assume that the errors are orthogonal to the lagged values of the endogenous variables as well as the control variables and that | , … . . , 0. As in the model in Equation 4, the variables enter the Panel VAR model in first differences due to the stationarity properties of the time series (details are in Online Appendix C2). It is to be noted that the time dimension is much larger than the number of cross section. Hence due to the large time series asymptotic properties, we could circumvent the estimation problems typical in analysis of dynamic panels (e.g., Holtz-Eakin, Newey, and Rosen 1988; Pesaran and Shin 1995). We estimate the model simultaneously in Equation 6 using Feasible Generalized Least Square (FGLS) with Newey-West standard error (Newey and West 1997), controlling for any temporal heteroskedasticity and autocorrelation in the errors. As in the un-pooled model, we estimate the Impulse Response Functions and derive the short and cumulative (long term) effects. We estimate the latter model up to five lags. The results of the pooled model are summarized in Table B6 (Online Appendix B). The results of the pooled model are consistent with the original results. This confirms that our original
findings are robust to market or firm specific heterogeneity and are not sensitive to the specification of the model in Equation 4.
Alternative Metrics of UGC
We use alternate measures of measuring the valence of the reviews to check the sensitivity of the model to the measurement of valence using the text classification algorithms. Instead of the classifying the review as positive or negative (which was done earlier based on the Naïve Bayes and Support Vector
Machine algorithms), we now count the total number of positive or negative words and phrases across all the reviews of a given brand in a given day, which we label positive expressions or negative expressions respectively. We use a dictionary based frequency count of positive and negative terms for a given product. The effect of positive expressions is not statistically significant while the negative expressions have a significant effect on the stock performance metrics (details in online appendix table B3 and B4). These results are consistent with the earlier analysis of the valence analyzed using the text classification method and hence we could safely conclude that the results are not sensitive to alternate measures of the valence.
Portfolio Analysis
We carry out a portfolio analysis to check the robustness of the VAR analysis and ascertain investment opportunities in the results. Specifically, we try to address the following question: Do the asymmetric returns between negative and positive chatter hold when we try to use these metrics for investments? We use the calendar portfolio method (Jaffe 1974; Mandelker 1974) to answer this question. Calendar portfolio estimates the risk adjusted returns across all the firms experiencing a similar event. In this approach, we form positive or negative portfolios by including all the firms experiencing positive or negative chatter respectively, in a given day and track the returns to these portfolios. Specifically, we include a firm in the positive (or negative) portfolio if the volume of positive (or negative) chatter for the firm in a given day is greater than 50% of the overall chatter. The composition of each of the portfolios changes daily as firms are added or deleted depending on the valence of the chatter in a given day. We estimate the returns on the portfolio using the Fama French 3 Factor model with Carhart momentum.
i,t f,t i i,MKT MKT,t f,t i,SMB t i,HML t i,MOM t i,t 2 R -R = + (R -R )+ SMB + HML + MOM +e ~N(0, ) e
7The estimates of alpha in Equation 7 give us the returns of the portfolio over and above that predicted by the four factors included in the model. The results (in Table 8) corroborate the asymmetry of
returns of the negative portfolio emerge negative and are statistically significant. This result contrasts with that for the positive portfolio, which has an alpha that is not statistically significant. The overall gains using this strategy, with an initial investment of a hundred million dollars, yields an average annual profit of $7.9 million over the four years in our sample,.
Discussion
UGC has been rapidly growing in the last few years. This study sought to ascertain if UGC is related to stock market returns, if so, which metric of UGC is the most important, and what are the dynamics of this relationship. This section summarizes the main findings from the study, lists the contributions, discusses key issues, draws implications, and lists limitations.
Summary
The main findings of this study are the following:
UGC and returns exhibit a significant positive correlation. Granger causality tests suggest that UGC predicts returns and trading volume. The impact of chatter on UGC prevails even after controlling for analysts’ forecasts, media citations, advertising, and new product announcements.
Of all metrics of UGC, chatter has the strongest relationship with returns in the short term and long term (cumulatively). Numerical ratings do not have any significant impact on returns.
Positive and negative metrics of UGC have an asymmetric impact on returns. Negative metrics have a stronger influence on returns than do positive metrics. In absolute terms, the erosion of value by negative UGC is greater than the accrual of value due to positive UGC. Whereas negative UGC has a strong effect with a short wearin and long wearout, positive UGC has a non-significant effect on returns.
Offline television advertising increases the volume of chatter while decreasing negative chatter Idiosyncratic risk increases significantly with negative information in UGC. Idiosyncratic risk is not
Granger causality tests suggest that neither returns nor risk have any significant effect on any of the metrics of UGC over time.
Contributions
This study makes several contributions. Firstly, it is the first study to show that UGC is related to the stock market performance of the firm. Second, it is the first study to show which of four metrics- chatter, ratings, positive or negative valence - are important. Third, this study makes a methodological contribution by demonstrating techniques to aggregate and derive these dimensions from UGC. Fourth, it is the first study to examine the dynamics of the relationship between the various metrics of UGC and stock market performance (returns, risk and trading volume) using VAR. Fifth, though studies suggest the adverse impact of negative word–of-mouth on returns (e.g., Luo 2009), no study has shown conclusively a comparison between positive and negative metrics.
Issues
The results raise the following three issues. Why does UGC predict returns? What do the dynamics of the relationship mean? Why is the effect asymmetric?
Why Does UGC Predict Returns?
Due to the lack of perfect information, investors depend on site visits, reports from industry analysts, company press releases, experts’ reviews in media, and regular sales and earnings
announcements. The first four of these are sporadic and infrequent while the latter two are at monthly or quarterly intervals. Thus, UGC represents new information, otherwise unavailable to investors, who may rely on this information. So, UGC may predict returns.
What Do the Dynamics Mean?
We find that UGC leads stock returns by a few days. This leading effect could be attributed to a variety of economic and behavioral reasons. Firstly, the extraction of information from UGC requires sophisticated methods as demonstrated in this paper. Traders may not yet have easy recourse to these
methods. Secondly, the gains from same day trades may currently fall below the costs of process the UGC immediately. Thirdly, diffusion about knowledge on firms is known to be relatively slow, more so when it occurs to through the distributed data bases of consumer reviews in disparate websites (e.g. Lo and MacKinlay 1990).
Why Is the Effect Asymmetric?
We find that negative metrics are more strongly related to UGC than positive metrics. This could occur for three reasons. First, negative information is less than positive information (typically 1 to 4). So, investors may find the negative information may useful. Also, they may want to know the worst about the brand rather than the best. Second, investors may be loss averse. That is, the damage from negative weighs more heavily than the gain from positives. Third, positive information may be well known to investors from advertising and press releases. For these reasons, negative metrics may have a stronger impact on returns than positive metrics.
Implications
This study has three implications for investing, strategy, and policy.
First, because UGC predicts returns, it contains valuable information about a firm’s performance over and above that contained in standard sources of information. Thus, marketing managers should monitor UGC as a part of their marketing research.
Second, our results suggest that marketing managers should focus on negative chatter more than positive chatter or average ratings. Textual analysis of negative chatter could signal potential problems or discontent among consumers that deserve serious immediate attention. Taking corrective action could avert any long-term damage to shareholder value. Our simulation indicates that unmitigated negative chatter can lead to an overall loss in brand value of $3.3 million over the two weeks. .
Third, because offline television advertising increases the volume of chatter while decreasing negative chatter, firms can use it to favorably influence chatter. Such a use would require managing the content of advertising to appropriate influence the issues raised in negative chatter.
Fourth, this study highlights the importance of informational content of UGC to investors and other stakeholders. Portfolio analysis indicates that buying and selling stocks based on the valence of chatter can lead to an average gain of $27 million over one year even for only 6 markets and 15 brands.
Limitations and Future Research
This study suffers from several limitations that could be the focus of future research. Firstly, some of the steps in analyzing UGC are time consuming and computationally intensive. For
implementation in managerial settings, practitioners would have to scale up and implement efficient computational procedures, especially in real time monitoring of UGC. Second, to keep the research manageable, we had to restrict our sample to 1112 days and five metrics over the fifteen firms in six markets. It would be worthwhile to assess the generalizability of the results. We restrict our study to only two forms of UGC – product reviews and product ratings. We do this because of the high signal to noise ratio in ratings and reviews relative to these other sources of UGC. Assessing the impact of UGC on stock market performance at a daily level could have its limitations, such as non-synchronous trading (Lo and MacKinlay 1990). That could help in assessing the impact on a finer level (e.g. at hourly level or even higher frequency). Third, we are unable to get sales data at the daily level. It would be insightful to get such data and analyze the direct path through which UGC affects stock market performance of firms.
F
Figure 2: T
Figure 1: Ti
Time Series P
me Series P
Plot of Cha
(Jan 20Plot of Selec
tter and Sto
005 to Dec 20
cted Metrics
ock Prices o
009)s of UGC
of Selected M
Markets
Basis Points The vertic idiosyncrat (light) on e
(F
The figure contributio variance isChat
Figure 3: A
cal axis shows tic risk. In all t either side of th
Figu
From the Ac
e depicts the ons from all th s by the past ret
Percent Change Time
tter (Volum
Accumulate
the is the retur the panels the h he response fun
ure 4: Expla
ccumulated
normalized p he variables at turns, risk and
Negative
(V
me) on Retur
ed Impulse R
rns (in basis po horizontal axis nction (bold).ained Varian
d Generalize
percentage con t each time po trading volum Basis Pointse Chatter on
Volatility)
rns
Response Fu
ints) in panel 1 depicts the timnce of Retu
ed Forecast
ntributions by oint sums to hu me, (not shown
Negative C
n Risk
unctions of
1 and 2. In pan me in days. Theurns by Metr
Error Vari
y metrics of U undred percen here to retain t TimeChatter on R
Key UGC M
nel 3, the vertic e graph shows
rics of UGC
iance Decom
UGC for each nt, Rest of the
the readability
Returns
Metrics
cal axis is the the confidence