Physics Procedia 24 (2012) 1192 – 1198
1875-3892 © 2011 Published by Elsevier B.V. Selection and/or peer-review under responsibility of ICAPIE Organization Committee. doi:10.1016/j.phpro.2012.02.178
Physics
Procedia
Physics Procedia 00 (2011) 000–000www.elsevier.com/locate/procedia
2012 International Conference on Applied Physics and Industrial Engineering
An Emperical Analysis of the Corperate Ownership
Concentration on the Operation Performance after IPOs of
Chinese listed SMEs
Li Jiming, Sun Xing
Business School Zhejiang University City College Hangzhou, China
Abstract
The purpose of this paper is to investigates whether the large shareholders of small and medium firms (SMEs) take advantage of the inside information and decrease their shares before their operation performance begins to decline after the Initial Public Offerings (IPOs). By using the data from annual reports of SMEs listed on Shenzhen Stock Exchange in China from 2004 to 2006, this study explores both the relationship and the interaction effects between the change of operation performance and the ownership concentration of SMEs around their IPOs. The statistic analysis indicates that there is a significantly positive relationship between the ownership concentration and their operation performance after IPOs during the sample period. Moreover, the companies with higher ownership decreasing encounter more severe operation performance decline, which sugests that the listed companies intend to package their book profits before IPOs for the sake of increasing their issuing prices and enlarge their financing scales.
© 2011 Published by Elsevier Ltd. Selection and/or peer-review under responsibility of [name organizer]
Keywords: small and medium firms, ownership concentration, operation performance
1. Introduction
The declining of operation performance, during the initial period after IPO, is mainly affected by two factors. On one hand, financial packaging is used to improve performance. On the other hand, Ownership and management are separated gradually. The ill corporate governance structure is the main systematic cause of the situation, while ownership structure is the property basis of corporate governance structure. Moreover it is reflected by ownership concentration which is its determinant and come to affect operation performance.
© 2011 Published by Elsevier B.V. Selection and/or peer-review under responsibility of ICAPIE Organization Committee.Open access under CC BY-NC-ND license.
The capital market provides a direct financing platform for the firms. However, there is a problem that how they make best use of this platform in the markets in value maximization centric to build suitable capital structure, which is worthy of discussion and study. Hence the study on the effect of ownership concentration (i.e. the large top 5 shareholders) on operation performance (i.e. the return on quity), which is in case of making suitable program for the development of ownership concentration and improve operation performance, is profound significant.
Therefore this paper studies the fluctuating rates of the ownership concentration and focus on the initial stage, which is designed to understand the change and investigate the relationship between ownership concentration and performance decline ration.
2. Literature Review
Numerous studies have examined the relationship between the ownership concentration and performance. There are mainly three viewpoints of it. The survival of large shareholders has a positive effect on the corporation, which is agreed by Shleifer and Vishny(1986)who found that ownership
intensity can improve performance through reducing the free-rider problems and racing up to top. The investigation of Wruck(1989)which reported a significant positive influence of non-monotonic
RM ,followed by the increase of ownership intensity. Similar evidence have been obtained by Agrawal and Mandelker(1990) who supported the Shleifer and Vishny(1986)’s research hypothesis, who
agreed that the survival of big shareholders contributes to better regulation and performance, especially the ownership is concentrated in institutional investors.
On another hand, Grossman and Hart (1988) argued that because of private benefit of control which led to the problems between controlling shareholders and minority shareholder while they analyzed the disproportionate benefit the shareholders held. In that context, Burkart, Gromb, and Panunzi(1997)
showed that inhibition of management motive is caused by overregulation, which will increase the implicit cost led by ownership concentration. The empirical studies conducted using Chinese data have yielded the same results. For example, Shi (2000) investigated 484 companies listed on the Shanghai Stock Exchange (SHSE) in 1999 and found that there is a there, rather than a nonlinear relationship between ROE and ownership concentration , and the negative association holds for all groups.
However, there is a nonlinear relationship between ownership concentration and performance in America and Germany highlighted by Gedajlovic and Shapiro (1998) considering the effect of supervisions and embezzlements. In a seminal article, Morck(1988) examined the relationship between insider ownership, represented by the share ownership of board members, and firm performance, represented by Tobin’s Q. They found a significant non-monotonic relationship; Tobin’s Q increases when the insider ownership is below 5% or above 25%, but declines in between these two levels. The influence of both block ownership and insider ownership on firm performance was also subject to the investigation of McConnell (1990) which reported a significant positive influence of insider ownership. Further contributions to this debate have been made by Gao and Yu (2001) who demonstrated found indication of a convex relationship, i.e.U-shaped, between big shareholders and Tobin’s Q.
3. Hypotheses
According to the previous literature of earnings management during IPO, the firm performance will decline if any financial packaging is used. Under that environment, controlling shareholders will know the vetting procedures of listing or benefits brought by IPO and sell their holdings when they apply for quotation. Therefore,
If owning competitiveness and developmental potential, with a view of sustainable management, listed company of which reduction rate will be lower than the poor growth ones. Will the firm with low declining rate of ownership concentration have lower declining rate of performance? Hence this paper focuses on examining the ROC of ownership concentration, operation performance. The listed companies are divided in two groups-the low and the high by the median. So
Hypothesis 2: companies with decreasing ownership concentration encounter more severe performance decline.
4. Methodolege
4.1 Data
The financial data for small-and-medium-sized companies are taken from the Shenzhen Stock Exchange (SZSE) over the January 2004 to December 2006 sample period. There are 102 firms in total during this period. 21firms which are lacking of complete financial data (e.g. 002051) is eliminated. Based on above criteria, this paper extracts 81 SZSE listed firms for our analyses.
It reveals that the properties of the stock are numerous after the initial inspection of the number of shares. According to listed censorship, the capital of the firm should be over RMB 3million. And that the shareholders whose rate of share held is over 3% in SME are rare, except the large of top 1. While the large shareholders (i.e. top 5) have a big influence on the firm, the variables we collect is based on them in the light of One-Share-One Vote Rule in our countries.
As far as operating performance be concerned, investor will be tempted by Return on Equity (ROE) which can be the measures of profits.
4.2 Measurement
ROE: net profit/ Owners equity
Fluctuating rate of ownership concentration: (LSRSH n+1 –LSRSH n )/ LSRSH n.
Fluctuating rate of ownership concentration: (LSRSH n+1 –LSRSH n) / LSRSH n Return on Net Assets(RONA):(RONA n+1 –RONA n)/ RONA n。
The degree of Ownership concentration:Rate of the large shareholders
LSRSH: Rate of the large shareholders LS: the top 5 shareholders
LSRSH: Rate of the large shareholders 5. Results
5.1 The change of Ownership Concentration after IPO
As show in Table I below, the mean value of large shareholders of top 5 creep down from 59.4191% to 56.841% during sample periods gradually. Based on these information sources we get, the FIRSTS among large shareholders booms first and then followed by a ebbing. Moreover the minimum of the sample subsides with a range of 6.57%, bottoming out at 28.20%. It can be revealed that there is a dispersion tendency in ownership concentration.
Based on these information sources, the following variable was determined for each year end of the investigation period.
Table I. The fluctuation of shares of top five shareholrers
Frequency Min Max Mean S.D. LS t=0 81 34.77% 79.72% 59.4191% 10.30067
LS t=1 81 30.04% 77.73% 58.3570% 10.67368
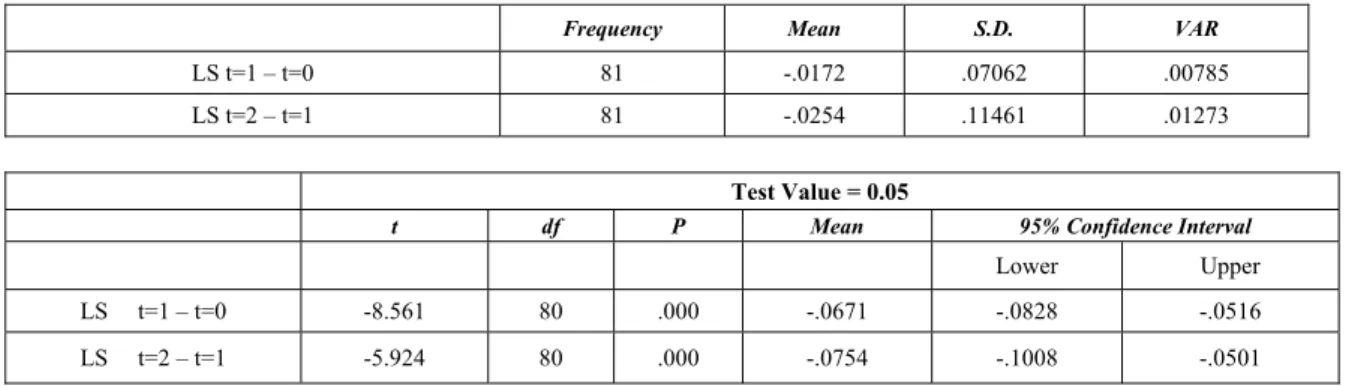
LS t=2 81 28.20% 89.23% 56.8410% 11.84950 In order to analyze whether there is an obvious declining of the large shareholding, T-text of 81 firms’ data is used, which can be shown in Table II below.
Table II DESCRIPTIVE STATISTICS of top five shareholrers
Frequency Mean S.D. VAR
LS t=1 – t=0 81 -.0172 .07062 .00785
LS t=2 – t=1 81 -.0254 .11461 .01273
Test Value = 0.05
t df P Mean 95% Confidence Interval
Lower Upper
LS t=1 – t=0 -8.561 80 .000 -.0671 -.0828 -.0516
LS t=2 – t=1 -5.924 80 .000 -.0754 -.1008 -.0501
It can be seen from the Table II that, the large shareholders will offload holdings after IPO, which will make the degree of t-value obviously. The mean value ranges from -0.0172 to -0.0254 during the first and second period in the slight of means and difference of means. And the gradual surging is observed, which caused by the offload holdings at a high figure of the large shareholders who want to get profits.
5.2 The change of Operation Performance after IPO
In the change of average, the firm performance increases gently during the initial stage after IPO followed by a subsiding. Considering the some firms listed at the end of the year among these samples, the increase of performance is lacking of objectivity, which will pull up it. There is no doubt that the appearance of the declining of performance appraise.
Table III. Descriptive Statistics Of Operation Performance
Frequency Min Max Mean S.D. ROE t=0 81 2.12% 21.81% 9.8747% 3.17421
ROE t=1 81 -7.86% 29.99% 10.3047% 5.50951
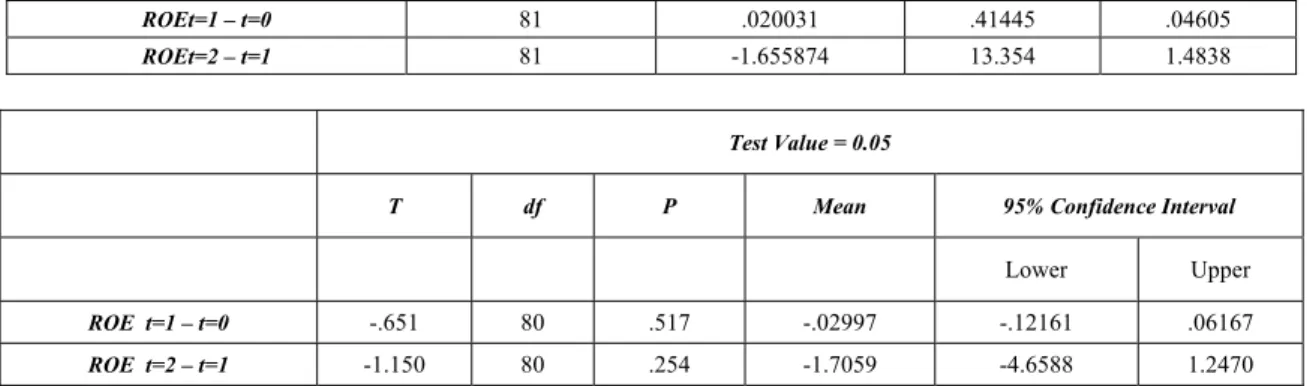
ROE t=2 81 -27.42% 31.36% 9.0760% 8.23666 Therefore it can be inferred that earnings management is used to package the finance report which will ensure the healthy financial performance while listing.
Table IV. T-Statistics Of Operation Prformance Per year
ROEt=1 – t=0 81 .020031 .41445 .04605
ROEt=2 – t=1 81 -1.655874 13.354 1.4838
Test Value = 0.05
T df P Mean 95% Confidence Interval
Lower Upper
ROE t=1 – t=0 -.651 80 .517 -.02997 -.12161 .06167
ROE t=2 – t=1 -1.150 80 .254 -1.7059 -4.6588 1.2470 It reveals that all the declining rates do not reach level of significance (α=o.1), since some shareholders who knows the firm performance quite well. Based on the information resource collected, most of the proportion the large hold is over 40% who can operate firm performance. If their annual reports represent firm performance, the average of operation performance reflected by the 81 listed firms is relatively stable.
5.3 The relationship between variance ratio of ownership concentration and firm performance
In order to find out whether in case that the large shareholders sell stocks and arbitrage with the advantages of relevant information. To begin with, the variance ratio of the top 5 large shareholders during the first and second year is worked out and ranked from the maximum to the minimum. The data is divided two groups by median, the higher ownership concentration decreasing ration and the lower. The study is to investigate whether there are obvious differences, namely the slumping of ownership concentration accompanied by the slumping of firm performance after comparing the data of both groups. In the first year, 8 firms of which ROE is 0, is eliminated. The study is based on the ROE of the rest 73 firms which are divided into two groups –the higher with frequency of 37 and the lower to test level of significance by the median -0.0186.The conclusion is shown by Table V and Table VI.
Table V Descriptive Statistics Of Owership Structure On Operation Performance
The higher The lower Frequency 37 36
Min -.79 -1.96
Max .73 .68
Mean .0444 -.0514
S.D. .36732 .45588 Table VI T-Statistics Of Owership Structure On Operation Performance
Frequency Mean S.D. VAR The higher 37 .0444 .36732 .06039
The lower 36 -.0514 .45588 .07598 Test Value = 0.1
T df P Mean 95% Confidence Interval
higher -.921 36 .363 -.05559 -.1781 .0669
lower -1.992 35 .054 -.15136 -.3056 .0029
Table V shows that the average of ROE changes is a positive value in the higher groups which reveals that it increases evenly while it is opposite in lower groups. Since the higher do not reach the level of significance, the two groups are incomparable in the first and second year during the first period.
In the second year, we eliminate the firms of which ROE is 0. The study is based on the ROE of the rest 79 firms which are divided into two groups –the higher with frequency of 40 and the lower to test level of significance by the median -0.02454. The conclusion is shown by Table VII and Table VIII. Table VII Descriptive Statistics Of Owership Structure On Operation Performance
The higher The lower Frequency 40 39
Min -120.22 -3.39
Max .64 1.34
Mean -3.1589 -.1931
S.D. 18.98737 .85701
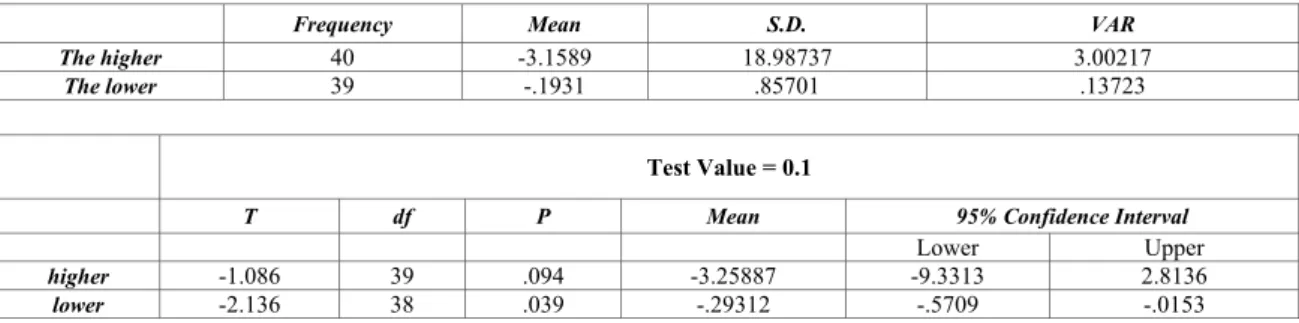
It can be seen from TableVII that the average of the higher is -3.1589 while -0.1931 in the lower. It comes to a conclusion that the subsiding in the larger will be followed by the subsiding of performance.
Table VIII shows that the two sample groups meet T-text, which means that the statistics are significant. Consequently, the second hypothesis that company with higher ownership concentration decreasing ration encountered more severe performance decline is confirmed.
Table VIII T-Statistics Of Owership Structure On Operation Performance
Frequency Mean S.D. VAR The higher 40 -3.1589 18.98737 3.00217
The lower 39 -.1931 .85701 .13723 Test Value = 0.1
T df P Mean 95% Confidence Interval
Lower Upper
higher -1.086 39 .094 -3.25887 -9.3313 2.8136
lower -2.136 38 .039 -.29312 -.5709 -.0153 6. Conclusion
Using a sample of SME during the sample period, the research analyzes the relationship between the change of ownership concentration and firm performance from 2004. It shows that in order to get the profits some shareholders offload holdings, which lead to the subsiding of ROE after IPO. Moreover the proportion of tradable shares, the ownership concentration and the structure of the ownership have big influence on performance. The following conclusions could be summed up from the analysis:
There is a significant decrease of ownership concentration and performance of which the rate becomes more obvious when close to sample periods. Moreover, the Company with higher ownership concentration decreasing ration encountered more severe performance decline, which means that the listed companies will package their book profits during the stage after IPO for the sake of increasing the
issuing price and financing scales. However this situation can not last long while the financial data is a peak value and can not be continued, which can be seen from the gradual declining of the performance.
The hypothesis made for the SMES board can not achieve the goal that expected for the reason that the innovation and perfection of system is not essential while the SME is during transition period. And also the measure of this study is a complex problem. There is not a single standard internal. And the data during the sample period which is replaced by the data next year can not be acquired because of the limited resource, which has an influence on the conclusion.
The fundamental outlet is to transform the organization and environment of developments. The findings suggest that these firms should build supporting system of policy-making information to enhance follow-up evaluation of their developments based on performance appraisal. Then it should build supporting system with early warning and forecast through the renewal and perfection of the evaluation theory and method. What is worth mentioning is that the firms should raise their financial efficiency, which will make them to the mainstay of new developments.
References
[1]A.,Shleifer, and R.Vishny, “Large Shareholders and Corporate Control”, Journal of Political Economy,volume94, pp.401-488, 1986.
[2]Jerold B. Warnera, Ross L. Wattsa, and Karen H. Wruck, “Stock Prices and Top Management Changes”, Journal of Financial Economics, Vol 20, pp. 461-492, 1988.
[3]Sanford J. Grossmana and Oliver D. Hartb, “One share-one Vote and the Market for Corporate Control”, Journal of Financial Economics, Vol20, pp.175-202, 1988.
[4]D. Leech, and J., Leahy, “Ownership Structure, Control Type Classfications and Performance of Large British Companies”, The Economic Journal, No.409,1418—1437,1991
[5]John J. McConnella and Henri Servaesb, “Additional evidence on equity ownership and corporate value” ,Journal of Financial Economics,Vol 27, pp.595-612, October 1990.
[6]John S. Earle, Csaba Kucsera, Álmos Telegdy, “Ownership Concentration and Corporate Performance on the Budapest Stock Exchange: Do Too Many Cooks Spoil the Goulash?”,Corporate Governance,Vol.13(2), pp.1-11, March 2005.
[7]H. Zhang, “Ownership Structure and Operating Performance: An Empirical and Theoretical Analysis”, Economic Science, pp.34-44, April 2000. (in China)
[8]J.H. Ma, and F.Q. Liu, “Research on Relationship of Capital Structure and Operational Performance of Small and Media Enterprises,” Quantitative & Technical Economics, October 2003. (in Chinese)
[9]C.J. Xiang, and M. Xie, “The Relationship of Corporation Governance Structure and Operating Performance:An Empirical Analysis”, Management World, May 2003. (in Chinese)
[10]Merhan, H., “Executive Compensation Structure, Ownership and Firm Performance”, Journal of Financial Economics, 38:pp. 63-184.