UNIVERSITY OF OKLAHOMA GRADUATE COLLEGE
RECORDING AND REPLAYING USER INTENTIONS IN COORDINATED MULTIPLE VIEW VISUALIZATIONS
A THESIS
SUBMITTED TO THE GRADUATE FACULTY in partial fulfillment of the requirements for the
Degree of
MASTER OF SCIENCE
By
SUDARSHAN REDDY VANGALA Norman, Oklahoma
RECORDING AND REPLAYING USER INTENTIONS IN COORDINATED MULTIPLE VIEW VISUALIZATIONS
A THESIS APPROVED FOR THE SCHOOL OF COMPUTER SCIENCE
BY
Dr. Chris Weaver, Chair
Dr. K. Thulasiraman
c
Copyright by SUDARSHAN REDDY VANGALA 2016 All Rights Reserved.
Acknowledgements
I owe my deepest gratitude to my thesis advisor Dr. Chris Weaver. I am fortunate to have an advisor who allowed me to explore the jungle of research on my own and at the same time guided me in the right direction. Chris inculcated in me a sense of research by teaching how to question ideas and thoughts from different perspectives. Thanks to the committee members, Dr. Krishnaiyan Thulasiraman and Dr. Christan Grant for their time, effort, and valuable suggestions.
I would like to express my gratitude to DLL project members, especially Dr. Samuel Huskey and Dr. June Abbas for their valuable suggestions and feedback throughout this research. I would also like to thank my fellow group members Vamshi Sunchu, Bharathi Ashokarajan, Jaychandran Ratnem, Emily Grimes, Silvia Shejuti, and Akshay for being helpful and supportive. Special thanks to Dr. Mahendran Veeramaneni for helping with Latex.
I also wish to express my gratitude to staff members Virginie Perez Woods, Jamie Hoots, Emily Pierce, Lindsay Rice, Ashley Hill, and James Cassidy for their support in various stages of my masters study.
It is a pleasure to thank my dear friends Omkar Gurram, Rajasekhar Kota, Alekhya Kammadanam, Keerthi Seetha, Sree Harsha Mandem, Rajiv Janupala, Vijaykanth Sreelam, Nayan Ravuluri, Richa Saraswat, Ankitha Sinha, Isha Bha-tia, Rohan G, Akash Krishnamurthy, Navesh Vijaykumar, Raghuram Vutukuru,
Jayaram Patibandla, and Anish Badri for the wonderful times we have shared. You guys gave me the necessary distractions from my research and made my grad school experience a memorable and joyous one.
Special thanks to my friends at Infy – Sartre Chagantipati, Jayaditya Bandi, Sandeep Vemulapati, Nitish Neelagiri, Lakshmi Goli, Shravani Chintha, and Nazia Shareef for your encouragement, support and most of all your humor.
To my dear friend Rashmi Nayak, thank you for being there to support me through hard times even though you had your own share of problems. Our conversations have always lightened painful events in my life and helped me focus on studies.
Most of all, I wish to express my gratefulness to my parents and brother for their unconditional love, support, patience, and many sacrifices. I would not be standing here today if it wasn’t for your support and encouragement. Also my sincere thanks to extended family members, especially my beloved cousins Madhusudhan Vangala and Venkat Kandukuri for their support to my family while I am away.
Contents
1 Introduction 1 2 Background 5 2.1 Information Visualization . . . 5 2.2 Visualization Parameters . . . 8 2.3 Operators . . . 92.4 Coordinated Multiple Views (CMV) . . . 11
3 User Intentions 14 3.1 Select . . . 16 3.2 Connect . . . 21 3.3 Encode . . . 23 3.4 Filter . . . 26 3.5 Abstract/Elaborate . . . 29 3.6 Reconfigure . . . 32 3.7 Explore . . . 34 4 System Implementation 36 4.1 Coordination Query Path . . . 37
4.2 Rule System . . . 39
4.2.1 Rule Implementation . . . 39
4.2.2 Rule Matching . . . 42
4.3 Intent Logging . . . 44
4.3.1 Logging State Changes . . . 45
4.3.2 Logging User Intentions . . . 46
4.4 Intent Browser . . . 50
5 System Analysis 56 5.1 Rules Analysis . . . 56
5.2 Coalescing Analysis . . . 58
5.3 User Interface Analysis . . . 59
List of Figures
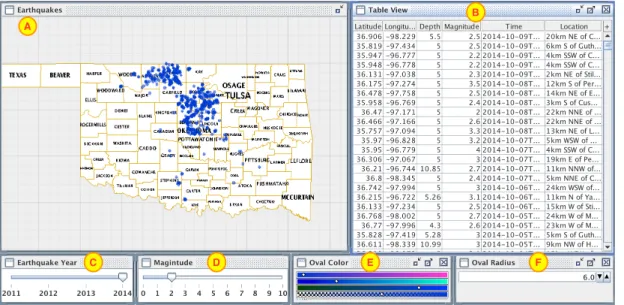
2.1 Example of an interactive visualization designed for exploring Earth-quakes that occurred in Oklahoma between 2011 and 2014. The earthquake view (A) is a scatterplot in which earthquakes are rep-resented as circles at locations identified by longitude and latitude attributes in the data set. A table view (B) lists the earthquakes in the data set used in the visualization. Views A and B display only the records which satisfies user-controlled filter critieria (Year =
2014 and Magnitude>= 2). C and D are slider controls which
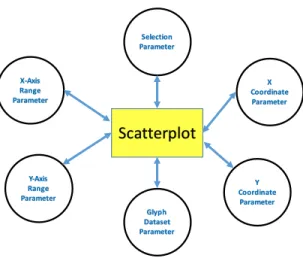
allow the user to modify the filter criteria. Color control E, and Value control F allow the user to pick the color and the radius of earthquake glyphs respectively, to suit their preferences. . . 7 2.2 Necessary parameters of scatterplot view: X-axis and Y-axis range
parameters are (min, max) range parameters to determine the cartesian region. X and Y coordinate parameters are real valued parameters for determining coordinate point inside a view. Selec-tion parameter to capture the data items that the user has selected in scatterplot view. Glyph dataset parameter contains glyphs of all records drawable in the view. . . 9 2.3 Coordination Graph for the visualization in figure 2.1. The dotted
red line region contains the interaction subgraph that is dependent upon Magnitude parameter . . . 12 2.4 Coordinated query paths resulting from user interaction in
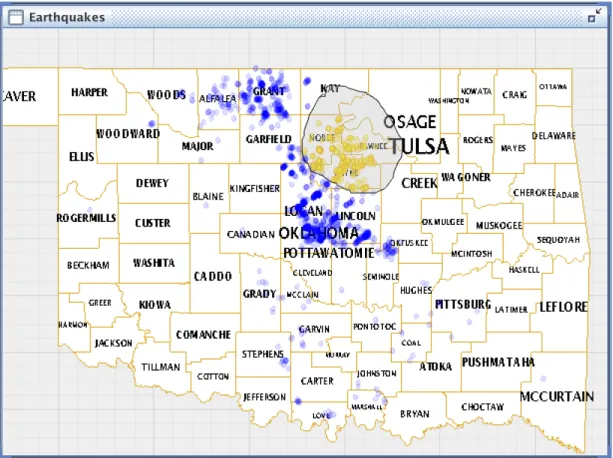
magni-tude slider . . . 13 3.1 Example of the Select interaction. All the earthquake glyphs
ly-ing within the lasso region are selected. Selected earthquakes are highlighted in yellow. Non-selected ones are represented in blue. . 17 3.2 Subgraph for common Select intentions . . . 18 3.3 Brushing Interaction: Selection is performed in top left scatterplot
of the visualization to highlight the records. Selected records are highlighted in blue in remaining scatterplots and table view. . . . 19
3.4 (A) Selection defined by mouse hover coordinates (x, y). (B) Se-lection defined by a movable rectangular region. Selected records
are highlighted in red color. . . 19
3.5 (A) Coordination subgraph of selection performed by dragging and stretching a persistent rectangular ”lens”. (B) Coordination sub-graph of selection performed by hovering over coordinate point (x, y). . . 20
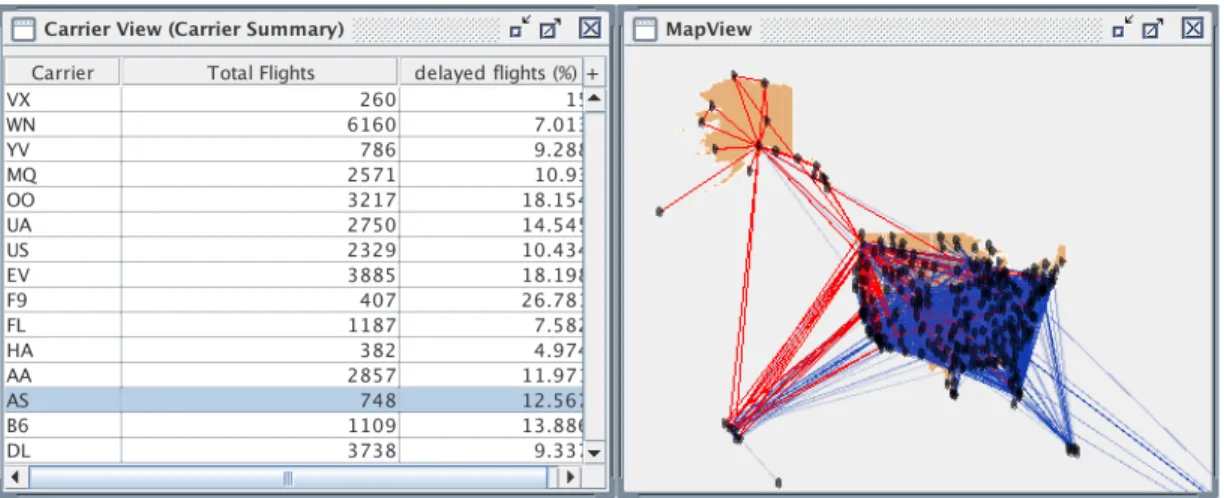
3.6 Example of a connect interaction between different Datasets/Entities. Map view highlights the flights that belong to the selected car-rier(s) in red color to reveal carrier-flight relationships. . . 21
3.7 Coordination query subgraph for the Connect interaction . . . 22
3.8 Coordination query subgraph for the Encode interaction . . . 24
3.9 Encode intention: Changing data attributes used to calculate size and color of the earthquake glyphs. . . 25
3.10 Coordination query subgraph for encode intention. . . 25
3.11 Coordination query subgraph for the Filter interaction . . . 26
3.12 Example for filter interaction using masking approach . . . 27
3.13 Coordination query graph for filter interaction using layer masking 27 3.14 Perceptual filter: Selected records are shown in bright colors. Non-selected records are shown in translucent colors. . . 28
3.15 Interaction subgraph for the Overview - Select - Filter - Details interaction . . . 30
3.16 Coordinate query subgraph for the Tooltip(Elaborate) interaction 31 3.17 Parameter change graph for the Semantic Zoom(Abstract/Elaborate) interaction . . . 32
3.18 Example for reconfigure intention. . . 33
3.19 Interaction subgraphs for reconfigure intention. A: Changing at-tributes used for ordering. B: Changing the order(Increasing or Decreasing). . . 34
3.20 Interaction subgraph for explore intention. . . 35 4.1 Used with permission from Chris Weaver [21]. Improvise
notifi-cation mechanism. 1: User interaction within a control modifies active properties of control. 2: Changed properties assign new value to variable. 3: Variable sends a value change notification to all properties connected to it. 4: Properties assigns variable value to itself. 5: Variable also sends value change notification to all lexicals that refer to the variable in their expressions. 6: Lexical sends change notification to variable it is assigned as value. 7, 8: View updates itself to reflect the change in value of live property. 38
4.2 Coordination query paths: Two coordination query paths are ob-served one for each target view when user interacts with the mag-nitude slider of the visualization shown in figure 2.3. . . 39 4.3 Rule construction for filter interaction. A: Parameter of any type
is allowed except selection parameter. B: Any node with data set operator types such as Lexical Filter, Lexical Sort, Lexical Projection etc. can be matched with this node. Node B and node succeeding it are also optional. C: Forward edges enforces the succession in types D: Back edge addresses the zero or more occurrences of the types in between the nodes connected by it. . . 41 4.4 Parameter change log. . . 46 4.5 Coalescing of Select interaction: User interaction updated Point
Selection parameter five times. 5 select intents are coalesced to a single Select intent . . . 48 4.6 . . . 49 4.7 User interface for browsing and replaying the user intentions.
’In-tent’ control lets user view only Intents of selected types. Selection in ’Target View’ control shows intents correspond to those views. Selection in ’Parameter’ control shows only intents detected when the selected parameters are modified. ’Source View’ allows the user to view intents performed by interacting with those views only. ’Intent Detail’ radio button allows user to query either pa-rameter intent log or view intent log. Buttons ’Play Intent’, ’Pause Intent’, and ’Play Back’ allow user to play, pause, and play back the intents respectively. . . 51 4.8 Intent Browser query data flow pipeline . . . 53 4.9 User interface for browsing and replaying the view level user
in-tentions. . . 54 4.10 Keyframe capturing mechanism . . . 55 5.1 Selecting Items by mouse hovering. (A) A select intention is
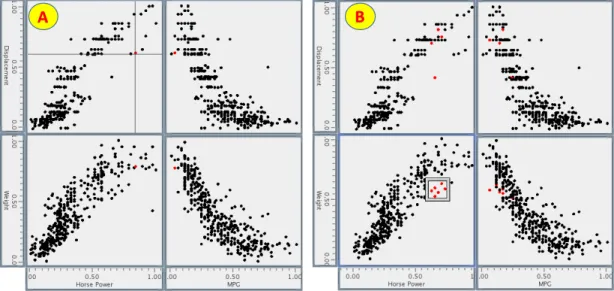
cor-rectly detected. (B) A select intention is incorcor-rectly detected, since none of the items are selected. . . 57 5.2 A: User Interaction to modify the range of Horse Power and Weight
parameters, filters the data shown in view(True Positive). B: Modifying parameters does not filter data, but rule system identi-fies Filter intention(False Positive). . . 58 5.3 Difference between view level and parameter level coalescing. At
the view level, the explore intentions of interleaved X(Detail) and Y(Detail) parameters are coalesced. At the parameter level, in-tentions are coalesced only if they are successive and involve the same parameter. . . 60
5.4 At the view level, selecting all values present in both the intent and the target view lists displays a summary of all intentions performed in all views. Parameter and source view list selections are ignored at the view level. . . 61 5.5 At the parameter level, selecting all values in all lists displays
fine-grain details of all user intentions. . . 61 5.6 By selecting ‘Select’ intention in the intent list and the ‘XY View
(Detail)’ view in the target view list, users can see all the selections performed in the selected target view. . . 62 5.7 At the parameter level, users can see fine-grain details of all
selec-tions performed only in ‘XY View (Detail)’. . . 62 5.8 Querying all ‘Explore’ intentions that were performed in ‘XY View
(Detail)’ by modifying the parameter ‘X (Detail)’ in any source view. 63 5.9 Querying all ‘Explore’ intentions that were performed in ‘XY View
(Detail)’ by modifying the parameter ‘X (Detail)’ in selected source views only. . . 63 5.10 Displaying all intentions that were performed in all views by
modi-fying the parameter ‘Trajectory Selection’ in ‘Trajectory List’ view only. . . 64
Abstract
Visualization tools help people gain insights into data. Analysts often want to revisit and review previously visited visualization states to make sense of their previous observations. Browsing a history of visualization interactions is often useful. Traditionally, history mechanisms are based on either undo-redo or re-play of low-level keyboard and mouse interactions. In this thesis, we examine the feasibility of translating low-level interactions into high level user intentions for the purpose of recording user actions at a semantic level. Yi, et al. [22] taxon-omize low-level interactions into seven higher level user intents: Select,
Con-nect, Encode, Filter, Explore, Reconfigure, and Abstract/Elaborate.
Our hypothesis is that a rule-based system can translate low-level mechanical interactions into user intentions under the Yi taxonomy.
Many visualizations are designed around the data state model [3], in which visualizations are composed of parameters, operators, datasets, and views. De-pendencies between these objects define acoordination query graph. When a user interacts with a visualization, these objects get modified in particular sequences to process, render, and display the information. Our core idea is to define rules that map the activity in sets of connected objects in a visualization coordination graph into corresponding user intentions. By dissecting existing visualization de-signs, we identified and characterized distinct mapping functions for each type of
intention. We then collected these functions in a set of rules for deducing user intentions.
Based on the identified mapping functions, we implemented a rule system as a new capability in the Improvise visualization environment [20], for discerning user intentions behind user interactions. User intentions detected by the rule system are recorded in an automatically generated data set to allow a user to revisit earlier visualization states. We designed a user interface to let the user query the intent data set and restore and replay past visualization states. Fi-nally, we assessed the utility of the system for performing queries and replaying visualization history at the level of intentions.
Chapter 1
Introduction
Visualization tools help analysts discern patterns present in data by providing visual representations of data. During the visual exploration process, an ana-lyst interacts with a visualization to pose new queries. During this exploration process, the analyst may often want to revisit and examine earlier visited visu-alization states. History tools can be helpful to focus on the exploration process without having to worry about remembering past results.
History tools are used in many applications. MosaicG [12] visualizes a his-tory of documents visited in a browser in a two dimensional graphical hishis-tory view. A graphical history view presents history in the form of a tree diagram. A node in the tree diagram represents page details such as title, URL address, and thumbnail image to aid the user in recognizing the documents. Users can revisit a document by double-clicking on the tree nodes. Heer, et al. [9] have investigated the design space of history mechanisms for the visualization systems and developed a branching undo-redo based history mechanism in Tableau. Vis-trails [2] proposed a provenance mechanism for capturing the parameter and data flow changes in a scientific visualization to allow an analyst to navigate through
different versions of data flows of an exploration task and compare them. The Revise toolkit [15] captures low-level interactions to allow users to replay, review, and explore their past interactions. Roth, et al. [6] have implemented a time travel history mechanism in the Visage visualization system to address the lim-itations of the ubiquitous linear undo-redo mechanism. Users can also perform selective undo operations.
The history mechanisms we looked at are based on low-level mechanical inter-actions, parameters and data flows, or on undo-redo stacks. Though these history mechanisms are easy to implement, we propose that users can benefit from se-mantically meaningful history models that aggregate low-level user actions into higher level operations which are analytically meaningful and are easier to asso-ciate with analytical tasks. Several taxonomies have been proposed to categorize low-level interactions into higher level operations, at different granularity. Shnei-derman [17] proposed a taxonomy of tasks - overview, zoom, filter, details-on-demand, relate, history, and extract based on the data type of the information. Chuah, et al. [4] categorized user actions into graphical operations, set opera-tions, and data operations. These and a few other taxonomies ( [1], [7], [11]) are organized around low-level interactions and are only distantly related to a user’s analytical tasks. A captured history is most useful if it is relevant to a user’s own understanding of the tasks they perform.
According to Norman’s action cycle [13], user goals are translated into a set of intentions. Intentions are carried out by performing a set of action commands. In visualization tools, users perform action commands by interacting with input devices such as mouse and keyboard. Though users are aware of their goals and intentions, it is not obvious how to identify and record intentions and the user’s goals motivating their interactions. Previous history mechanisms are based on
low-level keyboard, mouse, and other mechanical aspects of user interactions. We argue that it is desirable to record history in terms of higher level user intentions and goals, in opposition to the traditional history models.
Yi, et al. [22] categorize low-level user interactions into seven higher level user intentions: Select, Connect, Encode, Filter, Explore, Reconfigure, and
Abstract/Elaborate. This taxonomy is interesting to us because interactions
are categorized around user intentions, which are closely related to analytical tasks. Hence we chose this taxonomy of interaction as our base model for de-veloping a new history mechanism. Our aim is to identify the user intention(s) behind user interactions under the Yi, et al. taxonomy, and record those inten-tions for later replay. To realize this aim, we developed a set of rules to translate low-level interactions into each of the seven user intentions. We present a user interface to allow users to query the intention log and replay the interactions involved in selected intentions. The rest of the thesis document is organized as follows:
• Chapter 2 provides background information on interactive visualization, interaction parameters, visualization operators, coordinated multiple views, and coordination graphs.
• Chapter 3 discusses the intentions in the Yi taxonomy, the approach we use to detect user intentions and the rules we identified to detect user intentions. • Chapter 4 describes implementation of the coordinated graph structures as sets of rules to deduce user intentions, logging of the user intentions, and the user interface for browsing and revisiting histories.
analyze the user interface in terms of the queries it can and cannot express. • Finally, Chapter 6 outlines future directions for this work and concludes.
Chapter 2
Background
2.1
Information Visualization
Information visualization (InfoVis) is the study and practice of using visual rep-resentations of data to help people gain insights into the data. Histograms, bar charts, pie charts, line plots, scatter plots, box plots, and tree maps are the most commonly used visual representations. A visualization can be either static or interactive. As the name suggests, a static visualization provides an unchanging image, while an interactive visualization allows the user to control aspects of the visual representation and the data it visualizes. Though a static visualization helps user understand the data, often it does not provide enough ground to an-swer all the questions user may have about the data especially when the data set is large and highly dimensional. Interactive visualization overcomes the limita-tions of static visualization by allowing the user interact with the visualization. By the virtue of interaction users can explore different dimensions and aspects of data by dynamically altering their queries.
data by encoding it in visual channels such as shape, position, color, size, and orientation. Different attributes of the data set can be mapped to these visual en-coding channels. Apart from the views, a visualization often contains additional components called Controls. Controls allow a user to modify input parameters that affect one or more views. Range sliders, alpha sliders, checkboxes, combo boxes, text boxes, and radio buttons are examples of controls. The difference between controls and views is that views display data where as a control shows a value of an input parameter and allows the user to modify that parameter value interactively.
Interactions define the behavior of views. User perform interactions to ma-nipulate where they are looking and what they are looking at. The process of interaction happens in an iterative manner, in which the current state of the visu-alization serves as both motivation and context for the next user interaction. In other words, user interactions are motivated by the information a user is already viewing and information he would like to view.
If we consider an example of online shopping, a user interacts with a website by first picking the main category of a product they are looking for. As a result of user interaction, the website updates the list of visible items to show only relevant products. An interaction to change any sub category or price range further alters the products and updates the display. The user considers the list of products being displayed and internalizes these findings before performing another interaction. This process of information exploration repeats until user is satisfied.
Interactions transform a visualization from one state to another. Each inter-action can be thought of as a function that maps a visualization from an input state to an output state. The resulting visualization state depends upon the
in-Figure 2.1: Example of an interactive visualization designed for exploring Earth-quakes that occurred in Oklahoma between 2011 and 2014. The earthquake view (A) is a scatterplot in which earthquakes are represented as circles at locations identified by longitude and latitude attributes in the data set. A table view (B) lists the earthquakes in the data set used in the visualization. Views A and B display only the records which satisfies user-controlled filter critieria (Year =
2014 and Magnitude >= 2). C and D are slider controls which allow the user
to modify the filter criteria. Color control E, and Value control F allow the user to pick the color and the radius of earthquake glyphs respectively, to suit their preferences.
put state and the user interaction. An input visualization state, given different user interactions, usually leads to distinct visualization states. Common inter-actions that users perform in a visualization include panning and zooming in a scatter plot, changing a slider value, checking a check box, picking an item from a drop-down list, rotating the coordinate system of a view, marking data items, and many more.
2.2
Visualization Parameters
State of a visualization depends upon values of its parameters. Parameters are user inputs to the visualization, which can be modified by interacting. Every pa-rameter has a data type and a value associated with it. Papa-rameters are connected to the views. Often a parameter is connected to more than one view. Parameter values can also be referred to by data transformation operators in the data flow pipeline. A view redraws when any value of one or more parameters connected to it changes. Jankun Kelly, et al. model the visualization process, including data processing and interaction in the data flow pipeline, in terms of sets of vi-sualization parameters (P-Set) [10]. User interaction with a view can modify one or more parameters connected to the view. When a parameter is modified, it broadcasts a change notification to all views and operators that are connected to it. Views redraw themselves upon receiving a parameter change notification.
Parameter changing allows user to dynamically choose visual queries. For example, in figure 2.1, controls C, D, E, and F allow the user to modify input parameters Earthquake Year, Magnitude, color, and radius, respectively. The Earthquake Year and Magnitude parameters currently have values 2014 and 2, respectively. The views only display records that satisfy the filter condition(Year
=2014 and Magnitude >= 2). If the user chooses to view only the
earth-quakes that have magnitude 3 and above, they can do so by moving the position of slider D from 2 to 3.
The number and types of parameters that a view accepts depends on the type of the view itself. For example a scatterplot has two (min, max) range parameters to determine the cartesian coordinate region. A timeline plot has only one navigation parameter, time range.
Scatterplot X-Axis Range Parameter Y-Axis Range Parameter Glyph Dataset Parameter X Coordinate Parameter Y Coordinate Parameter Selection Parameter
Figure 2.2: Necessary parameters of scatterplot view: X-axis and Y-axis range parameters are (min, max) range parameters to determine the cartesian region. X and Y coordinate parameters are real valued parameters for determining coor-dinate point inside a view. Selection parameter to capture the data items that the user has selected in scatterplot view. Glyph dataset parameter contains glyphs of all records drawable in the view.
Certain parameters are common to all views. All views have at least one glyph data set parameter which will be used to draw the information. A glyph is a graphical mark such as circle, rectangle, or text. Most views have a selection parameter to capture the data items that the user has selected in the view. Figure 2.2 shows the necessary parameters of a scatterplot view.
2.3
Operators
In visualization tools, source data often undergoes a sequence of transformations leading up to display. Common operations include filtering a data set, concatenat-ing datasets row-wise, mergconcatenat-ing datasets column-wise, sortconcatenat-ing a data set, removconcatenat-ing unwanted columns, and transforming records into drawable glyphs. Entities that perform these operations are called Operators. Operators abstract transforma-tions by taking inputs and generate output that can be expected by performing
the operation. Commonly used operators in visualization tools include filter, sort, projection, union, join, and visual mapping(record ->glyph).
Filtering is performed to create a subset of the original data set, such that every record in the subset satisfies the filter condition. The inputs to a filter operator are a data set and a filter condition. As explained in the previous section, a filter condition may depend on multiple input parameters. A sorting operator takes a data set and a binary comparison criteria as inputs and orders the data set accordingly. A projection operator maps each record in one data set into a record in a new data set and is often employed to generate derived attributes and delete unnecessary columns prior to other transformations including glyph generation. A union operator takes two or more column-compatible data sets as input and generates a data set comprising non-redundant records from either dataset. The union operator concatenates data sets row wise. The merge operator merges two input datasets column wise and generates a data set that contains columns from both data sets.
Visual mapping operator converts each record in the input data set into a glyph to be drawn in a view. This operator has a template that defines the visual encoding channels such as shape, location, size, color, and orientation of each glyphs. Attributes of the record and parameters can both be used to define these visual encoding channels.
Our research focuses on filter, sort, projection, and visual mapping data set operators, because these are essential to define intention rules.
2.4
Coordinated Multiple Views (CMV)
Analyzing datasets is challenging. Difficulty in analyzing these datasets arises from both a large number of attributes and the complex relationships between them. Another problem is that attributes can be individually complex and may each require special attention. Some attributes, such as geographical information and time series are better suited to special types of views. To address these problems, researchers have proposed techniques to create coordinated multiple views (CMV). Using CMV, users can explore relationships between attributes by interacting with records displayed in multiple views. Each view may display attributes different from those displayed in other views. View can be coordinated
so that interactions performed in a view affects other views.
The visualization in figure 2.1 is an example of CMV. When the user manip-ulates Earthquake Year value in slider control C, the earthquakes map view and the table view both filter the data to show only the records corresponding to that year. In other words, the slider control and the two views coordinated through the Earthquake Year parameter. Dependencies between parameters, operators, and views in a visualization form the coordination graph of the visualization. For multiple views to coordinate, views should either directly share the parameters or indirectly, the data transformations of one view depend on the parameters of another view. To create CMV, vis designers need to compose the coordination graph with the parameters, operators, data sets and views in a meaningful man-ner(without creating cyclic dependencies). There can be multiple data sources, interaction sources, and display sinks in a coordination graph.
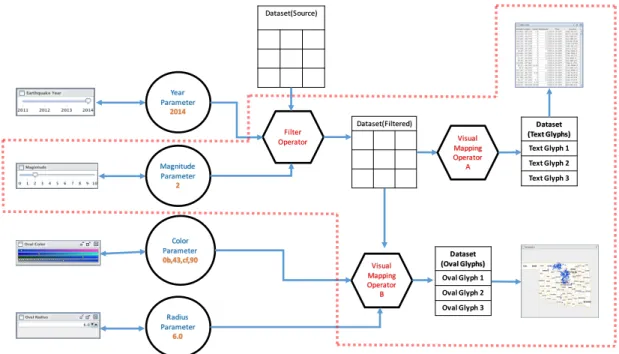
Figure 2.3 shows coordination graph for the example visualization. Arrow direction represents the direction of parameter change propagation. The filter
criteria of the filter operator is a function of input parameters Magnitude and Year. Similarly, the visual mapping operator of the Earthquake View depends on the oval color and oval radius parameters. The coordination graph specifies which parameters, operators, data sets, and views should update whenever user interactively modifies a parameter. For example, if the user alters the Magnitude slider’s position, the Magnitude parameter changes as a result. The filter operator then updates due to the dependency on the Magnitude parameter in it’s filter condition, by generating a new data set. The visual mapping operator takes the new data set as input and calculates a new glyph data set which will be delivered to the views for display. The region outlined by the dotted red line in figure 2.3 is the subgraph of the coordination graph that recalculates when user interacts with the Magnitude slider.
Magnitude Parameter 2 Year Parameter 2014 Color Parameter 0b,43,cf,90 Radius Parameter 6.0 Filter Operator Visual Mapping Operator B Dataset(Filtered) Dataset(Source) Dataset (Oval Glyphs) Oval Glyph 1 Oval Glyph 2 Oval Glyph 3 Visual Mapping Operator A Dataset (Text Glyphs) Text Glyph 1 Text Glyph 2 Text Glyph 3
Figure 2.3: Coordination Graph for the visualization in figure 2.1. The dotted red line region contains the interaction subgraph that is dependent upon Magnitude parameter
Magnitude Slider Magnitude Parameter Filter Operator Dataset(filtered) Visual Mapping Operator A Dataset(Text Glyphs) Table View
Magnitude Slider Magnitude Parameter Filter Operator Dataset(filtered) Visual Mapping Operator B Dataset(Oval Glyphs) Earthquake View
Figure 2.4: Coordinated query paths resulting from user interaction in magnitude slider
Figure 2.4 further dissects the subgraph into two individual paths that define the individual effects of interaction on the earthquake and table views. The view in which the user interacted, and the view in which interaction effects are seen, are referred as the source view and the target view, respectively. In the example, the Magnitude slider is the source view. The table and earthquake views are the target views.
Chapter 3
User Intentions
Our goal is to log user actions and allow users to revisit the history by searching the action log. To achieve our goal, we can track mouse and keyboard changes that happen in the system whenever the user interacts. However, these interac-tions are too mechanical and low-level to track. Interacinterac-tions can also be tracked at the parameter level by logging parameter changes. Though this approach is feasible, it requires a lot of effort and memory to use the log. Hence we aim to log user interactions at a level higher than raw interaction events. Yi, et al. categorized low-level user interactions into seven higher level interactions based on user intentions. The seven higher level intentions are:
• Select: Mark something as important.
• Connect: Show me related items.
• Encode: Show me a different representation.
• Filter: Show me something conditionally.
• Explore: Show me something else.
• Reconfigure: Show me a different arrangement.
To log user interactions at the user intention level, we need to deduce the analytic connotation of user interactions. When a user interacts with the sys-tem, data available for probing user intention come from keyboard, mouse, and parameter change events. It is hard to deduce user intention from keyboard and mouse events directly, as these events are mechanical. However, keyboard and mouse interactions modify parameters. Parameter changes reflect user intention more meaningfully. However, looking at modified parameter value changes alone is still not sufficient to identify user intention.
Many coordinated multiple view visualizations are built around the data state model [3], in which data undergoes analytical, visualization, and visual mapping transformations before being displayed in views. According to this model, when a parameter value changes, it affects other entities such as operators, datasets, and finally views themselves. Changes in parameters, operators, datasets, and views taken together, and the sequence in which these entities have changed, define the effects that user interaction has on the visualization overall. We use the coordination subgraph involved in any given parameter change to determine user intentions. (We use the terms interaction subgraph, coordination query subgraph, and subgraph interchangeably to refer to the interconnected components of a visualization that change as a result of user interaction.)
Our hypothesis is that the coordination query sub graph involved in a given user interaction provides a sufficient fingerprint to identify and characterize user intention. To develop this hypothesis, we looked at the coordination graphs of existing visualizations to dissect the various ways that visualization designers
compose coordination graphs to allow user to express the seven intentions. We identified patterns of subgraph structure for all seven higher level intentions. Each of these seven higher level intentions have one or more coordination subgraphs, all distinguishable from each other. Having distinguishable coordination structures allow us to map interactions to intentions with sufficiently low ambiguity. In the following sections we briefly explain each of the seven user intentions and the coordination subgraphs that we identified for each one.
3.1
Select
Users perform selection to highlight data records of interest. Selection helps user keep track of particular items during ongoing navigation and other kinds of visual querying, such as rotating or filtering views. Typically, visualization designers chose a distinct fill or edge color to differentiate the glyphs of selected records from unselected ones. Designers can use other visual encoding channels, such as shape, size, or orientation, to distinguish selected from non-selected data items. For instance, selected records can be encoded as a rectangular shape, different from the circular shape of a non-selected record, or the size of the selected records could be much larger than the non-selected records.
Users can perform selection intention in variety of ways, such as clicking, making a lasso or a rubber band selection, or by hovering over data items. In visualization systems, selections made using such methods are represented inter-nally as a special parameter value that parallels records in the visualized dataset. The selection parameter could be represented either as an array of booleans or an array of bits (in Improvise, selection parameters are based on the Java BitSet class). An on at index position i in the selection array means that the record
Figure 3.1: Example of the Select interaction. All the earthquake glyphs lying within the lasso region are selected. Selected earthquakes are highlighted in yellow. Non-selected ones are represented in blue.
with record ID i in the data set is currently selected.
When a user performs selection in a view, the selection parameter bound to the view (if any) gets updated. Figure 3.1 shows an example of a select interaction. After selection is performed, to differentiate the selected from non-selected records, the visual mapping operator checks if the record is set to on in the selection parameter. It uses this information to determine the shape, color, and size of the record’s glyph. Because the visual mapping operator is dependent on the selection parameter, whenever the selection parameter changes, the visual mapping operator is notified and recalculates it’s glyph data set. The updated glyph data set will be given as input to the view for rendering. Figure 3.2
Selection Parameter Visual Mapping Operator View A Dataset (Glyphs) Glyph 1 Glyph 2 Glyph 3 View A/B Dataset (Source) Record 1 Record 2 Record 3 Uses
Figure 3.2: Subgraph for common Select intentions
shows the generic structure of coordination query subgraph that is impacted when selection is performed in a typical Improvise visualization.
Brushing is another form of selection interaction. In a CMV visualization, when two or more views visually represent the same records, brushing is often used to visually highlight the selected records in some or all of those views at the same time. Figure 3.3 shows an example of visually linking multiple views through selection. Selection performed in one view highlights the records in all other views that share same data set and selection parameter. As shown in figure 3.2, the target view can be the locus of interaction (view A) or a different view (view B). If the target view is A, highlighting is observed directly as selection is performed. If the target view is B, records are highlighted indirectly as selection is performed elsewhere.
Yi, et al. categorize brushing as a connect intention. A connect intention explicitly reveals relationships between different records. However, in the case of brushing, the same records are implicitly connected by virtue of being highlighted in different views. Hence we treat brushing as a selection intention.
pa-Figure 3.3: Brushing Interaction: Selection is performed in top left scatterplot of the visualization to highlight the records. Selected records are highlighted in blue in remaining scatterplots and table view.
A B
Figure 3.4: (A) Selection defined by mouse hover coordinates (x, y). (B) Selection defined by a movable rectangular region. Selected records are highlighted in red color.
rameter in the visualization system. Visualization designers provide alternative ways to define selection without depending on the selection parameter. For in-stance visualization designers may allow users to drag and stretch a persistent rectangular region (a Lens) in a view, to highlight the records present within the region (see figure 3.4). Similarly, users can hover over a point in the view to highlight the data item(s) beneath it. In these situations users are not manipu-lating a selection parameter, but rather non-selection parameters that determine record highlighting. Figure 3.5 shows the interaction subgraphs involved in select interaction performed using a rectangular region and a point.
Coordinate Point Visual Mapping Operator View A Dataset (Glyphs) Glyph 1 Glyph 2 Glyph 3 View A/B Dataset (Source) Record 1 Record 2 Record 3 Uses Coordinate Region Visual Mapping Operator Plane Lens Dataset (Glyphs) Glyph 1 Glyph 2 Glyph 3 View Dataset (Source) Record 1 Record 2 Record 3 Uses
A
B
Figure 3.5: (A) Coordination subgraph of selection performed by dragging and stretching a persistent rectangular ”lens”. (B) Coordination subgraph of selection performed by hovering over coordinate point (x, y).
3.2
Connect
A connect intention reveals relationships between data entities through interac-tive selection. When user performs selection, the entities related to the selected ones get highlighted through some common characteristic. This is in contrast to selection intentions, in which identity determines highlighting. Figure 3.6 shows an example of connect activity involving two distinct datasets. A map view vi-sualizes commercial flights data by drawing a line for each flight from origin to destination. A table view shows aggregate flights by carrier. When a user selects a carrier in the table view, the flights associated with the selected carrier are highlighted in red color on the map. Flight records and carrier summary records are connected visually through carrier name attribute using color. By selecting a carrier, the user is able to see airports between which the carrier operates flights. In this example, the user can perform connect interactions to explore carrier-flight relationships.
Figure 3.7 shows the subgraph that is involved in the connect interaction. To
Figure 3.6: Example of a connect interaction between different Datasets/Entities. Map view highlights the flights that belong to the selected carrier(s) in red color to reveal carrier-flight relationships.
connect the selected entities of data set A with the non-selected related entities of data set B, a new data set that contains only the selected items of data set A needs to be generated by applying a filter operation. The filter condition tests if the record is selected. Once the data set of selected records is generated, a lookup operator uses this data set to generate an internal index table on the characteristic on which the connect needs to be performed. The visual mapping operator uses the index to look up whether the record in data set B has a relationship to the selected records. The visual mapping operator highlights the corresponding glyph if it’s record in data set B is related to any of the selected records.
Connect reveals relationships between different types of objects present in two datasets. The datasets are typically distinct but may well be the same. For instance, a view shows employee records of an organization and the user interaction is to highlight all employees who belong to the same department as a selected employee. In this case, the user is trying to explore a relationship between objects (employees in the same department) within a single data set using a connect interaction.
Selection Parameter Filter Operator View Dataset (Selected) Selected Rec1 Selected Rec2 Selected Rec3 View Dataset (Dataset A) Record 1 Record 2 Record 3 Uses Lookup Index Operator Visual Mapping Operator Dataset (Dataset B) Record 1 Record 2 Record 3 Uses Dataset (Glyphs) Glyph 1 Glyph 2 Glyph 3
3.3
Encode
According to Yi, et al., any interaction that modifies the visual representation of the data is categorized as encode intention. An encode intention allows users to choose the visual representation that works best for them. As explained in the previous sections, visual mapping operator determines shape, color, size, position, and orientation of the glyphs using data attributes, parameters, and constant values. Altering any parameter which in result changes visual encoding of the data items in one or more views is treated as encode intention. Users can change visual encoding of data in two ways: Firstly, updating the parameters that are used to determine the encoding channels, and secondly, by updating the attributes that are used to determine encoding channels.
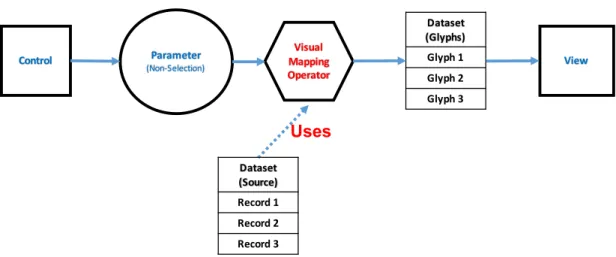
Figure 3.8 shows the coordination query subgraph that involves in the encode intention of first type. Example interactions that have this type of sub graph are: changing the color scheme used for representing the glyphs, modifying the width and hight of the glyphs as shown in figure 2.1. By interacting, users modify parameters which are used by visual mapping operator. Visual mapping operator creates new glyph data set because the input parameters have changed. However, selection parameter is an exception to the encode intention. As explained in the previous section, when user performs selection, visual mapping parameter changes as a result of change in selection. Selection can be thought of as a special attribute of data set that contains value as either true/false or 0/1. So any changes to visual mapping parameter as a result of change in selection, can be considered as a change in data rather than change in the encoding of the data. Second type of Encode interaction involves changing the attributes assigned to encoding channels color, width, and hight. Visualization in figure 3.9 provides
Parameter (Non-Selection) Visual Mapping Operator Control Dataset (Glyphs) Glyph 1 Glyph 2 Glyph 3 View Dataset (Source) Record 1 Record 2 Record 3 Uses
Figure 3.8: Coordination query subgraph for the Encode interaction a way for user to choose the attributes used for determining color and size (width and hight) of the oval glyphs. According to the current encoding scheme, depth and magnitude attributes of earthquake data set are determining size and color of the oval glyphs respectively. Earthquakes having more depth are represented with bigger ovals compared to the ones having lesser depth. Similarly, color of the earthquakes having more magnitude are drawn in darker red color compared to earthquakes having smaller magnitude. Using this encoding, users can easily see that the earthquakes having higher magnitude have less amount of depth to them and vice versa. With the current encoding scheme, users can explore Magnitude, Depth attributes, and relationships between them. With the help of encode interaction, users can explore different attributes and relationships between them by interactively changing the encoding scheme.
Figure 3.10 shows the coordination query subgraph that involves in dynam-ically changing encoding scheme. User updates encoding scheme by changing attribute selection. As attribute selection has changed, selection index operator identifies the index number (attribute ID) of the selected attribute and inputs the same to visual mapping operator. The visual mapping operator encodes
at-Figure 3.9: Encode intention: Changing data attributes used to calculate size and color of the earthquake glyphs.
tribute value present at the position given by index number to either size, color, or shape of the glyphs.
Selection Parameter Visual Mapping Operator View Dataset (Glyphs) Glyph 1 Glyph 2 Glyph 3 View Dataset (Source) Record 1 Record 2 Record 3 Uses Selection Index Operator
3.4
Filter
Filter interactions allow users to visualize subset of data items which are satisfying certain criteria specified by filter condition. If a record satisfies condition specified by the filter operator, then the record will qualify to be presented in the view, otherwise it will be ignored. Users can change the filter conditions dynamically by manipulating the parameters on which filter operator is depending on. Filter is applied on the input data set to create a new data set that contains all the records satisfying the filter criteria. Once the new data set is generated, visual mapping operator transforms the data set into glyphs to be visualized in views.
Figure 3.11 shows the rule for detecting the filtering interaction. Users interact with controls such as range sliders, check boxes, and dropdown menus to filter the records. Direct manipulation of these controls modify parameters connected to them. Parameter change propagates to filter operator as the filter condition depends on the value of the parameter. Change of the filter condition forces the filter operator to generate new data set. ’*’ on the edge suggests that the new data set may undergo optional operations such as sorting and projection before being visualized. Parameter (Non-Selection) Control Dataset (Filtered) Record 1 Record 2 Record 4 Filter Operator Dataset (Source) Record 1 Record 2 Record 3 Record 4 Uses Visual Mapping Operator Dataset (Glyphs) Glyph 1 Glyph 2 Glyph 3 View Dataset Record 1 Record 2 Record 3 Any Dataset Operator
*
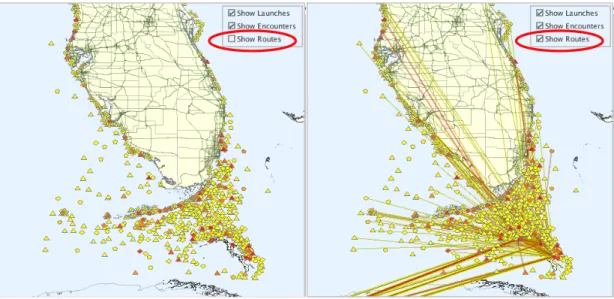
Figure 3.12: Example for filter interaction using masking approach Masking is another filtering mechanism vis designers employ when layered approach is used to construct a view. As shown in figure 3.12, multiple layers of a view can be used to show different information. In the example, ‘Show Routes’ check box allows user to make layer showing information about boat routes either visible or invisible. This filtering allows user to make unwanted information on a layer invisible to reduce cluttering in a view. Figure 3.13 shows the interaction subgraph that involves in masking filter interaction. When user interacts with control, the boolean parameter connected to the view gets updated. Modified boolean parameter then notifies view that it has changed. View then makes the corresponding layer either visible or invisible based on the value of the boolean parameter.
Boolean Parameter
Control View
Figure 3.14: Perceptual filter: Selected records are shown in bright colors. Non-selected records are shown in translucent colors.
Perceptual Filter is another filtering mechanism which makes non-selected en-tities almost transparent and selected enen-tities brighter as shown in figure 3.14. Since visual mapping operator calculates translucency based on selection param-eter of the view, interaction subgraph of perceptual filter matches with that of Select interaction. In scenarios like these, it is not possible to distinguish select from perceptual filter without analyzing the color values visual mapping oper-ator uses to represent both selected and non selected. However, analyzing the individual parameter and operator values is beyond the scope of this research. To address collision between the two graph structures of these two interactions, we chose to log only select interaction because of two reason, firstly user has per-formed selection to pick objects he is interested in and secondly, the non-selected
items are not completely removed from the view, instead these are made more transparent than the selected ones.
3.5
Abstract/Elaborate
Abstract/Elaborate interaction enables user to view data at different levels of abstraction. Elaborate is to view information at detail level while Abstract is to visualize data at a overview or summary level. Because of the limited screen size and perceptual and cognitive limitations of human, all the information cannot be visualized at once. It makes sense to first get a overview of the data before delving into the details. overview - select - filter - details, Semantic Zooming, and Tooltip interactions are the examples of Abstract/Elaborate.
In case of overview-select-filter-details, overview often presents aggregated information in the forms of categories that best represents the information. De-tail View presents elaborate information of the selected category in the overview. Upon selecting one or more categories in overview, detail view visualizes informa-tion specific only to the selected ones. Figure 3.15 shows the interacinforma-tion subgraph of overview - select - filter - details interaction. Filter operator A takes selection parameter and data set of Overview and generates a new data set which contains list of selected overview categories. Filter operator B takes detail data set and data set of selected overview records as input and generates a new data set which contains records of detail data set which belongs to selected overview categories only. Filter criteria is to check whether or not record from detail view belongs to any one of the selected categories.
When user performs selection in overview, the selection parameter of the view gets updated. As the selection parameter of overview is changed, filter operator
Selection Parameter Visual Mapping Operator Overview Dataset (Glyphs) Glyph 1 Glyph 2 Glyph 4 Detail View Dataset (Selected) Record 1 Record 2 Record 4 Filter Operator Dataset (Overview) Record 1 Record 2 Record 3 Record 4 Uses Dataset (Selected) Record 1 Record 2 Record 3 Any Dataset Operator
*
Dataset (Selected Details) Record 1 Record 2 Record 4 Filter Operator Dataset (Detail) Record 1 Record 2 Record 3 Record 4 UsesFigure 3.15: Interaction subgraph for the Overview - Select - Filter - Details interaction
A generates a new data set of selected categories. Since the selected categories data set has changed, filter operator generates a new detail data set to reflect the newly selected overview categories. As explained in previous section, the subsequent optional operations such as sorting and projection can be applied on new detail data set before visually transforming the data set into glyphs.
Tooltip details is another widely used Abstract/Elaborate interaction. Using Tooltips, a user can mouse hover on a data item to view additional details of the item as shown in figure. Figure 3.16 shows interaction subgraph for the tool tip interaction. Hovering can be captured in different ways. Two most commonly observed mechanisms to capture hovering are through coordinate point (x, y) and selection parameter. Coordinate point (x, y) parameter which is location of mouse in a scatterplot view, can be used to determine whether or not a data item is close to point (x, y). A record can be treated as hovered item if it is beneath mouse position. Capturing mouse hover through selection parameter is explained in previous section. Filter operator generates a new data set that contains only hovered item. The hovered record then visually transformed into a glyph to be visualized in tooltip view.
Selection or X or Y Coordinate Visual Mapping Operator View Dataset (Glyphs) Glyph 1 Tooltip view Dataset (Hovered) Record 1 Filter Operator Dataset (Source) Record 1 Record 2 Record 3 Uses
Figure 3.16: Coordinate query subgraph for the Tooltip(Elaborate) interaction Semantic Zooming is another commonly used technique which can be classified under Abstract/Elaborate interaction. Semantic zooming technique is applied to views where range is one of the fundamental parameter. Scatterplots visualize information present with in coordinate region defined by X and Y-axis extent. Similarly timeline plots presents information within a time range. In these kind of views, Semantic zoom-in on horizontal and/or vertical axis will provide more details, while zooming out would provide less details. The idea is to decide on what level of details need to be presented based on the extent of the axis or zoom level. So the extent of the axis decides the records to be visualized in the view. Google maps zoom-in and zoom-out is an example for semantic zoom interaction. Depending on the amount of zoom, level of information varies from countries, states, cities, and streets.
When user zooms in or zooms out, the extent of the axis is modified. Change in the extent of the axis results in recalculation of the data set that needs to be visualized. Hence parameter change graph looks as shown in figure 3.17. The filter operator calculates extent/zoom level using input range parameters and calculates new data set to be visualized at that zoom level. The new data set may undergo optional data transformations such as sorting and projection before getting visualized.
X/Y Range Parameter Visual Mapping Operator View Dataset (Glyphs) Glyph 1 Glyph 2 Glyph 3 View Dataset Record 1 Record 2 Record 3 Any Dataset Operator
*
Dataset (Selected Details) Record 1 Record 2 Record 3 Filter Operator Dataset (Detail) Record 1 Record 2 Record 3 Record 4 UsesFigure 3.17: Parameter change graph for the Semantic Zoom(Abstract/Elaborate) interaction
3.6
Reconfigure
According to Yi, et al., reconfigure intention allows users to alter data arrange-ment in a view. This interaction is useful because at times single arrangearrange-ment of the data might be not be sufficient for the data exploration and require different arrangements of the records. Ordering a data set is an example of reconfigure in-teraction. Records can be ordered based on particular characteristics of the data set either in increasing or decreasing order. Figure 3.18 provides an example of reconfigure interaction. Records are currently ordered on horsepower attribute of the vehicles. Users can change the attribute to be used for sorting by altering selection in the ‘Order By’ control. Users can also choose the order by checking or unchecking the ‘Order’ checkbox. When user checks the checkbox, records are sorted in ascending order, otherwise ordered in descending order.
Figure 3.19 shows the rule for detecting sort reconfigure intention. When user changes attribute selection, selection index operator identifies the index of
Figure 3.18: Example for reconfigure intention.
selected column. Since index of the selected column changes, sort operator orders the data set with respect to the attribute present at the index given by selection index parameter.
User reconfigures data set by changing attribute selection. As attribute selec-tion has changed, selecselec-tion index operator identifies the index number (attribute ID) of the selected attribute and inputs the same to sort operator. Sort operator generates a new data set by ordering the input data set based on the attribute present at location given by index number. The new data set may undergo optional data set operations such as projection and filtering before getting visu-alized. Similarly, user can alter a parameter to decide the order in which data set should be sorted.
Changing the data attributes assigned to position (x, y) of glyph is another interaction Yi, et al. classified as reconfigure. However we already categorized this interaction under encode intention because, assigning attributes to position
Selection Parameter Visual Mapping Operator View Dataset (Glyphs) Glyph 1 Glyph 2 Glyph 3 View Selection Index Operator Sort Operator Dataset (Source) Record 1 Record 2 Record 3 Uses Dataset (Sorted) Record 1 Record 2 Record 3 Dataset Record 1 Record 2 Record 3 Any Dataset Operator
*
Parameter Visual Mapping Operator Control Dataset (Glyphs) Glyph 1 Glyph 2 Glyph 3 View Sort Operator Dataset (Source) Record 1 Record 2 Record 3 Uses Dataset (Sorted) Record 1 Record 2 Record 3 Dataset Record 1 Record 2 Record 3 Any Dataset Operator*
A BFigure 3.19: Interaction subgraphs for reconfigure intention. A: Changing at-tributes used for ordering. B: Changing the order(Increasing or Decreasing).
3.7
Explore
Due to the limitations of screen size, large datasets and human perceptual and cognitive limitations, often views display only part of the data set. Explore interaction lets users analyze a section of data set before move onto the another section of data set. Most common explore intention technique is panning and zooming interaction. Panning is performed by grabbing the scene and moving it while camera stays still. Panning alters the X-Range and/or Y-Range of the view, i.e. changes region of the view to be shown. Hence panning is most suited to the views which display information within a range such as scatter plots and timeline plots. Users perform panning in google maps to view the geographic region of their interest. In timeline plots users alter time range by panning to visualize records within the modified time range. Figure 3.20 shows the subgraph
Axis Range Parameter
View A View A/B
Figure 3.20: Interaction subgraph for explore intention.
involved in panning explore interaction. When user is panning, view assigns new value to the axis range parameter. Since the range parameter is modified, it sends parameter change notification to all the views it is connected to including the view in which panning is performed.
Yi, et al. have categorized syntactic zooming as Abstract/Elaborate inten-tion. However, we consider zooming as explore interaction because when user is zooming, he is navigating in the information space.
Chapter 4
System Implementation
This chapter describes design and implementation details of our system. We implemented our history mechanism as part of Improvise [20] visualization envi-ronment. Implementation task of system is divided into subtasks as follows:
1. Identification of coordination query path for user interaction 2. Implementation of rule system
3. Detecting user intentions by matching coordination of query paths with the rules
4. Recording user intention details
5. Querying and Revisiting earlier visualization states
In the following sections, we will explain design and implementation choices we made to achieve the above tasks.
4.1
Coordination Query Path
As explained in section 2.4, when user interacts with the visualization, only sub-graph of the coordination query sub-graph involves in user interaction. However it is difficult to construct the entire interaction subgraph by using the parameter notification mechanism since parameter notifications moves forward and never retreats like functional calls does. It is possible to construct the coordination query path from source view to target view using the notification mechanism. In the following section, we will explain Improvise coordination architecture used to extract the coordination query paths involved in user interaction.
Improvise
Improvise is a coordinated multiple view visualization system. Improvise archi-tecture facilitates seamless coordination between multiple views through shared parameters. Figure 4.1 shows the coordination architecture of improvise. Ter-minology of improvise architecture is different from data set model. Parameters in Improvise are referred as variables. Similarly filter, sort, projection operators are referred as Lexical Filter, Lexical Sort, and Lexical Projection respectively. Datasets are referred as Lexical Info.
Improvise system brings parameters, operators and datasets under same um-brella by assigning lexical as value to the variable. By assigning lexicals to vari-ables, Improvise treats operators and datasets as special parameters. As shown in figure, parameter change notification goes through all the variables of parame-ters, operators and datasets before it reaches view. With the help of notification protocol, we can easily identify the objects of the coordination graph that involve in user interaction.
Figure 4.1: Used with permission from Chris Weaver [21]. Improvise notification mechanism. 1: User interaction within a control modifies active properties of control. 2: Changed properties assign new value to variable. 3: Variable sends a value change notification to all properties connected to it. 4: Properties assigns variable value to itself. 5: Variable also sends value change notification to all lexicals that refer to the variable in their expressions. 6: Lexical sends change notification to variable it is assigned as value. 7, 8: View updates itself to reflect the change in value of live property.
Coordination Query Paths
Improvise change notification protocol facilitates identification of coordination paths involved in user interaction. When a variable changes, it sends a change event notification to all the interested listeners. We enhanced notification mech-anism to capture list of types of all the variables which change along the path, from view in which user interacted to the view in which interaction has effects. When a variable receives change notification, it adds its type to the list and pass the list to the next variable. This process continues until the notification reaches property of the view. When property receives the notification, list has types of all the parameters and operators in the occurrence order along the coordination query path.
Magnitude Slider Magnitude Parameter Filter Operator Dataset(filtered) Visual Mapping Operator A Dataset(Text Glyphs) Table View Magnitude Slider Magnitude Parameter Filter Operator Dataset(filtered) Visual Mapping Operator B Dataset(Oval Glyphs) Earthquake View
Lexical Projection Lexical Info
Lexical Filter
Slider Integer Lexical Info TableView
Lexical Projection Lexical Info
Lexical Filter
Slider Integer Lexical Info ScatterplotView
Figure 4.2: Coordination query paths: Two coordination query paths are ob-served one for each target view when user interacts with the magnitude slider of the visualization shown in figure 2.3.
As shown in figure 4.2, each node in the path contains a type of the variable and reference to the succeeding node.
4.2
Rule System
Rule system holds the repository of the rules and matches those rules with coordi-nation query paths of the interaction. This section first outlines implementation of the rules and then explains rule matching algorithm.
4.2.1
Rule Implementation
Our rule system implements the mapping functions we identified in chapter 3 as set of rules. Idea is that when user interacts with the visualization, the coordi-nation query paths corresponding to the interaction can be matched with these rules to identify the user intention. The natural choice for implementing the rules is graph data structures as the functions are themselves graphs.
A rule system often enforces conditions such as an object can only be of certain types and/or not allowed to be of certain types to match a rule. In our
Attribute Type Description
Allowed Types List List of allowed types (parameters, operators, datasets or views)
Non-Allowed Types List List of non-allowed types
Optional Boolean Indicates whether a node is optional or not Forward Edge Node Reference to the succeeding node
Back Edge Node Reference to the back edge Table 4.1: Attributes of the nodes in a rule graph
rules we have cases where an operator can be any one out of filter, sort, union, and join operators. Similarly we also have cases where a parameter can not be of certain types. Allowed Types contains list of all acceptable types for that node, where asNon-Allowed Types contains list of types that node cannot be. Atype is considered to be a match for a node in rule graph only if the type is compatible with one of the Allowed Types and not compatible with Not Allowed types of the list. Figure 4.3 shows conversion of conceptual filter interaction graph into rule. As shown in figure, Backward Edge allows the rule to match multiple instances of the nodes present in between the nodes connected by it. Subsequence Lexical Projection –>Lexical Info –>Lexical Sort –>Lexical Info can be matched twice with back edge ’D’ shown in figure.
If there is a mismatch between the type and the node, Optional attribute identifies whether or not rule matching procedure should continue. If the attribute value istrue, rule matching procedure continues to match the type withForward
and Backward Edges of the node. Rule matching fails if a node is not optional. Value of Any in Allowed Types indicates that any type is compatible with that node. However, if the Non-Allowed Types list is not empty for such a node, node matches with all the types except the non-allowed types.
An y Pa ra m et er (N on -Se le ct io n) Co nt ro l Le xi ca l I nf o (F ilt er ed ) Re co rd 1 Re co rd 2 Re co rd 4 Le xi ca l Fi lte r Le xi ca l Pr oj ec tio n Le xi ca l I nf o (G ly ph s) Gl yp h 1 Gl yp h 2 Gl yp h 3 De ta il Vi ew Le xi ca l I nf o Re co rd 1 Re co rd 2 Re co rd 3 An y Da ta se t Op er at or
*
Al lo w ed : {A ny } No n-Al lo w ed :{ Se le ct io n} Op tio na l : NO Al lo w ed : {A ny } No n-Al lo w ed : {} Op tio na l : NO Al lo w ed : {L ex ic al F ilt er } No n-Al lo w ed : {} Op tio na l : NO Al lo w ed : {L ex ic al In fo } N on -Al lo w ed : {} Op tio na l : NO Al lo w ed : {L ex ic al S or t, Le xi ca l F ilt er , Pr oj ec tio n ..} No n-Al lo w ed : {} Op tio na l : YE S Al lo w ed : {L ex ic al In fo } N on -Al lo w ed : {} Op tio na l : YE S Al lo w ed : {L ex ic al Pr oj ec tio n} N on -Al lo w ed : {} Op tio na l : NO Al lo w ed : {L ex ic al In fo } N on -Al lo w ed : {} Op tio na l : NO Al lo w ed : {A ny } No n-Al lo w ed : {} Op tio na l : NO A B C D 4.3: Ru le construction for filter in terac tion. A: P arameter of an y typ e is all o w ed except selection parameter. B: y no de with data set op erator typ es suc h as Lexical Filter, Lexical S ort, Lexical Pro jec tion etc. can b e matc hed with no de. No de B a nd no de succeeding it are also opt ional. C: F orw ard edges enforces the succession in typ es D: Bac k addresses the zero or mor e o ccurrences of the typ es in b et w een the no des connected b y it.Rule Repository
System maintains rule repository as a list of Intent Name and Rule reference
pairs. When user interacts with visualization, system can match coordination query paths of user interaction with the rules present in the repository. When ever system identifies a match, intent corresponding to the rule can be recorded. In the following subsection, we will present the graph matching algorithm.
4.2.2
Rule Matching
For coordination query path to match rule’s graph, there should be a valid path from source node to target node in the rule’s graph resembling the coordination query path. Resemblance of the two paths is decided based on the types of the nodes. While validating a Type