Studying and Leveraging User-Provided Logs in Bug Reports for
Debugging Assistance
An Ran Chen A Thesis in The Department ofComputer Science and Software Engineering
Presented in Partial Fulfillment of the Requirements For the Degree of
Master of Applied Science (Software Engineering) at Concordia University
Montréal, Québec, Canada
September 2019 ©An Ran Chen, 2019
Concordia University
School of Graduate Studies
This is to certify that the thesis prepared By: An Ran Chen
Entitled: Studying and Leveraging User-Provided Logs in Bug Reports for Debugging Assistance
and submitted in partial fulfillment of the requirements for the degree of
Master of Applied Science (Software Engineering)
complies with the regulations of this University and meets the accepted standards with respect to originality and quality.
Signed by the final examining commitee:
Chair Dr. Aiman Hanna Examiner Dr. Emad Shihab Examiner Dr. Weiyi Shang Supervisor Dr. Tse-Hsun Chen Approved by
Dr. Leila Kosseim, Graduate Program Director September 10, 2019
Dr Amir Asif, Dean
Abstract
Studying and Leveraging User-Provided Logs in Bug Reports for Debugging
Assistance
An Ran Chen
B
ug reports provide important information for developers to debug user-reported issues. Dur-ing the debugging process, developers need to study the bug report and examine user-provided logs to understand the system execution paths that lead to the problem. Prior studies on bug reports also found that such user-provided often contain valuable debugging information to developers. In this thesis, we conduct a tool-assisted study to study user-provided logs in bug reports. Our goal is to study any challenges that developers may encounter when analyzing the logs, and how many additional buggy classes can the logs help to identify. In particular, we study both system-generated logs and exception stack traces. Our approach tries to simulate developers’ debugging process by 1) identifying the location in the source code where the logs were generated, 2) re-constructing execution paths by finding the call paths are can be traced back from the logs, and 3) studying the additional buggy classes that the re-constructed execution paths identify. We conduct our study on eight large-scale open-source systems with a total of 1,145 bug reports that contain logs. We find that the execution paths cannot be constructed in 32% of the studied bug reports, since many logs can no longer be found in the source code due to code evolution, and users often pro-vide logs that are generated by third-party frameworks. In the rest of the cases, the re-constructed execution paths can identify 15% additional buggy classes in 41% of the bug reports. Through a comprehensive manual study, we find that the main reasons that the re-constructed execution paths fail to identify additional buggy classes are that reporters often only attach logs that describe the unexpected behavior (e.g., stack traces) without additional logs to illustrate the system execution. In summary, this thesis highlights both the challenges and potentials of using user-provided logs to assist developers with debugging. It also revealed common issues with user-provided logs in bug reports, and provided suggestions for future research.Statement of Originality
I hereby declare that I am the sole author of this thesis. This is a true copy of the thesis, including any required final revisions, as accepted by my examiners. I understand that my thesis may be made electronically available to the public.
Acknowledgement
First, I express my deepest gratitude to my supervisor (Dr. Tse-Hsun Chen) and our co-author (Dr. Shaowei Wang) who helped me so much in completing this thesis, as well as giving me the opportunity to work on such interesting project. Although this is only my first thesis, I learned a lot from you guys.
Second, I express my sincere thanks to Dr. Emad Shihab and Dr. Weiyi Shang for their valuable suggestions. They give necessary advices and guidance to make this thesis better.
Third, SPEAR lab holds a great research environment, with wonderful colleagues and friends. I thank my follow labmates in SPEAR lab: for stimulating discussions, for keeping company, and for all the fun we have had outside of the campus.
Contribution of Authors
UBugs: An Empirical Study on Using User-Provided Logs in Bug Reports for Debug-ging Assistance
An Ran Chen: manual analysis, program implementation, writing, editing and proofing
Tse-Hsun (Peter) Chen: research supervisor, funding, experimental guidance, manual analysis, writ-ing, editing and proofing
Shaowei Wang: writing, editing and proofing
An Empirical Study On Leveraging Logs For Debugging Production Failures
Related publication
An Ran Chen, Tse-Hsun (Peter) Chen and Shaowei Wang, “UBugs: An Empirical Study on Using User-Provided Logs in Bug Reports for Debugging Assistance”, The 42nd International Conference on Software Engineering, ICSE 2020,under review.
An Ran Chen, "An Empirical Study On Leveraging Logs For Debugging Production Failures", in Proceedings of the 41st International Conference on Software Engineering: Companion Proceedings, ICSE-SRC 2019, Montreal, QC, Canada, May 25-31, 2019, pp. 126-128.
Contents
List of Figures x List of Tables xi 1 Introduction 1 1.1 Thesis Overview . . . 3 1.1.1 Chapter 2 . . . 3 1.1.2 Chapter 3 . . . 3 1.1.3 Chapter 4 . . . 4 1.1.4 Chapter 5 . . . 4 1.1.5 Chapter 6 . . . 4 2 Related Work 5 2.1 Log Analysis. . . 62.1.1 Debugging and Maintaining software . . . 6
2.1.2 Testing . . . 6
2.1.3 Detecting Anomaly. . . 6
2.1.4 Diagnosing Performance Problems. . . 7
2.2 Debugging Using Information in Bug Reports. . . 7
2.2.1 Bug Report Analysis. . . 7
2.2.2 Bug Localization. . . 8
3 Motivating Example 9 4 Collecting Bug Reports 12 4.1 Studied Systems. . . 13
4.2 Collecting and Filtering Bug Reports. . . 13
5 Our Approach to Study User-Provided Logs in Bug Reports 15
5.1 Step 1: Extracting Logs from Bug Reports. . . 16
5.1.1 Challenges and Our Solution. . . 16
5.2 Step 2: Locating Extracted Logs in Source Code. . . 16
5.2.1 Locating log snippets in the code. . . 19
5.2.2 Locating stack traces in the code. . . 19
5.2.3 Challenges and Our Solution. . . 20
5.3 Step 3: Constructing execution paths from logs. . . 20
5.3.1 Challenges and Our Solution. . . 21
6 Case Study Results 23 6.1 RQ1: To what extent can user-provided logs be used to re-construct execution paths? 24 6.1.1 Motivation. . . 24
6.1.2 Approach. . . 24
6.1.3 Results. . . 24
6.2 RQ2: How many additional buggy classes can the re-constructed execution paths identify? . . . 29
6.2.1 Motivation. . . 29
6.2.2 Approach. . . 30
6.2.3 Results. . . 30
6.2.4 Discussion. . . 32
6.3 Highlights and Implications of the Findings . . . 34
6.4 Threats to Validity . . . 35
6.4.1 External Validity. . . 35
6.4.2 Internal Validity. . . 35
6.4.3 Construct Validity. . . 35
7 Conclusion and Future Work 36
List of Figures
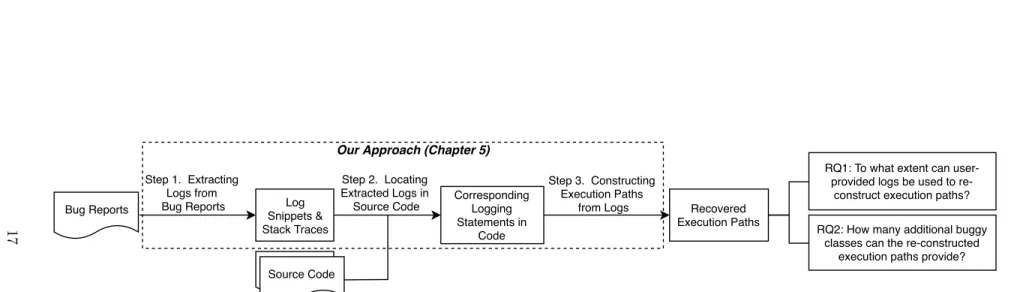
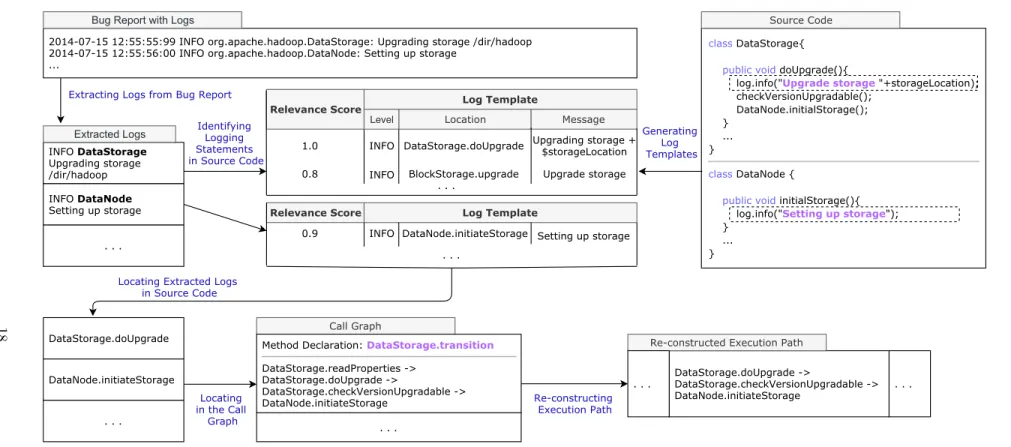
1 An overview of our approach to study the logs in bug reports. . . 17 2 An example that shows an overview of our approach to study the logs in bug reports. 18
List of Tables
1 An overview of the studied systems. BR represents bug reports; BRNL represents
bug reports with no logs;BRWLrepresents bug reports with logs (i.e., either contain
log snippets, stack traces, or both). . . 13 2 Manually-derived categories for which the log snippets/stack traces in a bug report
cannot be used to re-construct execution paths. . . 25 3 Distribution of the manually-derived categories for which the log snippets/stack traces
in a bug report cannot be used to re-construct execution paths. . . 26 4 An overview of the bug reports where the bug fixing locations can be identified on
the re-constructed execution paths. The numbers are calculated per each bug report. 31 5 Manually-derived categories for bug reports which the fix locations have no overlap
CHAPTER
1
Introduction
S
oftware debugging is an important and challenging task in software maintenance. As thecomplexity of modern software systems increases, developers need to spend more time on understanding system execution in order to locate the problem. A prior study [1] finds that de-velopers, on average, spend 33% of their time on debugging. To assist developers with debugging, prior studies [2, 3, 4, 5, 6, 7] re-construct execution paths using crash reports or complete system logs. However, these prior approaches often assume that developers have access to the entire system-generated logs or instrumented system runtime data. In practice, such information may not always be available due to privacy or technical (e.g., system overheads and the logs can be large in size) concerns [8, 9, 10], e.g., users usually only attach a portion of the system-generated logs in their bug reports, since the size of the entire log file is often several gigabytes or even larger [9, 11].Bug reports provide important information for developers to fix the problems that users en-counter [12, 13]. Typically, when reporters create a bug report, they need to provide a title, the severity (e.g., major or minor), the description of the problem, and system-generated logs (e.g., log messages or stack traces) which illustrate the system execution paths when the problem occurs. In particular, such logs may contain valuable debugging information for developers [12]. Based on the user-provided information, developers then diagnose the problem and resolve the issue. In general, developers first look at the description of the bug report and manually examine the attached logs. Then, they investigate where the logs were generated in the source code to find out where the bug might be. Finally, developers manually examine the source code and the corresponding logs, trying to understand how the system was executed when the bug happened and resolve the bug.
Intuitively, user-provided logs in bug reports illustrate the problems that users encounter and may help developers with the debugging process [12]. In this thesis, we study user-provided logs (i.e., either system-generated logs or stack traces) and their quality to validate the assumption. We conduct a tool-assisted study to identify how many additional buggy classes can the re-constructed
execution paths identify to developers. As shown in prior studies [1, 3, 14], developers use logs to manually re-construct system execution to debug problems. Hence, our tool tries to re-constructed system execution paths using the user-provided logs automatically.
We first extract logs from bug reports, and then we use a combination of text analysis and static analysis to locate the extracted logs to where they are generated in the source code. We call this part of the approachdirect log mapping, since it simulates how developers may do to locate where
the logs are generated in the source code. Then, we re-construct the execution paths by finding call paths that are able to connect the logs in the source code. Finally, we examine how many studied logs are able to re-construct execution paths, and how many additional buggy classes can the re-constructed execution paths identify compared to directly locating logs to the source code. We also conduct a comprehensive manual study on the user-provided logs to understand: 1) the reasons why some user-provided logs cannot be used to re-construct execution paths; 2) even when the execution paths are re-constructed successfully, why some re-constructed paths cannot identify additional buggy classes.
We conducted a case study on eight large-scale open source systems (i.e., Hive, Hadoop Common, YARN, MapReduce, HDFS, ZooKeeper, ActiveMQ, and Storm), which are commonly used in prior log studies [15, 16, 17]. We studied a total of 1,145 bug reports that contain logs. In summary, this thesis makes the following contributions:
• We developed a tool to simulate the debugging process of developers to understand the qual-ity of user-provided logs, i.e., 1) whether the user-provided log can be used to re-construct execution paths and 2) how many additional buggy classes could be identified if the execution paths could be re-constructed.
• We find that our assumption is only partially true. The user-provided logs in 32% (365/1,145) of the studied bug reports cannot be used to re-construct execution paths. Even in the rest 780 cases, in which the execution paths are re-constructed successfully, 59% (460/780) of them do not identify additional buggy classes compared to direct log mapping.
• Through a comprehensive manual study, we find that the main reasons why some logs fail to re-construct execution paths are: 1) code evolution (e.g., source code that generates logs is deleted or modified in prior versions); 2) the user-provided logs are incomplete or from third-party libraries.
• Through a comprehensive manual study, we find that the main reasons why some logs fail to identify additional buggy classes are: many user-provided logs only provide information for the point of failure (e.g., where the exception happens). However, the root cause of the problem may happen in an earlier part of the execution paths.
• The findings of our manual study furnish insights in the challenges of debugging process using user-provided logs in bug reports. We highlight the research topics that require greater atten-tion for future studies. Future research on bug reports and debugging focus on some direcatten-tions, such as analyzing development history when locating the user-provided logs; helping reporters provide more accurate logs; and leveraging additional readily-available runtime data to help developers better understand system execution for debugging.
In short, our study highlights the possibility of using readily-available logs in bug reports to assist developers with debugging. We also highlight several issues with the quality of user-provided logs. Our findings may inspire future research on debugging and bug report quality, and provide insight to practitioners on improving the attached logs in bug reports.
1.1
Thesis Overview
Chapter 2 surveys the related work. Chapter 3 presents motivating examples of our study. Chapter 4 discusses our case study setup and data collection process. Chapter 5 presents our approach of studying user-provided logs by re-constructing execution paths. Chapter 6 presents the motivation, approach, results to our research questions, and the threats to validity. Chapter 6.3 provides a discussion and implication of our findings. Finally, Chapter 7 concludes this thesis.
1.1.1
Chapter 2
We discuss related work in two areas: log analysis and bug report analysis. Each area is then further discussed from different aspects. We describe the prior studies based on their approach and main contributions. From this chapter, we notice that all prior studies, that leverage logs to assist developers, have a common assumption that developers have access to the entire logs, which is not the case in practice due to privacy or technical concerns. Developers often only have access to a portion of the logs which is provided by reporters. Thus, different from prior studies, we study user-provided logs in bug reports.
1.1.2
Chapter 3
We present a motivating example that describes a developer’s debugging process when resolving a bug report. Then, we discuss the real-life challenges that developers may face. Finally, we pro-pose our two research questions: 1) To what extent can user-provided logs be used to re-construct execution paths? 2) How many additional buggy classes can the re-constructed execution paths identify?
1.1.3
Chapter 4
We first describe the studied systems. Then, we present the steps of collecting and processing bug reports that contain logs in the studied systems. After analyzing 6,434 bug reports, we find that there is a non-negligible number (an average of 22.6%) of bug reports that contain logs.
1.1.4
Chapter 5
We present our approach in detail in this chapter. Our approach simulates the debugging process of developers in practice, to understand to what extent can the user-provided logs assist developers with debugging.
1.1.5
Chapter 6
We study the quality of developer-provided logs by answering two research questions. For RQ1, We find that for 32% of the studied bug reports, user-provided logs cannot be used to re-construct execution paths. We manually evaluate the reasons why logs in some bug reports cannot be used to re-construct execution paths and derive five categories: code evolution, third-party logs, incomplete logs, limitation of static analysis and others. For RQ2, we show that the re-constructed execution paths identify additional buggy classes in only 41% of the bug reports for which the execution paths can be re-constructed, and the re-constructed execution paths can identify an additional 6% to 25% of buggy classes. Furthermore, we discuss the implications on these findings in the last sub-section.
CHAPTER
2
Related Work
I
n this chapter, we survey related work in two areas: log analysis and bug report analysis. Ourgoal is to understand the current practices of leveraging logs and bug reports to assist developers with the debugging process.2.1
Log Analysis.
Logs are commonly used for understanding system execution [18, 19], debugging and maintaining software [3, 4, 14, 15], testing [11, 20, 21], detecting anomalies [22, 23, 24, 25, 26] and diagnosing performance [18, 19, 27].
2.1.1
Debugging and Maintaining software
Prior studies [14, 15] found that developers continuously improve logging code in software systems to assist in diagnosing production bugs. These log messages are often the only information that is available for diagnosing production bugs [3, 28]. Some studies [4, 28] tried to improve log messages (e.g., record values for important variables) to assist developers in diagnosing production bugs. Yuan
et al. [3] proposed a technique to assist developers with debugging by leveraging system runtime
logs. However, the authors themselves manually evaluated their technique on only eight production bugs. Other studies apply machine learning techniques to identify anomalies in the log messages, which may be an indication of possible problems [11, 22, 29]. Different from prior studies, in this thesis, we focus on studying the logs that are provided in bug reports, where the quality of the logs depends on the reporter. We found that although the user-provided logs can help to debug by re-constructing execution paths to some extent, there are still some challenges. We manually studied and documented the challenges that we found in user-provided logs and provide future research directions.
2.1.2
Testing
Some existing studies also apply log analysis to improve testing. For instance, Chen et al. [21]
estimate the code coverage using execution logs. The proposed approach matches the logs to the corresponding execution path, and resolves three code coverage criteria: method-level coverage, statement-level coverage and branch-level coverage. Chen et al. [11] compares systems’ workload
generated during testing to the one from historical execution to resolve test design challenges.
2.1.3
Detecting Anomaly.
Log analysis is widely used in anomalies detection in the past decades. Typically, researchers apply different techniques to detect the anomalies from the abundant information that the system provides. For example, Xuet al.[22] propose an approach to automatically detect run-time anomalies
using machine learning technique (i.e., PCA). In such case, the approach requires no human input nor internal knowledge of the software. Fu et al. [23] propose an anomaly detection technique
that models the log sequences into Finite State Automaton (FSA). This approach uses the log sequences to characterize the normal workflow and does not rely on any specific system knowledge. In practice, only a small portion of logs are problematic. He et al. [24] design an approach to
correlate the clusters of log sequences with system KPIs (Key Performance Indicators) in order to identify impactful service problems. The proposed approach is clustering-based and achieves a high accuracy. In particular, there are four steps to their approach: log parsing, sequence vectorization, cascading clustering and correlation analysis. Lou et al. [25] mine the program invariants from log
sequences. Their technique reveals the anomalies based from the learned invariants. He et al.[26]
review and evaluate six log-based anomaly detection techniques. Their paper provides guideline for better adoption of these techniques.
2.1.4
Diagnosing Performance Problems.
Prior research also apply log analysis on performance diagnosis. Nagarajet al.[30] use a machine
learning approach that leverages system logs to automatically determine the relationship between system components and performance. Chow et al. [27] model the performance based on logs. By
performing a critical path analysis, the approach suggests potential performance improvements. This study attributes latency to specific component. Chenet al.[18] leverage system logs to uncover the
relationship between a workload and database access. The approach models the cache configuration with a Petri net from which an optimal cache configuration is infered. Zhao et al. [19] leverage
runtime logs to understand the system’s performance behavior and associate logs to specific requests from static analysis.
2.2
Debugging Using Information in Bug Reports.
Prior studies found that bug reports are essential for debugging [12, 13, 31]. In particular, Bettenburget al.[12] found that stack traces and steps to reproduce bugs are important for a good
quality bug report. Due to the rich information in bug reports, some studies proposed approaches to locate bugs in the source code by using text information in bug reports [32, 33, 34, 35, 36, 37, 38, 39, 40, 41, 42].
2.2.1
Bug Report Analysis.
In particular, Wang et al.[36] and Ripon K.et al.[33] found that different parts of bug reports
(e.g., title and description) may provide more information to help locate the bugs in the source code. Different from prior studies, in this thesis, we conduct a tool-assisted study to simulate the developers’ debugging process when analyzing user-provided logs in bug reports. We found that
user-provided logs can identify additional buggy classes in some cases. However, more often, we found that there is some missing information in the logs that may prevent developers from using the logs to understand the system execution.
2.2.2
Bug Localization.
There exist many prior studies on bug localization. The techniques can be categorized into two categories: dynamic and static. Dynamic bug localization techniques localize a bug by exercising the system using test cases, which, in general, give better results than static techniques. In particu-lar, many prior studies propose techniques for spectrum-based bug localization [43, 44, 45, 46, 47]. Spectrum-based bug localization techniques use system execution traces that are collected during test execution to locate the bug. If a software artifact (e.g., code statement, basic blocks, or meth-ods) appears more in failed executions, it is considered to be more suspicious [46]. However, the effectiveness of such dynamic techniques is highly dependent on the existence of the test cases.
Static bug localization techniques, on the other hand, do not require exercising the system. Many prior studies apply information retrieval (IR) techniques to statically locate bugs in the code using natural language text in bug reports [32, 33, 34, 35, 36, 37, 38, 39, 40, 41]. Sisman et al.[41] found
that by using past version development history can help improve bug localization accuracy. Dao et al.[39] further combines dynamic information (e.g., failed test execution) with IR-based techniques
to improve localization accuracy. Wanget al. [36] and Saha et al.[33] found that different parts of
bug reports (e.g., title and description) should be assigned different weights in IR models. However, one major limitation of IR-based techniques is that they suffer from low localization accuracy and are only able to localize the bugs at the file level.
CHAPTER
3
Motivating Example
Prior studies [3, 4, 28] show that developers often use logs to understand system execution during the debugging process. In this chapter, we discuss a hypothetical but realistic motivating example to explain the process and the challenges of debugging such bugs using logs.
A user, Bob, encounters a bug during system runtime. The only information that Bob has is the system-generated logs (i.e., either system generated log messages, stack traces, or both) when the bug occurred, because he does not have the exact sequences of inputs to reproduce the bug. Bob then creates a bug report, providing a high-level description of the problem. In addition, Bob attaches a portion of the system-generated logs, since the size of the entire log file is often several gigabytes or even larger [9, 11]. Alice, a developer of the system, is assigned to work on the bug report. By following common debugging practices [3, 4], Alice conducts the approaches described below:
1. Alice first looks at the description of the bug report and manually examines the attached logs. 2. Alice investigates where the logs were generated in the source code to find out where the bug
might be.
3. Alice manually examines the source code and the corresponding logs, trying to understand how the system was executed when the bug happened.
Nevertheless, there are several potential challenges that Alice may encounter. First, the logs that are provided in the bug report may be incomplete or low quality [12]. Second, Bob may have provided a portion of the logs that is irrelevant to the bug. Third, Alice may need to spend a large amount of time to analyze tons of files just to locate where the logs were generated. Finally, Alice needs to go through a manual-intensive process of studying the source code and acting like a detective to connect the logs to understand the execution.
A number of prior studies aim to debug or reproduce bugs using system execution information [2, 3, 4, 5, 6]. However, these prior approaches often assume that developers have access to the entire system-generated logs or instrumented system runtime data. Such debugging data may not always be available to developers. In many cases, developers need to rely on data in bug reports for debugging, which may be incomplete or inaccurate [12]. In this thesis, we conduct a tool-assisted study to understand the advantages and challenges of analyzing user-provided logs for debugging. In particular, we seek to answer the two following research questions:
RQ1: To what extent can user-provided logs be used to re-construct execution paths? RQ2: How many additional buggy classes can the re-constructed execution paths identify?
Our findings provide an insight on leveraging readily-available information in bug reports to assist developers with debugging, and provide a deeper understanding of the reasons and potential
solutions to the challenges that developers may encounter when analyzing user-provided logs in bug reports.
CHAPTER
4
Collecting Bug Reports
I
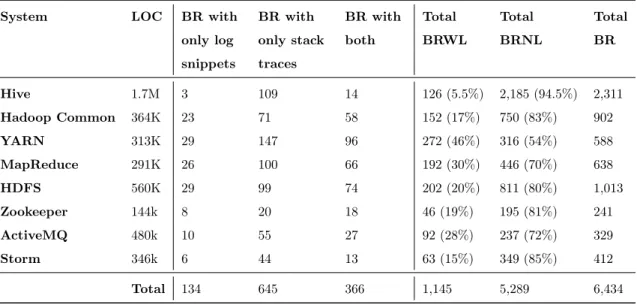
n this chapter, we first describe the studied systems. Then, we present the steps of collectingand processing bug reports that contain logs in the studied systems. After analyzing 6,434 bug reports, we find that there is a non-negligible number (an average of 22.6%) of bug reports that contain logs.Table 1: An overview of the studied systems. BR represents bug reports; BRNL represents bug
reports with no logs;BRWLrepresents bug reports with logs (i.e., either contain log snippets, stack
traces, or both).
System LOC BR with BR with BR with Total Total Total
only log only stack both BRWL BRNL BR
snippets traces Hive 1.7M 3 109 14 126 (5.5%) 2,185 (94.5%) 2,311 Hadoop Common 364K 23 71 58 152 (17%) 750 (83%) 902 YARN 313K 29 147 96 272 (46%) 316 (54%) 588 MapReduce 291K 26 100 66 192 (30%) 446 (70%) 638 HDFS 560K 29 99 74 202 (20%) 811 (80%) 1,013 Zookeeper 144k 8 20 18 46 (19%) 195 (81%) 241 ActiveMQ 480k 10 55 27 92 (28%) 237 (72%) 329 Storm 346k 6 44 13 63 (15%) 349 (85%) 412 Total 134 645 366 1,145 5,289 6,434
4.1
Studied Systems.
Table 1 shows an overview of the studied systems. We conduct our case study on eight Java-based open source systems: Hadoop Common, YARN, MapReduce, HDFS, ZooKeeper, ActiveMQ, Hive, and Storm. These studied systems are widely used in prior log-related studies [15, 16, 17]. We choose these systems because they are large in scale, actively maintained, well-documented, and have many bug reports that contain logs [15, 16]. These systems cover different domains, varying from virtual machine deployment systems to data warehousing solutions.
4.2
Collecting and Filtering Bug Reports.
We collect all the bug report data available on the Jira repositories [48] of the studied systems and compute the lines of code (LOC) on the master branch (data collected in January 2019). To collect the bug reports, we built a web crawler that sends REST API calls to the Jira repositories. We select the bug reports based on the criteria that are used in a prior study on bug reports with logs [17]. Namely, we select “Resolved” or “Fixed” bug reports of the type “Bug” with the priority
marked as“Major”or above. Finally, we filter out the bug reports that do not have a corresponding
code commit (i.e., a bug fix) in the source code repository. At the end of this step, we collected a total of 6,434 bug reports.
4.3
Identifying Bug Reports that Contain Logs
In this thesis, we consider two types of user-provided logs: log snippetsandstack traces. We refer log snippets as the system-generated logs and refer stack traces as the reported messages in stack
frames (e.g., in the case of exception). These two types of logs are often the only information that is available for debugging production problems [3, 28, 49]. A log snippet is composed of consecutive log messages generated at runtime. Log messages often contain a static message, values for dynamic variables, and the log verbosity level (e.g., info, warning, or error). An example log message is:
“2018-08-29 15:37:47.891 Utils [INFO] Interrupted while waiting for fencing command: cd”, where
it shows the timestamp of when the event happened, the executed class (i.e., Utils), the log level (i.e., INFO), and the log message. Note that such log messages usually contain system execution information and may not always be an indication of an error [3, 11]. The second type of logs is the system generated exception message and stack trace. Stack traces show the stack frame of the system when exceptions occur. Similar to a prior study [15], we use regular expression to identify both types of logs in the bug reports. We describe our log extraction process in detail in Chapter 5. In general, we find that there is a non-negligible number (an average of 22.6%) of bug reports that contain logs (i.e., either log snippets, stack traces, or both). Table 1 shows the number of bug reports in the studied systems. In total, we find that 1,145 bug reports contain logs and 5,289 bug reports do not contain any logs. We observe that 5.5% to 46% of the bug reports contain at least one type of logs, which indicates that logs are often attached by reporters to help debug problems. In addition, reporters are more likely to include stack traces in a bug report compared to log snippets. One possible reason is that stack traces are more straightforward to interpret (e.g., with clear exception messages and stack traces); whereas the information in the log snippets may vary depending on how reporters attach the logs and how developers write the logging statements in the source code [3, 4, 16]. However, many bug reports still contain both log snippets and stack traces, which shows that both types of logs are commonly provided in bug reports to help debugging.
CHAPTER
5
Our Approach to Study User-Provided Logs in Bug Reports
I
n this chapter, we present our approach into three steps. Figure 1 shows an overview of ourapproach and Figure 2 shows a running example. First, our approach extracts both types of logs (i.e., log snippets and stack traces) from bug reports. Second, we locate the logs in bug reports to their corresponding locations in the source code. We call the first two steps direct log mapping,since these two steps simulate how developers locate the logs to the source code. Finally, once the logs are located in the source code, we use static analysis to analyze the code and re-construct the system execution path based on the user-provided logs. Our approach simulates the debugging process of developers in practice, to understand to what extent can the user-provided logs assist developers with debugging. More specifically, in RQ1, we study to what extent user-provided logs can be used to reconstruct execution paths. In RQ2, we study how many additional buggy classes can the re-constructed paths identify compared to our baseline – direct log mapping.
5.1
Step 1: Extracting Logs from Bug Reports.
We follow a similar approach proposed by Chenet al.[15] to extract logs from bug reports. Since
the studied systems use specific logging conventions on the structure of the log snippets (e.g., ordered as timestamps, verbosity level, class name, and message), we use regular expressions to capture the log snippets and exception stack traces in bug reports. Specifically, we look for log snippets by extracting lines that contain timestamps and log-related keywords (e.g.,info, debug, anderror).
We look for stack traces in a similar fashion by using both keywords (e.g., a line beginning with
“at...”) and line formats (e.g., followed by method invocation, class name, and line number) that are
specific to stack traces. Note that if a bug report contains both log snippets and stack traces, our approach captures and extracts both types of logs. For each log message in log snippets, we extract the following information: verbosity level, class name, and message. Figure 2 shows an example of extracted log messages after removing dynamic information (i.e., values generated by dynamic variables in logging statements): INFODataStorageUpgrading storage /dir/hadoop.
To evaluate the accuracy of our approach, we randomly sampled 50 bug reports and manually examined the extracted logs. All 50 bug reports have correctly identified the logs (i.e., a precision of 100%).
5.1.1
Challenges and Our Solution.
The main challenge of this step is to continuously improve our accuracy in capturing the logs with regular expressions. We have one regular expression for every studied system, as the format differs from one to another. We are able to achieve a 100% precision only after several iterations of our regular expressions.
5.2
Step 2: Locating Extracted Logs in Source Code.
Once we extract the log snippets and/or stack traces from bug reports, the next step is to find their corresponding locations in the source code (i.e., where the logs are generated). We present different strategies applied for log snippets and stack traces in subsections.
We evaluate the accuracy of the matched code snippet by random sampling, and manually studying 50 bug reports. For each bug report, we checked whether every identified code snippet corresponds to its log (i.e., a log message from log snippet or an execution line from stack trace). All 50 bug reports achieve a precision of 100%.
Step 1. Extracting Logs from Bug Reports Step 2. Locating Extracted Logs in Source Code Step 3. Constructing Execution Paths
from Logs Recovered Execution Paths Corresponding Logging Statements in Code Log Snippets & Stack Traces Source Code Bug Reports
RQ1: To what extent can user-provided logs be used to
re-construct execution paths? RQ2: How many additional buggy
classes can the re-constructed execution paths provide?
Our Approach (Chapter 5)
Figure 1: An overview of our approach to study the logs in bug reports.
INFO INFO
2014-07-15 12:55:55:99 INFO org.apache.hadoop.DataStorage: Upgrading storage /dir/hadoop 2014-07-15 12:55:56:00 INFO org.apache.hadoop.DataNode: Setting up storage
...
class DataStorage{ public void doUpgrade(){
log.info("Upgrade storage "+storageLocation); checkVersionUpgradable(); DataNode.initialStorage(); } ... } class DataNode {
public void initialStorage(){ log.info("Setting up storage"); } ... } INFO DataStorage Upgrading storage /dir/hadoop DataStorage.doUpgrade -> DataStorage.checkVersionUpgradable -> DataNode.initiateStorage
Relevance Score Log Template
Location Message 1.0 0.8 DataStorage.doUpgrade BlockStorage.upgrade Upgrading storage + $storageLocation Upgrade storage . . .
Relevance Score Log Template
0.9 DataNode.initiateStorage Setting up storage . . .
Extracting Logs from Bug Report
Locating Extracted Logs in Source Code Generating Log Templates INFO DataNode Setting up storage . . . DataStorage.doUpgrade DataNode.initiateStorage . . .
Bug Report with Logs Source Code
Call Graph Identifying
Logging Statements in Source Code
Re-constructed Execution Path
Re-constructing Execution Path Locating in the Call Graph . . . . . . . . .
Method Declaration: DataStorage.transition
DataStorage.readProperties -> DataStorage.doUpgrade -> DataStorage.checkVersionUpgradable -> DataNode.initiateStorage Extracted Logs Level INFO
Figure 2: An example that shows an overview of our approach to study the logs in bug reports.
5.2.1
Locating log snippets in the code.
To find the location where the system log messages are generated in the source code, we imple-ment a static log parser to analyze log-generating code (i.e., logging stateimple-ments). The log parser uses JavaParser [50] to analyze the abstract syntax tree (AST) and identify all the logging state-ments in the source code. Each logging statement is composed of a verbosity level, static messages, and dynamic variables. As shown in Figure 2, the structure of a logging statement in source code can be: logger.info(“Upgrade storage” + storageLocation);), where“info” defines the verbosity level; “Upgrade storage” is the static message; and storageLocation is the dynamic variable, recorded at runtime. Similar to prior studies [3, 21, 51], we generate log templates by removing dynamic vari-ables in the logging statements. Each log template defines three pieces of information: verbosity level, location, and content of the logging statements. For example, the above-mentioned logging statement would becomeINFO DataStorage.doUpgrade “Upgrade storage”+$storageLocation. Since
the extracted log message obtained from bug reports may contain some text strings generated by the dynamic variables, we also record the positioning of dynamic variables in the log template. Then, by finding the log template that has the highest similarity (i.e., relevance score) with the extracted log message, we can locate where the log message is generated in the source code [3, 21, 51]. To do so, we compare themessageportion of the extracted log message to the one from the log template.
The twomessages should only differ by the dynamic variables generated at runtime. We leverage
an existing implementation of vector space models (i.e., Elasticsearch) to determine the relevance score between them. The higher the relevance score is, the more similar they are. To improve the mapping accuracy, we apply three additional steps to identify the most similar pair of abstracted log message and log template. 1) We select the log template with the highest relevance score. 2) We ensure that if a class name is recorded in the abstracted log message, it must be the same as the class shown in the log template. 3) Finally, we validate the mapped logging statement by checking if all its static texts can be located in the log message, and whether the verbosity levels are consis-tent. For example, as shown in Figure 2, the extracted log “INFO DataStorage Upgrading storage /dir/hadoop” is mapped to the first log template, since the relevance score is 1.0, they contain the
same class information, and contain exactly the same static text.
5.2.2
Locating stack traces in the code.
To find the location of where the stack traces are generated in the source code, we analyze the called methods in the stack trace. Since the executed method information is well-recorded in the stack trace, mapping the trace to the source code is straightforward. We parse the executed methods and the corresponding class in the stack trace. In the case where an executed method cannot be
found in the source code (i.e., from a third party library), we ignore the method call.
5.2.3
Challenges and Our Solution.
Our main challenge occurs in evaluating the precision from the results generated by the vector space model. A prior study [16] shows that the source code might contain duplicated logging statements. In those cases, our vector space model generates an equal relevance score. To improve the mapping accuracy, we add two other steps described above: 1) match the class name if it exists, 2) validate the results by comparing the static texts.
5.3
Step 3: Constructing execution paths from logs.
We use JavaParser [50] to analyze the source code and to build a call graph. We build a call graph based on logs because the information in logs (i.e., both log snippets and stack traces) is sparse and does not provide enough branch coverage information [4, 14]. We build the call graph and re-construct the execution path for every bug report that contains logs (a total of 1,145 bug reports, as shown in Table 1). For each bug report, we analyze the source code in the commit that isprior to the bug fixing commit. The rationale is that the code in such commits are often the latest
code in the software development repository that developers are working on.
Once we build the call graph, we want to re-construct the execution path between the methods that contain the recorded logs. Algorithm 1 shows a pseudo of our implementation. The algorithm takes extracted logs from bug reports and an empty list of sets as input. This list of sets, matched-SetList is later used to record the set of log messages that have already been processed. After
re-constructing the path between logs, it outputs the potential execution paths. First, we initiate two global variables (line 2-3) unmatchedLogsand executionPaths. unmatchedLogsis used to store
the logs that cannot construct a path when placed in thecurrent order of execution. The main idea
is that when traversing the log messages, although it is in sequence, some portions may be generated by a different thread or process. Thus, logs that cannot be matched in the current traversal will be stored in unmatchedLogsfor the next iteration. executionPathsis used to store the re-constructed
execution path. We put the current log at positioniand the next log at positioni+1into a set (line
5-7). Before proceeding to the next step, we check if this set has already been processed (line 8). If so, we skip the current log and proceed to the next one (line 9). Then, the execution paths are derived from the log (line 11). In detail, we traverse the call graph using the Breadth-First-Search (BFS) algorithm in the findPathBetween function (line 11). During this process, we record every
possible path that connects the two targeted logs. If two consecutive logs are identical (i.e., have the same log template), we remove one from the logs (e.g., the logs may be generated in a loop).
Once the execution path is re-constructed, we store it in the local variable path (line 11). If the
execution path isnull(i.e., cannot be re-constructed), the first log is added intounmatchedLogs(line
12-14). If not, it is stored in the global variable executionPaths(line 15-16). In addition, we add
the current set intomatchedSetList to avoid repetitive processing of the same set (line 17). From
there, we check if the loop has reached the last log in our current logs and whetherunmatchedLog
contains some logs (line 20). In such case, it means there are some logs that may not belong to the same thread, then we callfindExecutionPathfunction recursively (line 22) to construct the execution
paths on those logs. Inside this recursive function, all log messages should be grouped into their corresponding thread (based on reachability in the call graph) and return the generated execution paths back tootherPathsvariable. We addotherPathsinto our previously generated execution paths
(line 23). Lastly, we return the global variable executionPaths(line 26).
Note that a path is constructed for each sequential set of logs (e.g., logs belong to the same thread). Thus, after we have obtained the re-constructed execution paths, there may be some duplicated paths due to the looping of some logs generated at runtime by different threads. Therefore, we compare the sequence of method calls inside each generated path and remove the duplicated paths.
5.3.1
Challenges and Our Solution.
The main challenge lays in efficiently processing the call graph for 1,145 bug reports. Each bug report requires a specific version of the studied system. The size of the system varies from 144k to 1.7M LOC. To efficiently transforming systems of such scale, we continously improve our log parser throughout the process. Initially, the largest call graph construction (i.e., the serialized data file size of this call graph is 120 MB) requires up to 15 minutes. This slow processing speed is due to the large memory consumption used by JavaParserFacade, a JavaParser component which is used to resolve the class name for the AST nodes. Our solution is to implement a listener that clears JavaParserFacase’s cache for every one thousand call graph generated. In additional, we configure ParserConfiguration for parsing features that we don’t need. The final processing time for the largest call graph reaches under 8 minutes.
Algorithm 1Execution Paths Re-Construction Algorithm Input: Logs, MatchedSetList (EMPTY list)
Output: Execution Paths
1: procedure findExecutionPath(logs,matchedSetList)
2: initialise unmatchedLogs 3: initialise executionPaths 4: fori=1;i<=logs.lengthdo
5: currentLog = logs.atPosition(i)
6: nextLog = logs.atPosition(i+1)
7: currentSet = Set(currentLog, nextLog) 8: if matchedSetList.contain(currentSet)then
9: continue
10: end if
11: path = findPathBetween(currentLog, nextLog) 12: if path ==nullthen
13: /* unmatchedLogs stores the log messages that cannot construct a path in the current sequence */ 14: unmatchedLogs.add(currentLog) 15: else 16: executionPaths.add(path) 17: matchedSetList.put(currentSet) 18: end if 19: lastLogPos = logs.length-1
20: if i== lastLogPos && !isEmpty(unmatchedLogs)then
21: /* call the function recursively to construct paths on the log messages that cannot construct a path previously */
22: otherPaths = findExecutionPath(unmatchedLogs, matchedSetList) 23: executionPaths.add(otherPaths)
24: end if
25: end for
26: return executionPaths 27: end procedure
CHAPTER
6
Case Study Results
6.1
RQ1: To what extent can user-provided logs be used to
re-construct execution paths?
6.1.1
Motivation.
Due to the increasing popularity of DevOps practices, developers nowadays are in the front-line of solving problems that users encounter. Unlike bugs that are uncovered during development phases, many user-reported bugs are difficult to reproduce and often lack test cases [17, 28, 52]. In such cases, as discussed in Chapter 3 Motivating Example and prior studies [3, 4, 28], developers rely on logs during the debugging process. However, different from analyzing crash reports or instrumented data [2, 3, 4, 5, 6], many of the user-provided logs in bug reports can be incomplete or even inaccurate [12]. Hence, in this RQ, we aim to understand to what extent user-provided logs can be used to re-construct execution paths. If some user-provided logs cannot be used to re-construct execution paths, what are the reasons? The findings of our RQ may inspire future research and provide an initial guideline on helping practitioners attach better logs in bug reports.
6.1.2
Approach.
Since there are over a thousand bug reports that contain logs, it is infeasible to manually study the bug reports and the attached logs. Therefore, we apply the approach that we describe in Chapter 5 to extract the logs from bug reports, locate the extracted logs in source code, and re-construct the execution paths. Then, we examine how many attached logs can be used to re-construct execution paths. We also perform a quantitative study to understand the reasons why logs in some bug reports cannot be used to re-construct execution paths.
6.1.3
Results.
Overall, our approach can re-construct execution paths in 780 out of 1,145 bug reports that contain logs. For the remained 32% (365/1,145) of the studied bug reports, user-provided logs cannot be used to re-construct execution paths. To examine the reason why logs in some bug reports cannot be used to re-construct execution paths, we conduct a manual study on a statistically representative sample of the 365 bug reports. We manually went through each bug report, examined the logs, and studied the source code of the systems. We also studied different versions of the system for each bug report, if necessary, to understand the reason (e.g., the source code that generates the user-provided logs was deleted in a prior version). In total, we manually studied 76 such bug reports (with a confidence level of 95% and a confidence interval of 10%) [53]. During the process, we took notes for
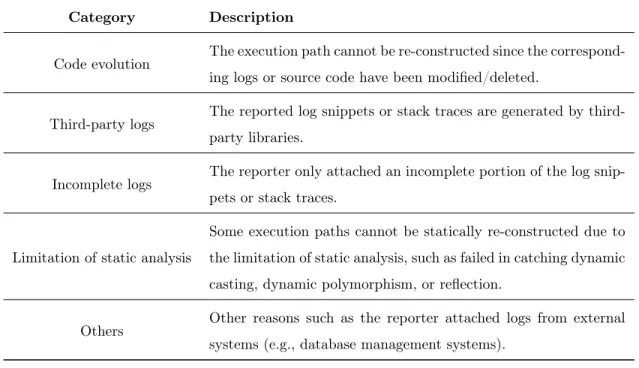
Table 2: Manually-derived categories for which the log snippets/stack traces in a bug report cannot be used to re-construct execution paths.
Category Description
Code evolution The execution path cannot be re-constructed since the correspond-ing logs or source code have been modified/deleted.
Third-party logs The reported log snippets or stack traces are generated by third-party libraries.
Incomplete logs The reporter only attached an incomplete portion of the log snip-pets or stack traces.
Limitation of static analysis
Some execution paths cannot be statically re-constructed due to the limitation of static analysis, such as failed in catching dynamic casting, dynamic polymorphism, or reflection.
Others Other reasons such as the reporter attached logs from external systems (e.g., database management systems).
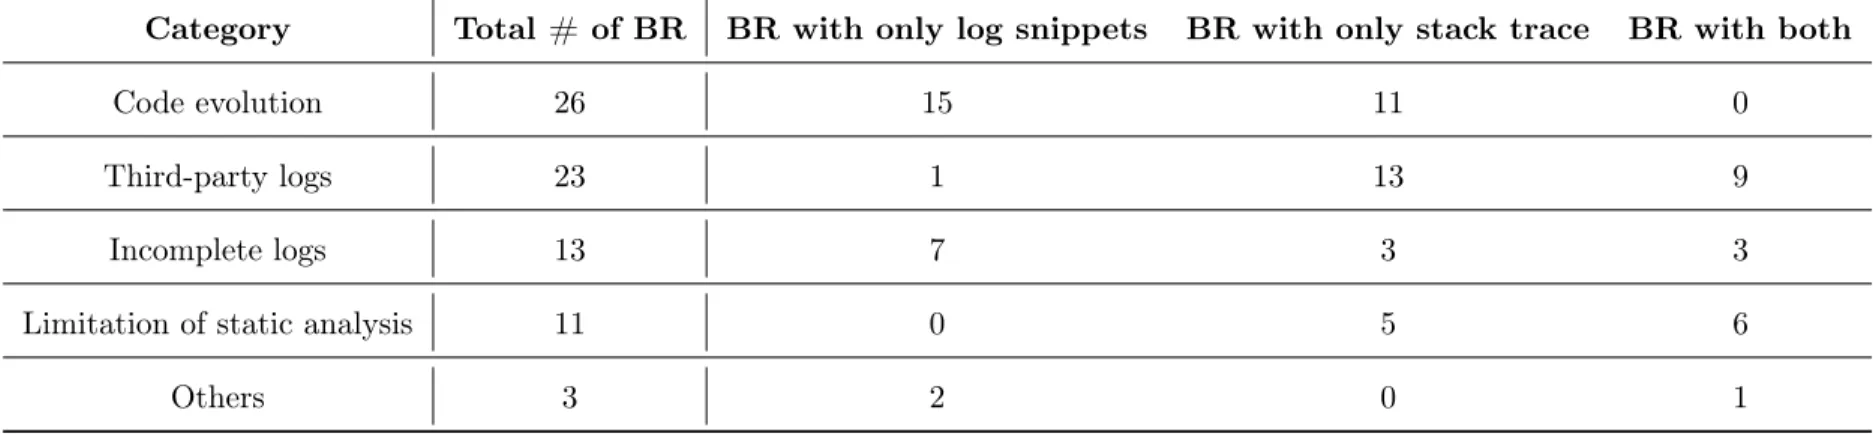
Table 3: Distribution of the manually-derived categories for which the log snippets/stack traces in a bug report cannot be used to re-construct execution paths.
Category Total # of BR BR with only log snippets BR with only stack trace BR with both
Code evolution 26 15 11 0
Third-party logs 23 1 13 9
Incomplete logs 13 7 3 3
Limitation of static analysis 11 0 5 6
Others 3 2 0 1
each bug report. Once the process is completed, we uncovered a list of categories of the causes that prevent re-constructing execution paths using the attached logs. We then revisited the bug reports and assigned the corresponding category to the bug reports. Lastly, we verify the assigned category of each bug reports. Note that each bug report may belong to more than one categories.
Table 2 shows the list of categories that we uncovered, and Table 3 further shows the distribution of the categories. Below, we discuss the finding of each category in more detail.
Code Evolution (26/76). We observe that most of the manually studied bug reports that fail to re-construct execution paths are due to code evolution. This is the most common reason for bug reports that only contain log snippets and no stack traces (15 out of 26). In all the cases that we manually studied, the corresponding logging statements in the source code either no longer exist, are moved to another location, or are deleted. For bug reports that contain only stack traces, the updated source code no longer reflects the same sequence of method calls as the one shown in the stack trace. The reasons are that some methods are no longer invoked by the same method (i.e., the call stack has changed), some are moved to a different location, or some are completely removed from the source code. An example of such category could be found in a HIVE bug report: the reporter attached a log snippet to show that a new SessionState instance was created each time a new connection happens. Then, the developer pointed out that a new connection should no longer create a new SessionState object in the current version. The reporter later confirmed that the attached logs were outdated and no longer reflect the execution path of the current version. Our finding is different from a prior study, where Yuan et al. [14] found that logging statements often
do not get deleted. In our study, we find that code evolution (and especially the deletion of logging statements, which accounts for 11/15 of the studied bug reports with log snippets) may introduce maintenance overheads for developers when they are analyzing logs in bug reports. Future studies should propose approaches to assist developers with logging code migration to minimize the impact when debugging user-reported bugs.
Third-party Logs (23/76). We find that reporters are likely to attach logs that are generated by third-party frameworks. In our manually studied bug reports, 22/23 cases are related to reporters providing stack traces generated by external libraries. In such cases, developers may have diffi-culties analyzing the stack traces when debugging the problem. For instance, a reporter in AMQ attached some third-party stack traces in which an external framework, org.apache.felix, threw an “ClassNotFoundException”:
java.lang.ClassNotFoundException:HandlesTypes not found
atorg.apache.felix.BundleWiringImpl.find(BundleWiringImpl.java:15)
atorg.apache.felix.BundleWiringImpl.access(BundleWiringImpl.java:70) ...
problem occurred in AMQ, which can better assist developers with debugging the issue. Our finding shows that, in some cases, reporters may not have enough knowledge of the systems, so they may not be able to provide the needed logs to diagnose the problem. Future studies on exception handling should help reporters provide debugging information that is relevant to the system (e.g., reporting the failure of the original source code instead of third-part libraries), and help developers diagnose and resolve exceptions that are related to third-party frameworks.
Incomplete Logs (13/76). Sometimes reporters provide incomplete logs in bug reports, which do not contain enough information to re-construct execution paths. In some cases, the reporter was asked to provide more logs to help locate bug fixing locations. In a ZOOKEEPER bug report, the initially attached log snippets only illustrate a repetitive sequence of log snippets showingClientnot
found:
WARNKerberosProtocolHandler - Client not found in Kerberos database
WARNKerberosProtocolHandler - Client not found in Kerberos database ...
However, after the manual study, we noticed that additional stack traces were later provided as
Attachments. The stack traces that appeared to be right after the user-provided logs revealed the
actual cause of the failure, which was due to the failed initialization of an authentication mechanism. In other cases, reporters may attach incomplete logs and point out that the log snippets are confusing and mislead system diagnosis. In short, incomplete log snippets or stack traces provide less or insufficient information to developers/reporters, and may sometimes increase debugging difficulties. Future studies should help developers analyze such incomplete logs by incorporating information from other sources (e.g., past bug report or development history) to better diagnose the reported bugs [18, 21].
Limitation of Static Analysis (11/76). Since we are using static analysis to analyze the logs, we find that we cannot re-construct the execution paths in some studied bug reports due to the limitation of static analysis. All the cases that we studied are related to problems analyzing stack traces. The challenge lies in the dynamic nature of modern programming languages. The following example is extracted from a HDFS bug report. The reporter attached some stack traces in which our approach was able to find these two log lines in the source code (note that the order of the call stack goes from the bottom to the top):
...
atpackagename.FsDatasetImpl.getBlockReports(FsDatasetImpl.java:1599)
atpackagename.BPServiceActor.blockReport(BPServiceActor.java:458) ...
When re-constructing the execution path, our approach did not find any calling relationship between the two called methods (i.e., getBlockReports and blockReport). During our manual study, we find
that these two are connected by an abstract method. One potential way to overcome this issue is to use the line number and the called methods to re-construct the execution path. However, we find that almost all of the reported line numbers in the stack traces cannot be mapped to the corresponding line in the source code. The reason is that reporters may not use the same version of the source code that developers are using. Therefore, when the source code has evolved, the line number no longer matches with the source code, or the method may even be removed. Future studies on debugging using user-provided logs need to take the source code changes into consideration, especially when recovering system execution traces using stack traces.
Others (3/76). There are a few cases that only happen once, so we did not assign them to any of the above-mentioned categories. For example, one reporter attached logs that are related to database access to debug configuration issues in database management systems (e.g., MySQL). In the other case, the reporter attached some log messages that have no static text in the corresponding logging statement; therefore, we could not locate the logging statement in the source code.
The user-provided logs in 32% (365/1,145) of the studied bug reports cannot be used to re-construct execution paths. Our manual study finds some common issues with user-provided logs: 1) many logging statements can no longer be found in the source code due to code evolution; 2) the provided logs may only contain information from third-party libraries; 3) the user-provided logs may be incomplete to show system execution.
6.2
RQ2:
How many additional buggy classes can the
re-constructed execution paths identify?
6.2.1
Motivation.
When debugging user-reported bugs, logs (i.e., either log snippets, stack traces, or both) are usually the only source of information that is available to developers [3, 28, 49]. Developers usually use logs to manually re-construct system execution for debugging and such manual process is time-consuming [1, 3, 14]. Therefore, it is very important to know whether the re-constructed execution path can identify additional buggy classes. Hence, in this RQ, we study if the user-provided logs can be used to give insights to developers in debugging, and, in particular, whether the re-constructed execution paths may identify additional buggy classes.
6.2.2
Approach.
We study how manyadditional buggy classes can the re-constructed execution paths identify to developers. As discussed in the motivating example (Chapter 3), developers often first locate the source code that generates the logs to understand the system execution. Hence, we apply the first two steps of our approach that are described in Chapter 5 to identify logs in bug reports, and locate the source code classes that generate these logs (we call the approach direct log mapping). If there
is an overlap between the bug fixing location (i.e., fixed classes) and source code that generates the logs, we assume that logs can provide debugging support to developers. To collect the list of fixed classes for each bug report, we retrieve the list of commits that is associated with the bug report ID (i.e., collected in Chapter 5) using the git grep command. For each commit, we get the list of changed Java classes using ChangeDistiller [54]. Finally, our goal is to examine if the re-constructed execution paths can identify additional buggy classes (i.e., identifying additional bug fixing locations on the re-constructed execution paths) compared to direct log mapping (i.e., baseline). Hence, we apply the last step of our approach described in Chapter 5 to re-construct the execution paths using user-provided logs. We study if the classes on the re-constructed paths can help developers locate more bug fixing classes.
6.2.3
Results.
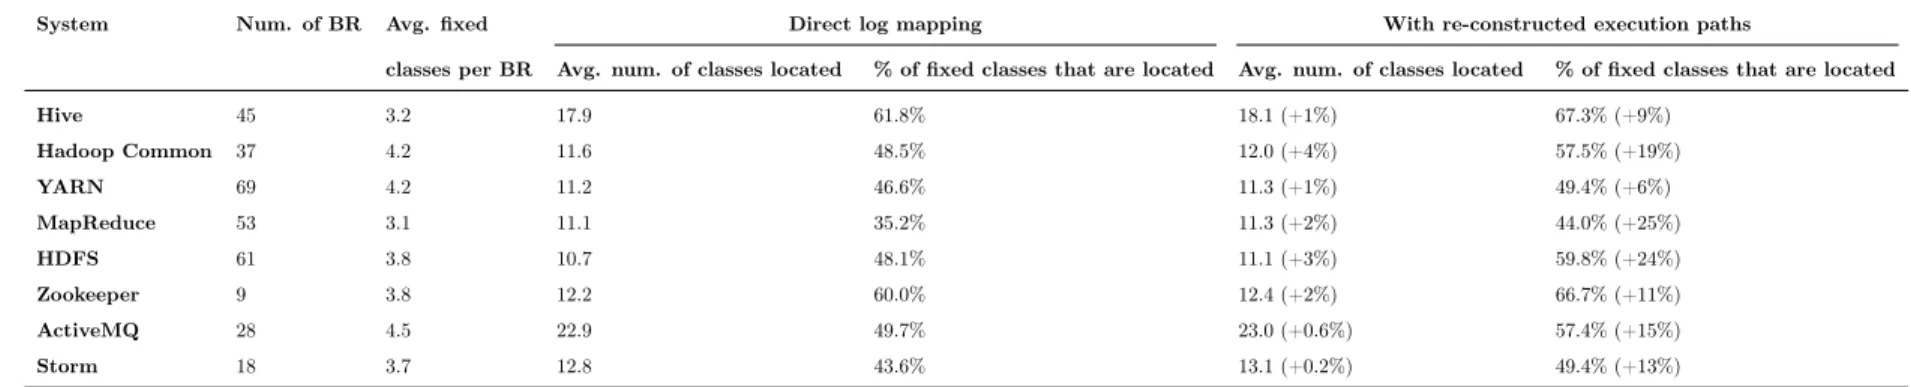
Overall, the re-constructed execution paths can identify additional buggy classes in 320/780 bug reports (compared to direct log mapping). In the first part of this RQ, we report the additional buggy classes that the re-constructed execution paths can provide in these 320 bug reports.
As shown in Table 4, the re-constructed execution paths can identify an additional 6% to 25% (an average of 15%) of buggy classes for developers. In other words, if we provide such execution path information to developers, we may reduce their debugging efforts by showing them the relevant classes. In these 320 cases, the average number of located classes does not increase significantly compared to that of the direct log mapping. On average, using the re-constructed execution paths, we only map to an average of 1.7% additional classes per bug report. In other words, the re-constructed execution paths do not increase the list of classes that developers need to examine for fixing a bug. Moreover, we are able to help developers identify significantly more classes that need to be fixed (i.e., 15% more on average). Prior studies [55, 56, 57] also find that presenting execution paths to developers can help them with code comprehension and debugging.
Table 4: An overview of the bug reports where the bug fixing locations can be identified on the re-constructed execution paths. The numbers are calculated per each bug report.
System Num. of BR Avg. fixed Direct log mapping With re-constructed execution paths
classes per BR Avg. num. of classes located % of fixed classes that are located Avg. num. of classes located % of fixed classes that are located
Hive 45 3.2 17.9 61.8% 18.1 (+1%) 67.3% (+9%) Hadoop Common 37 4.2 11.6 48.5% 12.0 (+4%) 57.5% (+19%) YARN 69 4.2 11.2 46.6% 11.3 (+1%) 49.4% (+6%) MapReduce 53 3.1 11.1 35.2% 11.3 (+2%) 44.0% (+25%) HDFS 61 3.8 10.7 48.1% 11.1 (+3%) 59.8% (+24%) Zookeeper 9 3.8 12.2 60.0% 12.4 (+2%) 66.7% (+11%) ActiveMQ 28 4.5 22.9 49.7% 23.0 (+0.6%) 57.4% (+15%) Storm 18 3.7 12.8 43.6% 13.1 (+0.2%) 49.4% (+13%) 31
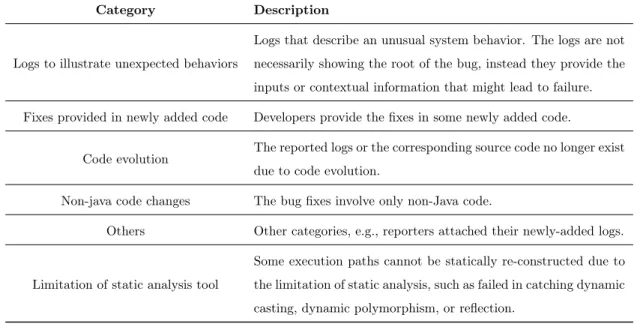
Table 5: Manually-derived categories for bug reports which the fix locations have no overlap with the recovered execution path.
Category Description
Logs to illustrate unexpected behaviors
Logs that describe an unusual system behavior. The logs are not necessarily showing the root of the bug, instead they provide the inputs or contextual information that might lead to failure. Fixes provided in newly added code Developers provide the fixes in some newly added code.
Code evolution The reported logs or the corresponding source code no longer exist due to code evolution.
Non-java code changes The bug fixes involve only non-Java code.
Others Other categories, e.g., reporters attached their newly-added logs. Limitation of static analysis tool
Some execution paths cannot be statically re-constructed due to the limitation of static analysis, such as failed in catching dynamic casting, dynamic polymorphism, or reflection.
The re-constructed execution paths identify additional buggy classes in only 320/780 (41%) of the bug reports for which the execution paths can be re-constructed. In these 320 bug reports, the re-constructed execution paths can help to identify 15% more buggy classes.
6.2.4
Discussion.
We find that the re-constructed execution paths can help the debugging process by identifying more buggy classes in some, but not all, bug reports. Therefore, we further manually investigate the reasons. The author of the thesis manually studied a statistically representative sample of such bug reports. In total, we studied 240 out of 460 such bug reports (with a confidence level of 95% and a confidence interval of 5%) [53]. We studied the bug reports, the attached logs, the bug fixes, source code classes, and the development history (e.g., prior commits). We took notes while studying each bug report. At the end of the process, we uncovered a list of categories for which the re-constructed execution paths cannot identify additional buggy classes. We then revisited and assigned each bug report with the uncovered categories. Note that each bug report may belong to more than one category. In total, we uncovered six categories. Table 5 shows the categories that we uncovered from our manual study. Below, we discuss each category in detail.
studied bug reports attach related logs to the bug, but the logs (and the re-constructed execution paths) do not have an overlap with the bug fixing locations. In all the cases that we manually studied, the logs are reported to illustrate an unexpected behavior. The majority (153/157) of the cases are related to stack traces. As stack traces are used to provide debugging information at the point of failure, the bug introducing location (i.e., the cause of the bug) may not fall into the execution path of the stack traces. As an example, a reporter reported a bug in AMQ and attached the stack trace for a NullPointerException. The stack trace is used to illustrate that the state of the variable isnull(i.e., where the exception happens), but the essential problem of this failure occurs in a prior class (i.e., a database helper), which did not check fornullvalues in the variable. Our finding indicates that reporters often only attach debugging information for the point of failure (e.g., stack traces). Although such information is helpful, reporters may consider attaching additional logs for developers to understand the system execution and the causes of the problem.
Fixes provided in newly added code (31/240). We find that sometimes developers might add new code to fix the bug. For example, a bug in YARN is caused by the ApplicationMaster object
which failed to register the client token in the transition process. This registration responsibility was first assigned to theClientToAMTokenSecretManagerInRM class, which was on our re-constructed
execution path. However, when fixing the bug, the developer added a new method in another class (i.e., RMAppAttemptImpl.registerClientToken) and used a different method to register the client
token. In short, developers may add new code in a class other than the one illustrated on the re-constructed execution path when fixing bugs.
Code evolution (12/240). We find that sometimes the source code that generates the logs no longer exists. In other words, the logs that the reporters provide are from an older version of the system. The log or the source code class may have been removed during evolution. In such cases, developers may have additional challenges in understanding and fixing the bug. Our finding highlights that version information is essential for a high-quality bug report. Therefore, reports are strongly suggested to include version information of the buggy system when submitting a bug report. Future studies should also help developers analyze such bug reports by taking the past development history (e.g., prior source code changes) into consideration.
Non-java code changes (11/240). We find that the fixes for some bug reports are located in non-Java code. For example, in 6/11 cases, the bug fixing changes only happen in XML configurations to add missing dependencies.
Others (11/240). There are a few other reasons where the bug fixing locations cannot be located in the re-constructed execution paths. For instance, in a HDFS bug report, the reporter already provided a fix to the bug and attached newly-added logs to illustrate what the correct behavior of the system should be. Hence, the provided logs cannot be used to re-construct execution paths in
the developers’ version of the source code.
Limitation of static analysis tool (18/240). We find that some execution paths cannot be statically re-constructed due to the limitation of static analysis, such as failed in catching dynamic casting, dynamic polymorphism, or reflection.
Our manual study also finds that user-provided logs are often attached to show only the unex-pected behavior without additional logs to assist debugging. Developers also often add new code to fix the bugs, so the re-constructed execution paths cannot directly locate buggy classes.
6.3
Highlights and Implications of the Findings
More research and supports are needed for logging code evolution. In our manual study
in both RQs, we find that many user-provided logs (i.e., either stack traces, log snippets, or both) can no longer be found in the version that developers are working on. Different from a prior study [14], we found that many logging statements or methods in stack traces are removed from the source code. If developers are not familiar with the system, such logging code changes can cause additional challenges during debugging. Future studies should consider analyzing software development history and help developers locate the user-provided logs, for which the corresponding logging statements/methods were deleted or moved. In addition, for reporters, it is essential to provide the version information of the system when reporting a bug.
Reporters need additional assistance on providing logs in bug reports. Although logs
pro-vide important debugging information for developers, reporters may not be able to propro-vide accurate logs that can illustrate the problem. For example, we find that reporters may attach incomplete logs or logs that only illustrate the exception. Hence, future studies should also consider helping reporters provide more accurate logs that can better assist debugging. One potential way is to apply the approach that is described in this thesis to analyze reporters’ logs, and automatically identify logs that are related to the system execution, which eventually lead to unexpected behaviors or failures.
Future studies may consider using execution paths that are re-constructed from readily-available runtime data to identify the buggy classes. We find that, even though the quality of
user-provided logs may not be perfect, the re-constructed executions still identify additional buggy classes in many bug reports. Our finding highlights a potential direction that may further assist developers with identifying buggy classes. For example, future studies may leverage other readily-available runtime data (e.g., sampled execution traces or other types of logs) to help developers understand the system execution.
6.4
Threats to Validity
6.4.1
External Validity.
To increase the generalizability of our study, we conduct our case study on eight large-scale open source systems that vary in size and infrastructures (i.e, data warehouse, realtime computation system, distributed file system). These systems are actively maintained and widely used. Although all the systems are Java-based, our approach does not limit to Java systems. We present our approach in a generic way that can easily be adapted to fit other programming language (e.g., by changing the AST parser). Future studies may extend and validate our approaches on systems implemented in other programming languages