Improved method for predicting protein fold
patterns with ensemble classifiers
W. Chen1, X. Liu1,3,4, Y. Huang2, Y. Jiang1, Q. Zou1 and C. Lin1 1School of Information Science and Technology, Xiamen University, Xiamen, Fujian, China
2Animal Science and Technology College,
Henan University of Science and Technology, Luoyang, Henan, China 3Shenzhen Research Institute, Xiamen University, Shenzhen, Guangzhou, China
4Key Laboratory of Advanced Design and Intelligent Computing, Dalian University, Ministry of Education, Dalian, China
Corresponding author: C. Lin E-mail: [email protected]
Genet. Mol. Res. 11 (1): 174-181 (2012) Received August 5, 2011
Accepted January 6, 2012 Published January 27, 2012
DOI http://dx.doi.org/10.4238/2012.January.27.4
ABSTRACT. Protein folding is recognized as a critical problem in
the field of biophysics in the 21st century. Predicting protein-folding
patterns is challenging due to the complex structure of proteins. In
an attempt to solve this problem, we employed ensemble classifiers
to improve prediction accuracy. In our experiments, 188-dimensional features were extracted based on the composition and physical-chemical property of proteins and 20-dimensional features were selected using
a coupled position-specific scoring matrix. Compared with traditional
prediction methods, these methods were superior in terms of prediction accuracy. The 188-dimensional feature-based method achieved 71.2%
accuracy in five cross-validations. The accuracy rose to 77% when we
used a 20-dimensional feature vector. These methods were used on recent data, with 54.2% accuracy. Source codes and dataset, together with web server and software tools for prediction, are available at: http://datamining.xmu.edu.cn/main/~cwc/ProteinPredict.html.
Key words: Protein folding pattern; Ensemble classifier;
INTRODUCTION
Proteomics has garnered more interest than genomics in the post-genomic era. Protein is an essential component in cells. Protein structure prediction and functional analysis are al-ways the cores of bioinformatics research topics, and functional analysis alal-ways relies on
struc-ture prediction. However, it is difficult, costly, and not always feasible for all the proteins to
obtain a tertiary structure through experimental means, and the accuracy of secondary structure prediction has, for a long time, been at a bottleneck. Folding pattern prediction falls somewhere in the middle of secondary structure prediction and tertiary structure prediction, which are directly related to function analysis. Therefore, increasing the accuracy of folding pattern pre-diction is essential. Studies have shown that the development of new drugs (Vendruscolo and
Dobson, 2005), cancer research (Honda et al., 2005), and human immunodeficiency virus thera
-pies (Boisvert et al., 2008) all require accurate prediction of associated protein folding patterns. Although nuclear magnetic resonance is a powerful technique for determining mem-brane protein structures (Call et al., 2006; Douglas et al., 2007; Schnell and Chou, 2008), it requires expensive equipment and as much or more time than other methods. Homology modeling techniques (Chou, 2004), which are intended to develop decent models and provide structural information in a timely manner, have been widely used in drug design (Gao et al., 2007; Li et al., 2007). A hurdle occurs, however, when the query protein has no homologous protein of known structure in the existing databases.
Shen and Chou (2006) resorted to a taxonomic approach with underpinning based on the assumption that the number of protein folds is limited. Their study established a pre-diction web server called PFP-Pred, but its overall success rate on a stringent benchmark dataset (Ding and Dubchak, 2001) was just 62%. Two additional predictors have since been developed with success rates of 61.1% (Nanni, 2006) and 68.4% (Chen and Kurgan, 2007). In 2009, a predictor called PFP-FunDSeqE (Shen and Chou, 2009) implemented an approach that combines functional domain and sequential evolution information through a fusion
en-semble classifier; the success rate reached 70.5%. However, the dimensionality of the feather
space was relatively high. Ding and Dubchak (2001) proposed 125 feathers, and Shen and Chou (2006) proposed 283, but only 313 training samples and 385 testing samples were used in the experimental evaluation. Although it has relatively high accuracy, PFP-FunDSeqE is time-consuming and presents challenges when dealing with large amounts of data. To solve these problems, we propose two kinds of feature extraction methods, of which one is designed for accuracy and the other to work quickly and maintain robust performance. Then, the
ensem-ble learning method is used to improve performance for multi-class classification proensem-blems.
MATERIAL AND METHODS
Dataset
We chose two datasets for the experiments. One was the latest data in the SCOP database (Murzin et al., 1995) and the other was the same dataset as that in the PFP-Pred and PFP-FunDSeqE databases, which contain 311 proteins for training and 383 proteins for testing. None of the proteins in the testing dataset has more than 35% sequence similarity to those in the training dataset. According to the SCOP database these proteins can be further
categorized into the following 27-fold types: 1) globin-like, 2) cytochrome c, 3) DNA-bind-ing 3-helical bundle, 4) 4-helical up-and-down bundle, 5) 4-helical cytokines, 6) EF-hand, 7) immunoglobulin-like, 8) cupredoxins, 9) viral coat and capsid proteins, 10) concanavalin A-like lectin/glucanases, 11) SH3-A-like barrel, 12) oligonucleotide/oligosaccharide-binding-fold,
13) β-trefoil, 14) trypsin-like serine proteases, 15) lipocalins, 16) triosephosphate isomerase
barrel, 17) flavin adenine dinucleotide(also nicotinamide adenine dinucleotide-binding
mo-tif), 18) flavodoxin-like, 19) nicotinamide adenine dinucleotide phosphate-binding Rossmann
fold, 20) P-loop, 21) thioredoxin-like, 22) ribonuclease H-like motif, 23) hydrolases, 24)
peri-plasmic binding protein-like, 25) β-grasp, 26) ferredoxin-like, and 27) small inhibitors, toxins, and lectins. Of these fold types, types 1-6 belong to the α structural class, types 7-15 to the β class, types 16-24 to the α/β class, and types 25-27 to the α+β class.
Feature extraction method
Feature extraction methods for protein sequence, which are important in the machine learning method for protein or structure function prediction, can be divided into two
catego-ries: one is calculated from a position-specific scoring matrix (PSSM; Schaffer et al., 2001;
Pu et al., 2007), and the other is extracted from amino acid composition-position or physical-chemical properties. Because PSSM needs to be computed from the Basic Local Alignment Search Tool (BLAST) result, it is more a time-consuming method than extraction from amino acid properties.
We used both feature extraction methods in our study. We extracted the same 188 composition-position and physical-chemical property features as those of SVMProt (Cai et al., 2003), including hydrophobicity, normalized van der Waals volume, polarity, polarizabil-ity, charge, surface tension, secondary structure, and solvent accessibilpolarizabil-ity, which are proven to work well for protein function prediction. We also calculated 20 features based on a PSSM as follows.
For every site in the given protein sequence, we calculated the possibility of replac-ing it with 20 types of amino acids from the Swiss-Prot database. We performed a BLAST analysis (blastpgp program) and put the resulting sequence into the Swiss-Prot database to get the PSSM. Then, we computed the average replaced possibility for all 20 amino acids and for
the final 20 features.
Ensemble classification method
Studies have shown that choosing the appropriate ensemble classifiers can improve the accuracy of prediction in weak classification problems. In addition, the base classifier dif -ferentiation also helps to improve the performance of voting systems. We demonstrate an
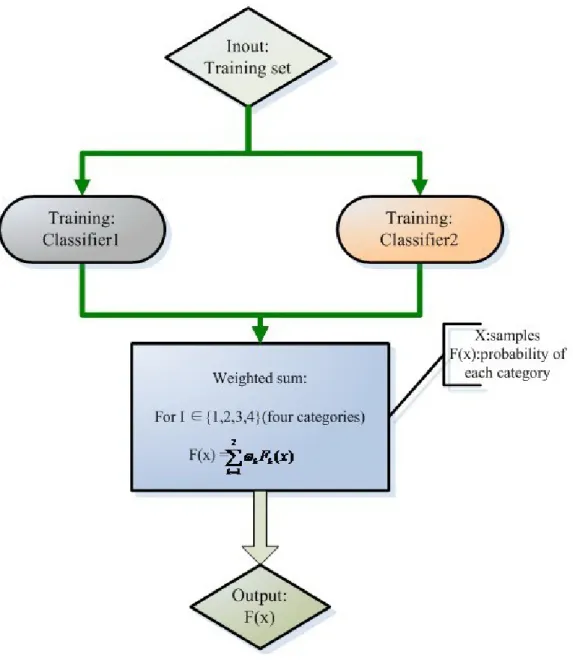
en-semble with two base classifiers that performs better in individual prediction. Because protein fold pattern prediction is a multi-class classification problem, the final result depends on the sum of the probabilities of the individual base classifiers.
Given the special nature of the data, we used various classifiers to achieve better
results. We selected logistic model trees (LMT; Niels et al., 2005) and random forests (RF;
Breimin, 2001) as base classifiers in 188-dimensional (D) experiments. For the 20-D experi
In ensemble classifiers in general, binary classification can use the vote strategy to predict the final result. However, this strategy is unsuitable for multi-class classifica-tion. In this study, we used the strategy of probability weighting. Each basic classifier predicts the test sample and outputs the probability of each class. The final result of the ensemble classifier indicates the class with the highest sum of probability. The flow is shown in Figure 1.
RESULTS
Comparison with related studies
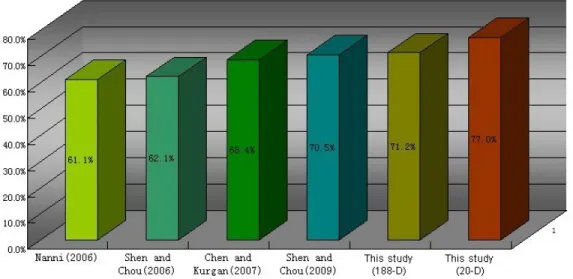
Many researchers have published related studies, and we performed tests on the same benchmark dataset (Nanni, 2006; Chen and Kurgan, 2007; Shen and Chou, 2006, 2009). The highest prediction accuracy rate of the other studies is only 70.5% (Shen and Chou, 2009). In our study, the accuracy of the 188-D feature was 71.2% and rose to 77% when the PSSM method was used. This rate is much higher than that reported in other studies. The comparison is shown in Figure 2.
Figure 2. Comparison of six protein fold pattern recognition methods.
First, we extracted 188-D features for every protein in our dataset, including the
train-ing and testtrain-ing sets; then, we predicted the whole dataset with each classifier ustrain-ing 5-fold cross-validation. The classifiers that performed well were chosen to build our ensemble clas
-sifier. Our previous experiments had shown that naive Bayes, RF, SimpleLogistic, and LMT have a relatively high accuracy in our prediction. We tried 2 and 3 classifiers to compose an
ensemble classifier. We achieved the highest accuracy when LMT and RF were chosen as ba
-sic classifiers; accuracy of the 2-classifier ensemble classifier reached 71.2%. Meanwhile, the 3-classifier ensemble classifier performed at an accuracy of no more than 70.5%. Hence, the ensemble classifier of LMT and RF outperformed others in our experiment, and it also worked well with regard to time and efficiency.
For the 20-D features, we extracted features for each sequences and used a method
similar to that outlined above with 5-fold cross-validation to select basic classifiers for the
ensemble. In this experiment, functional trees (FT), RF, SimpleLogistic, and LMT performed
-sifier consisted of SimpleLogistic and RF and reached 77% accuracy, which was an improve
-ment compared with that of the 188-D features. The best accuracy for the 3-classifier ensemble classifier was 75.9%.
Performance on different classifiers
Compared with other studies, the performance of our features proved their
valid-ity. Therefore, we tried to prove the superiority of our ensemble classifier. To show that the selected base classifiers in the classification are good choices, we performed a 5-fold cross-validation on the entire dataset with different classifiers. Their performance on 4-fold
patterns with the same 188-D features is shown in Table 1, whereas the performance with
20-D features is shown in Table 2. We compared our ensemble classifier with commonly used classifiers, including RF, decision tree (J48), naive Bayes, and K nearest neighbor (IB1), among others. Our experiments showed that the establishment of the ensemble classifiers was
accurate and effective.
Classifiers all-α all-β α/β α+β
Precision Recall AUC Precision Recall AUC Precision Recall AUC Precision Recall AUC SMO 0.604 0.593 0.795 0.703 0.651 0.789 0.725 0.826 0.848 0.654 0.515 0.852 SimpleLogistic 0.659 0.537 0.859 0.736 0.716 0.844 0.748 0.852 0.893 0.633 0.576 0.895 RF 0.636 0.519 0.803 0.556 0.679 0.726 0.711 0.748 0.857 0.625 0.627 0.795 J48 0.511 0.444 0.695 0.512 0.578 0.668 0.658 0.652 0.76 0.593 0.485 0.792 NB 0.4 0.333 0.702 0.646 0.468 0.757 0.616 0.809 0.869 0.5 0.545 0.859 IB1 0.545 0.222 0.592 0.634 0.413 0.642 0.49 0.896 0.675 0.625 0.152 0.57 Our ensemble classifier 0.737 0.519 0.74 0.726 0.78 0.811 0.741 0.87 0.845 0.81 0.515 0.75 SMO = sequential minimal optimization; RF = random forests; J48 = decision tree; NB = naive Bayes; IB1 = K nearest neighbor.
Table 1. Performance of different classifiers on protein fold pattern recognition (188-D features).
Performance on the latest data
We updated the data and retested our method. The former dataset has 311 proteins
in the training dataset and 383 proteins in the testing dataset. The latest data contain 1067 α structural proteins, 1034 β structural proteins, 1471 α/β proteins, and 1588 α+β proteins (data
from SCOP, August 20, 2011). Some protein sequences were not found in the Universal
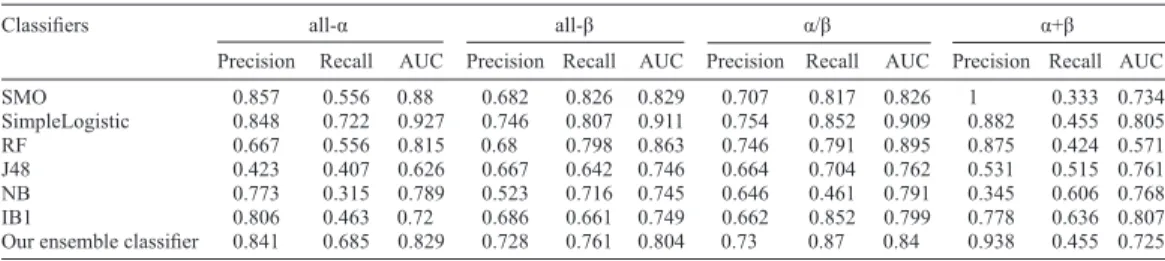
Pro-Classifiers all-α all-β α/β α+β
Precision Recall AUC Precision Recall AUC Precision Recall AUC Precision Recall AUC SMO 0.857 0.556 0.88 0.682 0.826 0.829 0.707 0.817 0.826 1 0.333 0.734 SimpleLogistic 0.848 0.722 0.927 0.746 0.807 0.911 0.754 0.852 0.909 0.882 0.455 0.805 RF 0.667 0.556 0.815 0.68 0.798 0.863 0.746 0.791 0.895 0.875 0.424 0.571 J48 0.423 0.407 0.626 0.667 0.642 0.746 0.664 0.704 0.762 0.531 0.515 0.761 NB 0.773 0.315 0.789 0.523 0.716 0.745 0.646 0.461 0.791 0.345 0.606 0.768 IB1 0.806 0.463 0.72 0.686 0.661 0.749 0.662 0.852 0.799 0.778 0.636 0.807 Our ensemble classifier 0.841 0.685 0.829 0.728 0.761 0.804 0.73 0.87 0.84 0.938 0.455 0.725 For abbreviations, see legend to Table 1.
tein Database, so they were removed, leaving 711 α structural proteins, 695 β proteins, 929 α/β proteins, and 973 α+β proteins in our training set Φ.
β α β α β α
∪
Φ
∪
Φ
∪
Φ
+Φ
=
Φ
/ (Equation 1) We used the PSSM method to process the dataset, and classification via regression and sequential minimal optimization (SMO) was then selected to combine the ensemble classifier. The final accuracy reached 54.2% with 5-fold cross-validation.DISCUSSION
We extracted 20- and 188-D features from protein sequences using composition-po-sition and physical-chemical properties. The performance of the 20-D features was more ac-curate, whereas the extraction of the 188-D features was much faster. The results show that our
method is feasible and greatly improves the efficiency of prediction.
An ensemble classifier is used to solve the protein fold recognition. Experiments show that this method achieved very good results. Compared with other identification methods, the ensemble classifier has many advantages, including short running time, features coming from
only the test sequence, and better accuracy. Meanwhile, we have developed an online server and a software tool that can be downloaded and run on a personal computer. The open source soft-ware can be accessed for free at http://datamining.xmu.edu.cn/main/~cwc/ProteinPredict.html.
ACKNOWLEDGMENTS
Research supported by the Natural Science Foundation of China (#61001013, #61102136 and #60971085), and the Natural Science Foundation of Fujian Province of China (#2011J05158 and #2010J01350), the Base Research Project of Shenzhen Bureau of Science, Technology and Information (#JC201006030858A), the Opening Fund of Key Laboratory of Image Processing and Intelligent Control, Ministry of Education (#200905), and the Opening Fund of Advanced Design and Intelligent Computing (Dalian University), Ministry of Education.
REFERENCES
Boisvert S, Marchand M, Laviolette F and Corbeil J (2008). HIV-1 coreceptor usage prediction without multiple alignments: an application of string kernels. Retrovirology 5: 110.
Breimin L (2001). Random forests. Machine Learn. 45: 5-32.
Cai CZ, Han LY, Ji ZL, Chen X, et al. (2003). SVM-Prot: Web-based support vector machine software for functional
classification of a protein from its primary sequence. Nucleic Acids Res. 31: 3692-3697.
Call ME, Schnell JR, Xu C, Lutz RA, et al. (2006). The structure of the zetazeta transmembrane dimer reveals features essential for its assembly with the T cell receptor. Cell 127: 355-368.
Chen K and Kurgan L (2007). PFRES: protein fold classification by using evolutionary information and predicted
secondary structure. Bioinformatics 23: 2843-2850.
Chou KC (2004). Structural bioinformatics and its impact to biomedical science. Curr. Med. Chem. 11: 2105-2134. Ding CHQ and Dubchak I (2001). Multi-class protein fold recognition using support vector machines and neural networks.
Bioinformatics 17: 349-358.
Douglas SM, Chou JJ and Shih WM (2007). DNA-nanotube-induced alignment of membrane proteins for NMR structure determination. Proc. Natl. Acad. Sci. U. S. A. 104: 6644-6648.
Med. Chem. 3: 221-226.
Honda M, Kawai H, Shirota Y, Yamashita T, et al. (2005). cDNA microarray analysis of autoimmune hepatitis, primary biliary cirrhosis and consecutive disease manifestation. J. Autoimmun. 25: 133-140.
Li Y, Wei DQ, Gao WN, Gao H, et al. (2007). Computational approach to drug design for oxazolidinones as antibacterial agents. Med. Chem. 3: 576-582.
Murzin AG, Brenner SE, Hubbard T and Chothia C (1995). SCOP: a structural classification of proteins database for the
investigation of sequences and structures. J. Mol. Biol. 247: 536-540.
Nanni L (2006). A novel ensemble of classifiers for protein fold recognition. Neurocomputing 69: 2434-2437. Niels L, Mark H and Eibe F (2005). Logistic model trees. Machine Learn 95: 161-205.
Pu X, Guo J, Leung H and Lin Y (2007). Prediction of membrane protein types from sequences and position-specific
scoring matrices. J. Theor. Biol. 247: 259-265.
Schaffer AA, Aravind L, Madden TL, Shavirin S, et al. (2001). Improving the accuracy of PSI-BLAST protein database
searches with composition-based statistics and other refinements. Nucleic Acids Res. 29: 2994-3005.
Schnell JR and Chou JJ (2008). Structure and mechanism of the M2 proton channel of influenza A virus. Nature 451: 591-595.
Shen HB and Chou KC (2006). Ensemble classifier for protein fold pattern recognition. Bioinformatics 22: 1717-1722. Shen HB and Chou KC (2009). Predicting protein fold pattern with functional domain and sequential evolution information.
J. Theor. Biol. 256: 441-446.
Sumner M, Frank E and Hall MA (2005). Speeding up Logistic Model Tree Induction. In: Proceedings of 9th European Conference on Principles and Practice of Knowledge Discovery in Databases, Porto, Portugal (Jorge A, ed.). Springer, Germany, 675-683.