No. 2006–111
THE LONG-TERM OPERATING PERFORMANCE OF
EUROPEAN MERGERS AND ACQUISITIONS
By Marina Martynova, Sjoerd Oosting, Luc Renneboog
November 2006
The long-term operating performance
of European mergers and acquisitions
Marina Martynova
The University of Sheffield Management School
Sjoerd Oosting
Tilburg University and Luc Renneboog
Tilburg University and European Corporate Governance Institute (ECGI)
Forthcoming in: International Mergers and Acquisitions Activity since 1990: Quantitative Analysis and Recent Research, G. Gregoriou and L. Renneboog (eds.), Massachusetts: Elsevier, 2007.
Abstract: We investigate the long-term profitability of corporate takeovers of which both the acquiring and target companies are from Continental Europe or the UK. We employ four different measures of operating performance that allow us to overcome a number of measurement limitations of the previous literature, which yielded inconsistent conclusions. Both acquiring and target companies significantly outperform the median peers in their industry prior to the takeovers, but the raw profitability of the combined firm decreases significantly following the takeover. However, this decrease becomes insignificant after we control for the performance of the peer companies which are chosen in order to control for industry, size and pre-event performance. None of the takeover characteristics (such as means of payment, geographical scope, and industry-relatedness) explain the post-acquisition operating performance. Still, we find an economically significant difference in the long-term performance of hostile versus friendly takeovers, and of tender offers versus negotiated deals: the performance deteriorates following hostile bids and tender offers. The acquirer’s leverage prior takeover seems to have no impact on the post-merger performance of the combined firm, whereas the acquirer’s cash holdings are negatively related to performance. This suggests that companies with excessive cash holdings suffer from free cash flow problems and are more likely to make poor acquisitions. Acquisitions of relatively large targets result in better profitability of the combined firm subsequent to the takeover, whereas acquisitions of a small target lead to a profitability decline.
JEL codes: G34
Key words: takeovers, mergers and acquisitions, long-term operating performance, diversification, hostile takeovers, means of payment, cross-border acquisitions, private target
Acknowledgments: We acknowledge support from Rolf Visser for allowing us to use the databases of Deloitte Corporate Finance. We are grateful for valuable comments from Hans Degryse, Julian Franks, Marc Goergen, Steven Ongena, and Peter Szilagyi, as well as from the participants to seminars at Tilburg University. Luc Renneboog is grateful to the Netherlands Organization for Scientific Research for a replacement subsidy of the programme ‘Shifts in Governance’; the authors also gratefully acknowledge support from the European Commission via the ‘New Modes of Governance’-project (NEWGOV) led by the European University Institute in Florence; contract nr. CIT1-CT-2004-506392.
Contact details:
Marina Martynova: The University of Sheffield Management School, 9 Mappin Street, S1 4DT Sheffield, UK; Tel: +44 (0) 114 222 3344; Fax: +44 (0) 114 222; Email: M.Martynova@sheffield.ac.uk
Corresponding author: Luc Renneboog: Tilburg University, PO Box 90153, 5000 LE Tilburg, The Netherlands, Tel: + 31 13 466 8210; Fax: + 31 13 466 2875; Email: Luc.Renneboog@uvt.nl
1.
Introduction
During the last decade, mergers and acquisitions (M&As) involving European companies have occurred in unprecedented numbers. In 1999, the total value of the intra-European M&A activity has peaked at a record level of USD 1.4 trillion (Thomson Financial Securities Data) and for the first time became as large as that of the US market for corporate control. Despite these developments, empirical research on M&A activity remains mostly confined to the UK and US and there is little known about the effect of Continental European takeovers on the operating performance of bidding and target firms.
In this paper, we investigate whether and to what extend European companies improve their profitability subsequent to the completion of takeover transactions. The research question is appealing for the following three reasons. First, empirical evidence on the post-acquisition performance of European firms is virtually non-existent. To our best knowledge, the literature in this field comprises only two studies: Mueller (1980) and Gugler et al. (2003). Our study contributes to this literature by updating their evidence for the sample of the most recent European M&As and by checking the robustness of the results using an up-to-date methodology of measuring the improvement or decreases in post-merger operating performance. Second, even for the US, research on the improvement of post-merger operating performance is rather limited and its conclusions are contradictory. Whereas some studies document a significant improvement in operating performance following acquisitions (Healy et al., 1992; Heron and Lie, 2002; Rahman and Limmack, 2004), others reveal a significant decline in post-acquisition operating performance (Kruse et al., 2002; Yeh and Hoshino, 2001; Clark and Ofek, 1994). Furthermore, there are a number of studies that demonstrate insignificant changes in the post-merger operating performance (Ghosh, 2001; Moeller and Schlingemann, 2004; Sharma and Ho, 2002). A third reason for this study is that we intend to investigate the determinants of the changes in post-merger profitability of bidding and target firms. In particular, we test whether characteristics of the M&A transaction such as the means of payment, deal hostility, and industry relatedness have an impact on the long-term performance of the merged firm.
Our analysis is based on a sample of 155 European mergers and acquisitions, completed between 1997 and 2001. We employ four different measures of operating performance: EBITDA and EBITDA corrected for changes in working capital, each scaled by the book value of assets and by sales. Our results can be summarized as follows. First, we find that the post-merger
profitability of the combined firm is not significantly different from the aggregate performance of the bidding and target firms prior to the merger. This demonstrates that corporate takeovers are not able to engender substantial augmentations in operating performance as is often claimed by the merged company, but also that mergers and acquisitions do not generate poor performance as was often claimed in earlier academic research. Still, we find that the post-acquisition performance of the combined firm significantly varies across M&As with different characteristics: hostile versus friendly bids, tender offers versus negotiated deals, and domestic versus cross-border transactions. Furthermore, cash reserves of the acquiring firm prior to the bid and the relative size of the target firm are important determinants of the post-acquisition profitability. Consistent with previous US studies, we find no differences in operating performance of industry-related and diversifying takeovers and deals that involve different means of payment.
The outline of this paper is as follows. Section 2 provides an overview of the prior studies on post-acquisition performance. Section 3 describes our sample selection procedure and methodology used to measure changes in operating performance. The characteristics of our final sample are also given in section 3. Section 4 presents the main results of our analysis regarding changes in the operating performance of bidding and target firms subsequent to takeovers. Section 5 investigates the determinants of the post-acquisition performance. Section 6 summarizes the results and concludes.
2.
Prior research
2.1 Post-acquisition performance
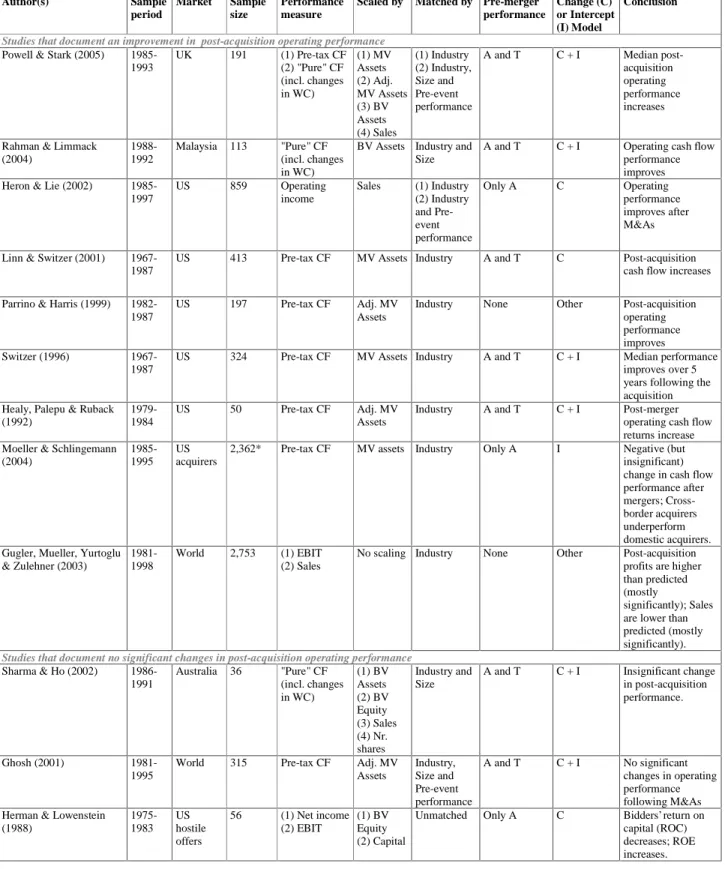
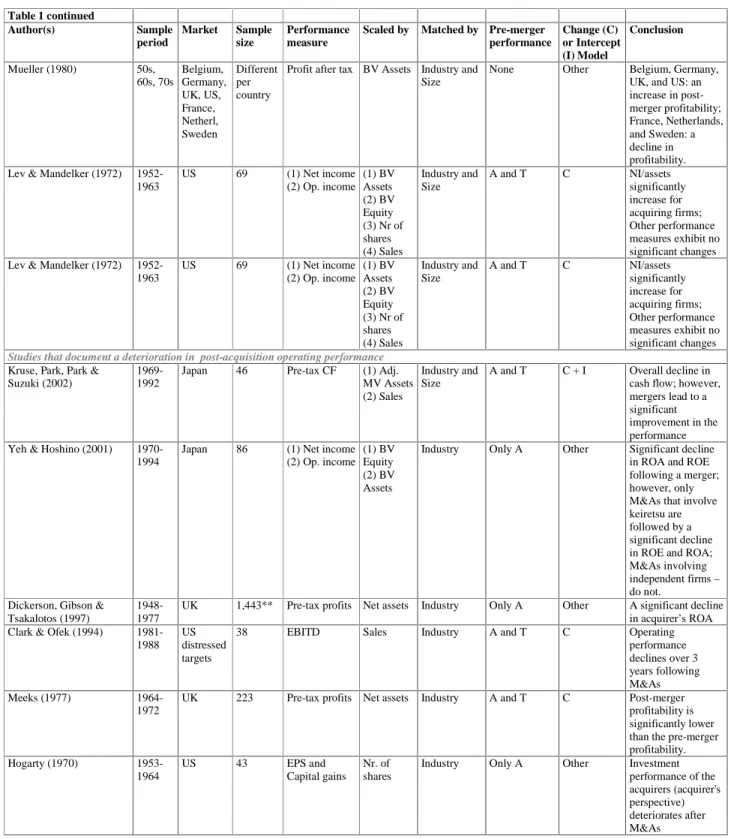
Previous empirical studies yield inconsistent results about changes in operating performance following corporate acquisitions. The existent empirical studies can be evenly divided into three groups: studies that report a significant improvement in the post-acquisition performance, those that document a significant deterioration, and those that find insignificant changes in performance. Table 1 provides an overview of these studies. The most recent US studies that employ more sophisticated techniques to measure changes in the post-merger performance tend to show that the profitability of the bidding and target firms remain unchanged (Moeller and Schlingemann, 2004; Ghosh, 2001) or significantly improves after the takeover (Heron and Lie, 2002; Linn and Switzer, 2001). The conclusion of UK studies are more contradictory, as Dickerson et al. (1997) find a significant decline in the post-acquisition performance, whereas
Powell and Stark (2005) show a significant growth. Similarly to the UK studies, Asian studies also yield contradictory results. Evidence suggest that Japanese M&As incur a decrease in post-acquisition operating performance of the merged firm (Kruse et al., 2002; Yeh and Hoshino, 2001), Malaysian takeovers are associated with better post-acquisition performance (Rahman and Limmack, 2004), while Australian M&As lead to insignificant changes in the profitability of bidding and target firms after the takeover (Sharma and Ho, 2002). For Continental Europe, Gugler, Mueller, Yurtoglu and Zulehner (2003) document a significant decline in post-acquisition sales of the combined firm, but an insignificant increase in post-post-acquisition profit.
[INSERT TABLE 1 ABOUT HERE]
2.2 The determinants of the post-acquisition performance
Method of payment: cash versus stock
Empirical evidence suggests that the means of payment is an important determinant of the long-term post-acquisition performance: cash offers are associated with stronger improvements than takeovers involving other forms of payment (Linn and Switzer, 2001; Ghosh, 2001; Moeller and Schlingemann, 2004). A possible explanation is that cash deals are more likely to lead to the replacement of (underperforming) target management, which could result into performance improvement (Denis and Denis, 1995; Ghosh and Ruland, 1998; Parrino and Harris, 1999). An alternative explanation is that a cash payment is frequently financed with debt (Ghosh and Jain, 2000; Martynova and Renneboog, 2006). Debt financing restricts the availability of corporate funds at the managers’ disposal and hence minimizes the scope for free cash flow problems (Jensen and Meckling, 1976). As such, takeovers paid with cash are more likely to bring about more managerial discipline. However, the empirical literature does not finds a significant relationship between the method of payment and post-merger operating performance (Healy et al., 1992; Powell and Stark, 2005; Heron and Lie, 2002; Sharma and Ho, 2002).
Deal atmosphere: friendly versus hostile
Hostility in corporate takeovers may be associated with better long-term operating performance of the merged company. The reason is that hostile bids are more expensive for the bidding firms, such that only takeovers that have high synergy potential are likely to succeed (Burkart and Panunzi, 2006). However, the empirical literature finds no evidence in support of this conjecture (Healy et al., 1992; Ghosh, 2001; and Powell and Stark, 2005). The acquisition method (a tender offer or a negotiated deal) may also be an important determinant of the post-merger performance.
Likewise, the empirical evidence does not unveil any such relation (Switzer, 1996; Linn and Switzer, 2001; Heron and Lie, 2002; Moeller and Schlingemann, 2003).
The acquirer’s leverage and cash reserves
The activities of highly leveraged acquirers may be subject to severe monitoring by banks such that unprofitable M&As would be effectively prevented ex-ante. Empirical evidence on this relationship is mixed: whereas Ghosh and Jain (2000), Kang, Shivdasani and Yamada (2000), and Harford (1999) provide evidence in line with the conjecture1, Linn and Switzer (2001), Switzer (1996), and Clark and Ofek (1994) find no significant relation between acquirer’s leverage and post-merger operating performance.
As follows from Jensen’s (1986) free cash flow theory, acquirers with excessive cash holdings are more likely to make poor acquisitions and hence experience significant post-merger underperformance relative to their peers who had more limited cash holdings. Empirical evidence by Harford (1999) and Moeller and Schlingemann (2004) confirms this conjecture.
Industry relatedness: focused versus diversifying acquisitions
Although diversifying (or conglomerate) acquisitions are expected to create operational and/or financial synergies, the creation of diversified firms is associated with a number of disadvantages such as rent-seeking behavior by divisional managers (Scharfstein and Stein, 2000), bargaining problems within the firm (Rajan et al., 2000), or bureaucratic rigidity (Shin and Stulz, 1998). These disadvantages of diversification may outweigh the alleged synergies and result in poor post-merger performance of the combined firm. Furthermore, diversifying M&As may be an outgrowth of the agency problems between managers and shareholders (Shleifer and Vishny, 1989), which is also likely to result in the deterioration of corporate performance after the takeover. While earlier studies confirm these conjectures (Healy et al., 1992; Heron and Lie, 2002), later studies find the relationship between diversifying takeovers and poor post-merger performance insignificant (Powell and Stark, 2005; Linn and Switzer, 2001; Switzer, 1996; Sharma and Ho, 2002). Furthermore, Kruse et al. (2002) and Ghosh (2001) document that diversifying acquisitions significantly outperform their industry-related peers.
1
Ghosh and Jain (2000) find that an increase in financial leverage around M&As is significantly positively correlated with the announcement abnormal stock returns. Kang et al (2000) show for 154 Japanese mergers between 1977 and 1993 that the amount of bank debt is positively and significantly related to the acquirer abnormal returns. Harford (1999) shows that cash-rich firms experience negative stock price reactions following acquisition announcements, which is more negative when there are higher amounts of excess cash.
Relative size of the target
Takeovers of relatively large targets are more likely to achieve sizeable operating and financial synergies and economies of scale than small acquisitions, therefore leading to stronger post-acquisition operating performance. However, the acquirer of a relatively large target may face difficulties in integrating the target firm, which could lead to a deterioration of performance. There is empirical evidence in support of both conjectures. Linn and Switzer (2001) and Switzer (1996) provide evidence that acquisitions of relatively large targets outperform those of small targets. Clark and Ofek (1994) document that difficulties with managing a large combined firm outweigh the operating and financial synergies in large acquisitions and result in the deterioration of operating performance. However, most of empirical evidence reports no significant relation between the relative target size and post-merger performance (Powell and Stark, 2005; Moeller and Schlingemann, 2003; Heron and Lie, 2002; Sharma and Ho, 2002; Kruse et al., 2002; Healy et al., 1992).
Domestic versus cross-border deals
In cross-border acquisitions, bidding and target firms are likely to benefit by taking advantage of imperfections in international capital, factor, and product markets (Hymer, 1976), by internalizing the R&D capabilities of target companies (Eun et al., 1996), and by expanding their businesses into new markets (as a response to globalization trends). As such, cross-border acquisitions are expected to outperform their domestic peers. However, regulatory and cultural differences between the bidder and target countries may lead to complications in managing the post-merger process and hence the failure to achieve the anticipated merger synergies. As a result of such difficulties in cross-border bids, the post-merger performance of the combined firm may deteriorate (Schoenberg, 1999). Moeller and Schlingemann (2003), Goergen and Renneboog (2004), Martynova and Renneboog (2006b) show that that firms acquiring foreign targets experience significantly lower takeover announcement returns than their counterparts acquiring domestic targets. Gugler et al. (2003) report a significant effect of cross-border deals on post-acquisition operating performance.
3.
Data and methodology
3.1 Sample selection
Our sample of European acquisitions that were completed between 1997 and 2001 is selected from the Mergers and Acquisitions Database of the Securities Data Company (SDC) and
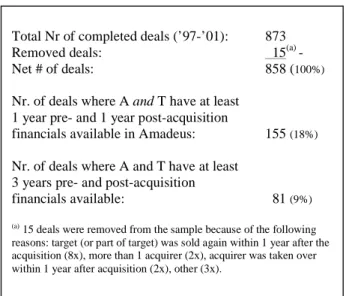
Zephyr.2 Only intra-European domestic and cross-border takeovers are included, in which both the acquirer and the target are from Continental Europe or the UK. We retain the takeover deals in which at least one of the participants is a publicly traded company. We exclude from the sample deals in which the acquirer is the management or the employees, or the target is a subsidiary of another company. Furthermore, we exclude M&As in which either a bidder or a target (or both) are financial institutions (banks, savings banks, unit trusts, mutual funds and pension funds). We also removed 15 takeovers in which the target was re-sold or the acquirer was acquired by a third party within three years after the deal completion. This selection results in 858 European M&A deals (see Table 2).
We further require profit and loss accounts and balance sheet data to be available for acquirers and targets for at least 1 year prior and 1 year after the acquisition. Accounting data is collected from Amadeus Extended database.3 In our analysis, we focus on the year of the transaction’s completion, rather than the year of the announcement of the bid. Our sample includes a number of takeovers for which the year of announcement and year of completion do not coincide. For 89% of deals, a completion date is available. When a completion date is not available, we take the announcement year. Table 2 summarizes the overall sample selection procedure which results in the final sample of 155 deals.
[INSERT TABLE 2 ABOUT HERE]
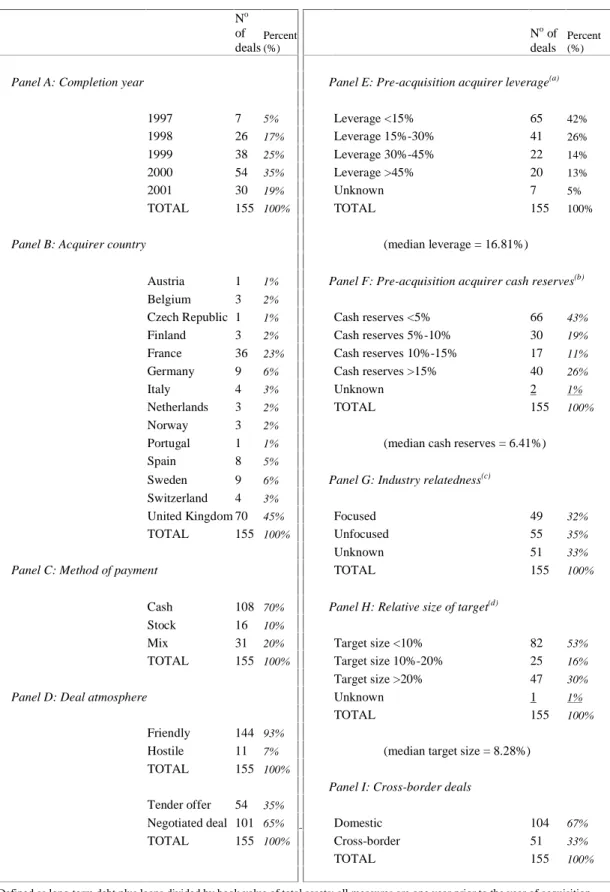
3.2 Sample description
Our final sample of intra-European M&As comprises 155 deals (see Table 3) and includes 144 (93%) friendly and 11 (7%) hostile takeovers, where an acquisition is considered hostile if the board of directors of the target firm rejects the offer, or when there are multiple competing acquirers. All-cash acquisitions account for 70% of the sample, whereas the reminder are mixed (20%) and equity-paid (10%) deals. About one-third of the sample are acquisitions that involve
2
The reason for selecting deals that were launched and completed between 1997 and 2001 is that accounting data for European firms are available in the Amadeus database only from 1995 onwards. For this study, we require that at least 2 years of pre-acquisition accounting data to be available. Therefore, we were forced to restrict our sample only to M&As completed as of 1997. The upper-time bound of our sample is coming from another restriction of Amadeus database: the latest accounting data available in Amadeus refers to 2004. Thus, we were also forced to restrict our sample to M&As completed by 2001, as this allows us to analyse the post-merger operating performance over 3 years after the bid completion.
3
Amadeus Extended is an online database that contains information on 8,600,000 public and private companies in 38 European countries. Initially, we employed Amadeus Standard database which contains 250,000 public and private companies in Europe. However, we find that Amadeus Standard covers only 40% of bidding and target firms from our sample. Using Amadeus Extended, we find data for 73% of our acquirers and targets (624 M&As).
bidding and target firms operating in the same industry, defined based on the 2-digit NACE industry code classification. 4
Most of the acquisitions involve relatively small target companies. The median relative size of the target firm, defined as the ratio of target’s to acquirer’s sales in the year prior to the takeover, does not exceed 9%.5 However, acquisitions of relatively large targets are not rare either: in one-third of our M&As the relative size of the target firm exceeds 20%. The largest transaction in our sample is the mega-acquisition of Mannesmann by Vodafone in 2000, with a deal value of USD 203 billion. Other large transactions are the acquisition of Elf Aquitaine by TotalFina in 1999 (USD 50 billion), the merger between Germany’s Hoechst and France’s Rhone-Poulenc in 1999 (USD 22 billion), and the acquisition of Airtel by Vodafone in 2000 (USD 14 billion). The smallest transaction was the acquisition of C.K. Coffee by Coburg Group in 2001 (both British companies), with deal value of only USD 140,000.
[INSERT TABLE 3 ABOUT HERE]
3.3 Selection of peer companies
To measure changes in operating performance following a takeover, we compare the realized performance with the benchmark performance which would be generated in case the takeover bid would not have taken place. However, while performing this comparison one should take into account that operating performance is not only affected by the takeover but also by a host of other factors. To isolate the takeover effect, the literature suggests an adjustment for the industry trend (see e.g. Healy et al., 1992). Alternatively, one could match the sample of firms involved in M&As by industry, asset size, and a performance measure (typically the market-to-book ratio or EBIT) with non-merging companies (as suggested in Barber and Lyon, 1996), and examine whether merging companies outperform their non-merging peers prior and subsequent to the bid. In our analysis we employ both adjustment methodologies in order to check whether the choice of the adjustment model affects our conclusions.
As a proxy for industry trends, we consider for each bidding and target firm from our sample the performance of a median company that operates in the same industry. The industry median is
4
Changing to a 4-digit NACE classification does not materially change the results in the remainder of our study. In 51 deals (33%), acquirer and/or target had NACE industry code 7415 (‘holding company’), in which case we assumed industry relatedness to be ‘unknown’.
5
When the relative size of the target firm is calculated as the ratio of target’s and acquirer’s book values and of total assets, the median relative size is 8.81%.
identified from the pool of all companies recorded in Amadeus database that have same 4-digit industry code as our sample firm in the year prior to the acquisition. The firm with the median EBITDA-to-assets ratio is then selected as our industry median peer.
The Amadeus database has also been used to identify the industry, size, and performance-matched peer company for each bidder (and each target) from our sample. For each bidding (target) firm, the list of Amadeus companies with the same industry code and available EBITDA-to-Assets ratio has been further filtered down to the list of firms that fall within the same size quartile (as measured by total assets) as the bidding (target) firm. From this list, we select the company with an EBITDA-to-Assets ratio that is closest to the ratio of the analyzed bidder (target). The selected firm makes our industry, size, and performance-matched peer.6 Caution is taken to select peer companies that were not engaged in M&A activity over the period studied.
3.4 Measures of operating performance
Most studies on post-acquisition operating performance define operating performance as ‘pre-tax operating cash flow’, which is the sum of operating income, depreciation, interest expenses, and taxes (see e.g. Healy et al., 1992; Ghosh, 2001; Heron and Lie, 2002; etc.). It is typically argued that such a performance measure is unaffected by either the accounting method employed to compute depreciation or non-operating activities (interest and tax expenses). However, this measure is not a ‘pure’ cash flow performance measure, as it does not take into account changes in working capital (changes in receivables, payables and inventories). In this study, we employ two measures of cash flow: (1) EBITDA-only and (2) EBITDA minus changes in working capital.7 To adjust for the differences in size across companies, we divide these cash flow measures by (1) book value of assets and (2) sales.8 Overall, we consider four following measures of operating performance:
6
Using the ‘Peer Group’-function in Amadeus, it was usually possible to gather an international (European) list of peer companies within the same industry. However, this function returned an error message when the number of peer companies in a specific industry exceeded 500 (this happened often when a company had NACE code 7415 (“holding company”), returning a huge number of industry peers). In that case we downloaded a national list of companies within the same industry, instead of an international list.
7
The number of our observations for cash flow measure (2) is lower than for measure (1), because changes in working capital are not available for several bidders, targets, and/or their peers from our sample.
8
Some U.S. research uses a third variable to scale cash flows: the market value of assets. Market value is insensitive to whether “purchase” or “pooling of interest” accounting is used in acquisitions. Until recently, U.S. companies under U.S. GAAP were free to choose between the “purchase method” and the “pooling of interest method” to account for their acquisitions. In the former method, the acquirer records the target’s assets at their fair value. If the amount paid for a company is greater than fair market value, the difference is reflected as goodwill. The pooling of interests does not require the target’s assets to be recorded at fair value and no goodwill is booked. The problem with
(a) (EBITDA - ¨:&%9assets ,
(b). (EBITDA - ¨:&6DOHV
(c) EBITDA / BVassets and
(d) EBITDA / Sales.
The first measure of operating performance shows how effectively a company is using its assets to generate cash. The second measure shows how much cash is generated for every dollar of sales. The third and fourth measures do not include changes in working capital, but are comparable to the pre-tax cash flow as is used in most of the past empirical research. Figure 1 summarizes our methodology to estimate changes in operating performance following the takeover.
[INSERT FIGURE 1 ABOUT HERE]
Since our analysis focuses on the changes in profitability of the combined firm for the period preceding the takeover, we sum the cash flows of acquirer and target and scale it by the sum of their total assets or sales. That is, we compute the ‘raw’ pre-acquisition profitability of the combined firm as follows:
t T t A t T t A t firm BASE BASE CF CF CF , , , , , + + =
The peer pre-acquisition profitability of the combined firm is then computed as a weighted average of the profitability of the acquirer’s and the target’s peer companies; where the relative size of the acquirer’s and target’s relative asset (sales) are the weights:
+ × + = t peerA t peerA t T t A t A t peer BASE CF BASE BASE BASE CF , , , , , , t peerT t peerT t T t A t T BASE CF BASE BASE BASE , , , , , × +
For the years following the acquisition, the ‘raw’ profitability of the combined firm is the realized cash flow of the merged company scaled by its total assets or sales:
AT AT t firm BASE CF CF , = the use of the market value of assets to scale cash flows is that the market value can hide operating improvements: the market value may already incorporate possible improvements (or declines) in operating performance in the denominator on the day of the takeover announcement. Hence, possible changes in the numerator (cash flows) can be neutralized by the change in the market value of the denominator. Healy et al (1992) solve this problem by excluding the changes in market capitalizations at the merger announcement. However, even after excluding changes in equity value around the announcement, performance may still be biased because acquiring firms’ market values decline systematically over three to five years following acquisitions (Agrawal et al., 1992). Another reason why we did not scale by market value is that the European accounting regulation (IAS) only allows the purchase method of accounting in corporate acquisitions. Finally, in order to be able to use market values we require both acquirer and target to be listed - a requirement that reduces our sample by half.
The peer post-acquisition profitability of the combined firm is calculated in a similar way as for the pre-acquisition years: a weighted average of the profitability of the acquirer’s and target’s peers. However, the weights used to compute the peer post-acquisition profitability of the combined firm are the ones that we also used to compute the peer pre-acquisition profitability. That is, the peer post-acquisition profitability of the combined firm is calculated as follows:
+ × + = − − − t peerA t peerA t T t A t A t peer BASE CF BASE BASE BASE CF , , 1 , 1 , 1 , , t peerT t peerT t T t A t T BASE CF BASE BASE BASE , , 1 , 1 , 1 , × + − − −
A company’s profitability adjusted for industry trend is calculated as a difference between the company’s ‘raw’ and peer profitability:
t peer t firm t adjusted ind CF CF industry
CF − , = , − , and CFind,size,perf−adjusted,t =CFfirm,t −CFpeerind,size,perf−adjusted,t
In order to assess the changes in the profitability of the combined firm caused by the takeover, we employ two following models: the change model and the intercept model. The change model calculates the change in profitability for each firm whereby the median profitability of the 3 years prior to the takeover is compared to the median profitability over the three years subsequent to the merger. With a Wilcoxon signed rank test, we then test whether the median post-acquisition performance is significantly different from the median pre-acquisition performance.9 An analysis of changes in operating performance was also performed using averages (over the three years before and after the acquisition) instead of medians. The results are qualitatively similar and are available upon request.
The intercept model estimates changes in operating performance withWKHLQWHUFHSW 0) from the
following regression: ε α α + ⋅ + = pre adjusted post adjusted medianCF medianCF 0 1
FDFWRU 1 reflects a relation between pre- and post-acquisition profits, whereas changes in
profitability are captured by WKH LQWHUFHSW 0). To test for the significance of the changes we
apply a standard t-test.
4.
Changes in corporate performance caused by M&As: results
4.1 Does operating performance improve following acquisitions?
9
The use of medians has the disadvantage that median differences are sometimes counterintuitive. For example, the post-acquisition performance minus the pre-acquisition performance can be a negative, whereas one would expect a positive difference (e.g. when the median pre-performance is –0.04% and the median post-performance is 0.84%). This is caused by the fact that median differences are not calculated simply by subtracting median pre-performance from median post-performance, but are calculated as the median of the differences.
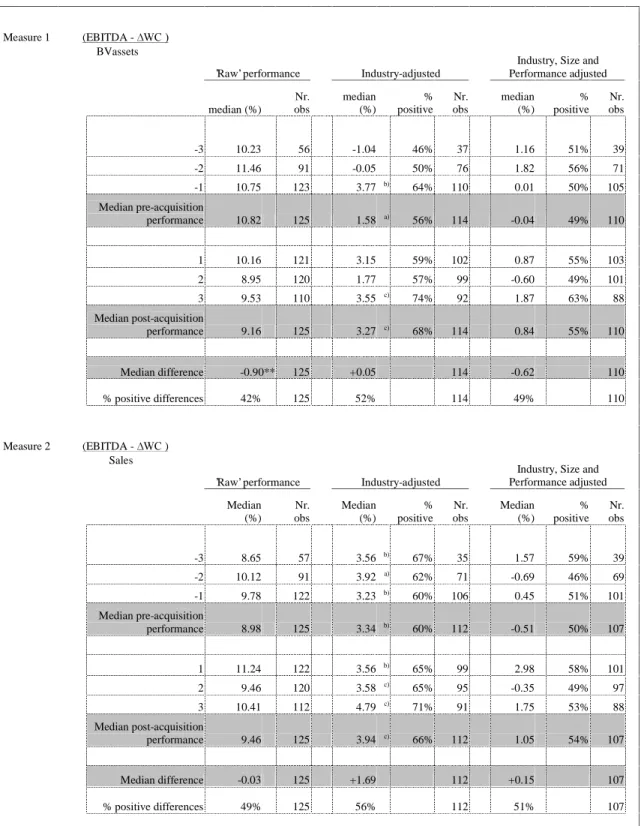
Table 4 exhibits insignificant changes in profitability of the combined firm following the takeover. None of our four performance measures reveal significant changes: measures scaled by book value indicate an insignificant decrease in the performance (-0.01% for measure 3 and – 0.62% for measure 1) while measures scaled by sales point out an insignificant increase (+0.15% for measure 2 and +0.16% for measure 4). The result is in line with the previous empirical studies that document insignificant changes in operation performance following mergers (Mueller, 1980; Sharma and Ho, 2002; and Ghosh, 2001). On the other hand, the result contradicts the findings of a number of other studies showing a significant improvement or deterioration in post-acquisition performance (Kruse et al., 2002; Yeh and Hoshino, 2001; Dickerson et al., 1997; Clark and Ofek, 1994; Rahman and Limmack, 2004). However, this difference in the results may be driven by the fact that none of the previous studies use a pure cash flow measure (which includes changes in working capital). This omission may induce a downward bias in their profitability measures. Furthermore, most of the US studies that find significant increases in cash flow performance, employ market value of assets to scale cash flows (Linn and Switzer, 2001; Parrino and Harris, 1999; Switzer, 1996; Healy et al., 1992), whereas our analysis is based on the book value of assets and sales.
[INSERT TABLE 4 ABOUT HERE]
The comparison of the ‘raw’ performance (without adjusting for the industry) reveals that the post-acquisition cash flow declines substantially, with 3 out of the 4 performance measures showing significant decreases ranging within –0.65% and –1.73% (see Table 4). The result is in line with Powell and Stark (2005), who show that the ‘raw’ operating performance of the combined firm generally deteriorates following UK takeovers.
Another important result presented in Table 4 is that bidding and target companies significantly outperform the median companies in their respective industries prior to the takeover. This suggests that companies undertake corporate acquisitions in periods when they are performing better their median peers in the industry.
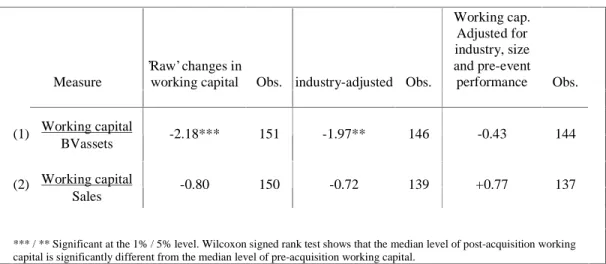
We further investigate whether the inclusion of changes in the working capital into our performance measure has a significant impact on the overall results. Table 5 reports the changes in the use of working capital over the post-acquisition period compared to those over the pre-acquisition period. Our evidence suggests that the use of working capital does not change significantly following the takeover.
[INSERT TABLE 5 ABOUT HERE]
4.2 Robustness checks
In this section, we investigate whether our results are robust with respect to different specifications of the profitability measures. First, we recalculate changes in the operating performance using means rather than medians (see section 3.4). That is, for each combined firm, we calculate mean annual pre- and post-acquisition performance and adjust it to the mean pre- and post-operating performance of the combined peer companies. Expectedly, we find that the results based on means are more volatile than those based on medians because of the influence of outliers. Nonetheless, our initial conclusion remains unchanged, as we find no statistically significant changes in the operating performance following acquisition.
Second, we employ the market value of assets as an alternative scale factor for our cash flow measure, as applied in previous U.S. studies. Following Healy et al (1992), we define the market value of assets as the market capitalization of equity plus the book value of net debt. In some cases, new peers have to be selected, as some original peers are not listed and hence lack market capitalization data. The results indicate that, when the market value is used to scale the performance measures, changes in the operating performance following takeovers are positive.10 However, as none of the changes is significant, our initial conclusion remains unchanged.
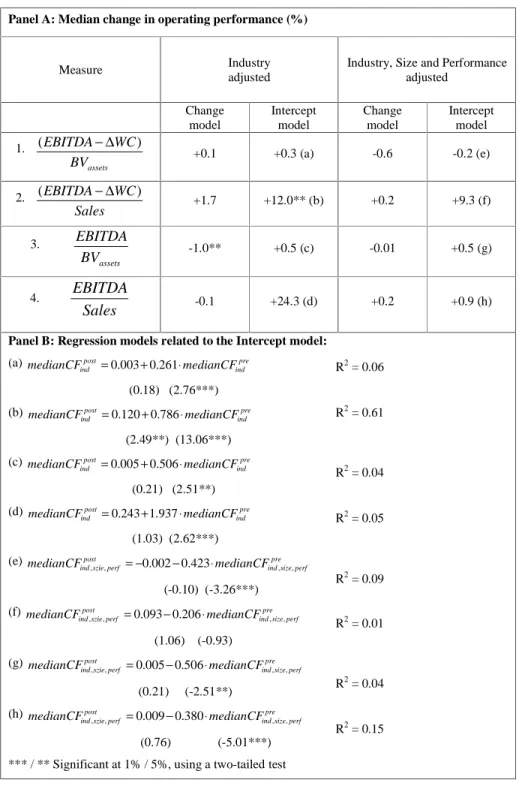
Third, we examine whether the intercept model yields conclusions different from the change model. Panel A of Table 6 exhibits that, consistent with Powell and Stark (2005), Ghosh, (2001), Linn and Switzer (2001), and Switzer (1996), the intercept model gives structurally higher estimates of the performance improvements than the change model. The explanation is that the change model is based on medians and is therefore less sensitive to outliers, whereas the intercept model is based on means. Panel B shows that the slope coefficients are significant in 7 out of 8 regressions, which suggests that the post-acquisition performance is related to pre-acquisition performance. Strikingly, when we adjust operating performance only by industry, we find that high pre-acquisition profitability is associated with higher post-acquisition profitability. However, when the adjustment is made on the basis of industry, size and performance, we observe a significant negative relation: high pre-acquisition profitability is followed by lower post-acquisition results. This highlights the importance of the adjustment approach employed and may explain the contradictory results across many studies.
10
[INSERT TABLE 6 ABOUT HERE]
5.
The determinants of the post-acquisition operating performance
In this section, we investigate whether the characteristics of the takeover deal predict the post-acquisition performance of the combined firm. We test whether post-post-acquisition performance of the merged firm varies across takeovers with different means of payment, degree of hostility, business expansion strategy (focus versus diversification), and geographical scope of the deal (domestic versus cross-border M&As). We also investigate whether the relative size of the target firm and the pre-acquisition leverage and cash holdings of the acquirer influence the post-acquisition performance of the combined firm. Our primarily focus in this section is on the ‘raw’ performance and the performance adjusted for industry, size and pre-event performance.11 Also, we present results only for the profitability measures that are corrected for the changes in working capital: (EBITDA - ¨:&%9assets and (EBITDA - ¨:&6DOHV
5.1 Method of payment: cash versus equity
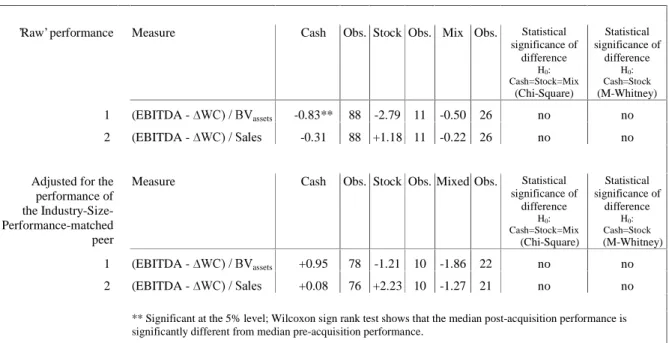
Table 7 shows the post-acquisition performance of the merged firms for the sub-samples of takeovers partitioned by means of payment: all-cash offers, cash-and-equity offers, and all-equity offers. The results presented in the table suggest that there are no significant differences in the profitability of corporate takeovers that employ different methods of payment. The results are in line with previous studies (Healy et al., 1992; Powell and Stark, 2005; Heron and Lie, 2002; Sharma and Ho, 2002).
[INSERT TABLE 7 ABOUT HERE]
5.2 Deal atmosphere: friendly versus hostile takeovers
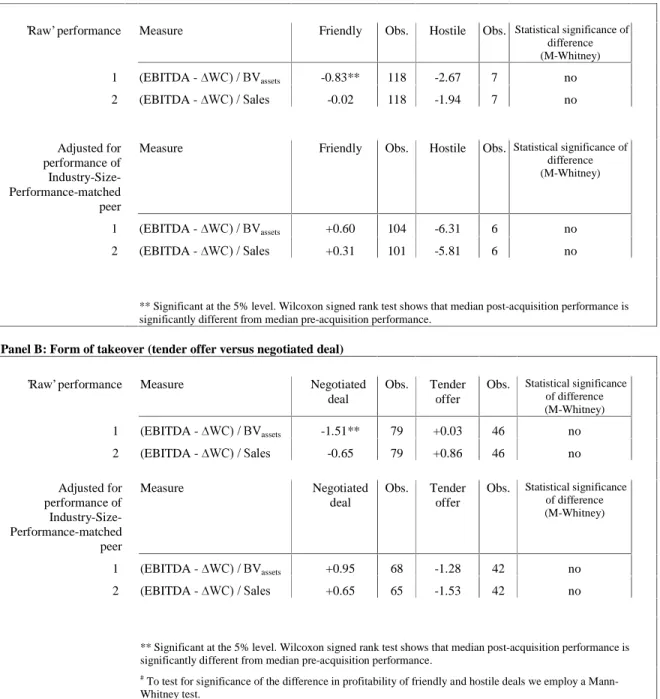
Panel A of Table 8 shows that hostility in corporate takeovers is associated with lower post-merger profitability. However, the effect is not statistically significant. Therefore, we conclude that there is no evidence that hostile takeovers are able to create more (long-term) synergistic value than friendly ones. The result is consistent with previous empirical findings for the US (see e.g. Gregory, 1997; Ghosh, 2001; Louis 2004).
[INSERT TABLE 8 ABOUT HERE]
11
The lack of significant differences in the performance of hostile and friendly offers may be due to the fact that the sample of friendly acquisitions includes a high number of deals conducted in a form of a tender offer, which are almost as expensive as hostile takeovers12. Therefore, we further test whether the form of the acquisition (tender offer versus negotiated deal) has an impact on the post-merger profitability of the combined firm. Panel B of Table 8 reports that the difference in profitability of tender offers and negotiated deals is statistically insignificant. However, the difference seems to be significant in economic terms, as we find that the combined profitability of the bidding and target firms somewhat declines following a tender offer, whereas it increases following a negotiated M&A deal. The overall results are similar to Switzer (1996), Linn and Switzer (2001) and Moeller and Schlingemann (2003), who find no statistical difference in the long-term performance of hostile and friendly acquisitions in the US.
5.3 Pre-acquisition leverage and cash holdings of the acquirer
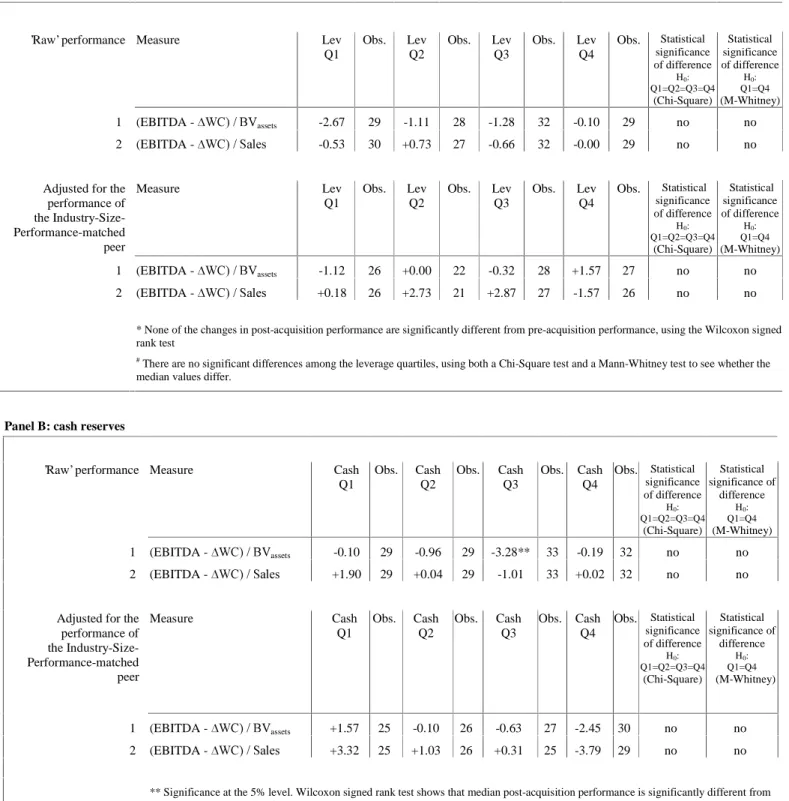
In this section, we investigate whether highly leveraged acquirers outperform low leveraged acquirers due to better creditor monitoring. We divide our sample into quartiles by the acquirers’ pre-acquisition leverage and test for significance of the differences in post-acquisition profitability of the combined firms across the sub-samples. We define leverage as the ratio of the book value of total debt (long-term and short-term debt) to the book value of total assets. 13 Panel A of Table 9 shows that higher levels of pre-acquisition leverage do not lead to higher post-acquisition profitability. Therefore, we conclude that pre-post-acquisition acquirer’s leverage has no impact on the operating performance of the combined firm following the takeover. Likewise, none of the US studies find a significant relation between leverage and post-acquisition operating performance (e.g. Linn and Switzer, 2001; Switzer, 1996; Clark and Ofek, 1994).
[INSERT TABLE 9 ABOUT HERE]
Acquirer’s cash reserves may be another important determinant of the post-acquisition performance of the combined firm, as Jensen’s (1986) free cash flow theory predicts that managers of cash-rich firms are more likely to be involved in poor takeovers. We test this
12
Grossman and Hart (1980) show that small shareholders may hold out their shares in a tender offer until the bidder increases the offer price, hence making tender offers one the most expensive forms of acquisitions.
13
The first quartile sub-sample includes companies with leverage lower than 5.55%; the leverage of companies in the second quartile sub-sample ranges between 5.55% and 16.79%; in the third quartile it is between 16.79% and 32.44%; and in the fourth quartile it is above 32.44%. For 7 acquirers, the pre-acquisition leverage is not available and hence these companies are excluded from the analysis.
conjecture by comparing the post-acquisition profitability of combined companies across the quartiles based on the relative amount of cash reserves held by the acquirer prior to the acquisition. We define an acquirer’s cash reserves as the firm’s cash and cash equivalents scaled by book value of total assets one year prior to the acquisition.14 Panel B of Table 9 shows that, even though none of the changes in post-acquisition profitability are statistically significant, there is a clear trend towards better long-term performance of the takeovers by acquirers with lower cash reserves. Acquirers with the lowest level of cash holdings (first quartile) experience an increase in the post-acquisition profitability by 1.57%, whereas acquirers with the highest level of cash reserves (fourth quartile) experience a decline by 2.46%. The results are in line with the findings of Harford (1999), who shows that acquisitions by cash-rich companies lead to significant deteriorations in the operating performance of the combined firm.
5.4 Industry relatedness: focus versus diversification strategy
A number empirical studies is dedicated to the analysis of whether the relatedness of the merging firms’ businesses is associated with higher post-merger profitability (see e.g. Powell and Stark, 2005; Linn and Switzer, 2001; Switzer, 1996; Sharma and Ho, 2002). There seems to be no significant difference in the post-merger profitability of related and unrelated acquisitions, of takeovers with a focus strategy and diversifying mergers, of horizontal and vertical takeovers, of takeovers that aim at product expansion and those that do not. Similarly to these studies, Table 10 unveils no significant relation between takeover strategy (diversification vs. focus) and the post-acquisition performance of the combined firms.15 We consider an acquisition to be diversifying if the acquiring and target companies operate in unrelated industries as defined by their 2-digit NACE industry classification.16 We conclude that a takeover strategy based on industry-relatedness has no impact on the post-acquisition performance of the combined firm.
[INSERT TABLE 10 ABOUT HERE]
5.5 Relative size of the target
14
The first quartile sub-sample includes companies with cash reserves lower than 2.47% of total assets, the cash reserves of companies in the second quartile sub-sample range between 2.47% and 6.39% of total assets, in the third quartile cash is between 6.39% and 15.37%, and in the fourth quartile it is above 15.37%. For 2 acquirers, the pre-acquisition data on cash reserves are not available and these companies are excluded from the analysis.
15
We exclude 51 M&As from the analysis when either the acquirer or the target (or both) have 7415 (‘holding company’) as NACE industry code or when the NACE code for one of the parties involved in the deal is not available.
16
As a robustness check, we also perform the analysis based on the 4-digit NACE industry code classification. We find that employing a 4-digit industry code does not materially affect the results.
The long-term M&A performance literature yields contradictory conclusions about whether or not the size of the takeover transaction matters for the post-acquisition profitability of the combined firm. To test whether the size matters in European M&As, we partition our sample into two sub-samples by the relative size of the target firm. The sub-sample of ‘large targets’ includes deals that involve target companies with pre-acquisition sales of at least 20% of the sales of their acquirers (44 deals). The rest of takeovers comprises the sub-sample of ‘small target’ transactions (82 deals). Table 11 documents that relatively large takeovers significantly outperform their smaller peers. Combined firms experience an increase in profitability by 3.36% following the acquisition of a relatively large target and a decrease by 1.35% following the takeover of smaller targets. A possible explanation is that larger M&As have a greater scope to explore financial and operating synergies, which is likely to result in a sizable improvement in profitability of the combined firm. When we split our sample into quartiles by the relative size of the target firm, we find that although the post-merger profitability increases with the size, this increase is non-linear. The very large M&As (fourth quartile) tend to be less profitable than the medium-size M&As (third quartile), but only the smallest M&As (first quartile) tend to have a significant negative impact on the operating performance of the combined firms. 17 The result confirms our conjecture that problems of managing a very large newly created firm may outweigh the alleged benefits of the takeover and hence worsen profitability of the combined firm.
[INSERT TABLE 11 ABOUT HERE]
5.6 Domestic versus cross-border deals
Table 12 examines whether the post-acquisition performance evolves differently following domestic and cross-border M&As. Panel A shows that the profitability of the combined firm increases by 0.5% following domestic takeovers and decreases by 1.8% following cross-border deals. Although the difference in the changes in performance is not statistically significant, it is notable in economic terms. We further investigate whether there is a difference in the performance of domestic takeovers across countries. We therefore divide our sample of domestic M&As into three sub-samples: UK, French, and other deals. Panel B of Table 12 presents that a comparison of UK and French M&As yields inconclusive results, as the conclusion depends on the analysed profitability measure. However, none of the performance measures show statistically significant differences in the profitability of UK and French M&As. In contrast, independent of the analysed profitability measure, takeovers undertaken in other European
17
countries systematically outperform their UK and French counterparts (the difference is still not statistically significant). Therefore, we conclude that the profitability of corporate takeovers is similar across all Continental European countries and the UK.
[INSERT TABLES 12 ABOUT HERE]
5.7 Multivariate analysis
Table 13 summarizes the results of our univariate analysis of the determinants of post-merger profitability. In this section, we explore the combined effect of the determinants of the profitability in a multivariate framework. Table 14 reports the results of the OLS regressions for different profitability measures and model specifications. Overall, the regression results are consistent with our univariate analysis findings: none of the takeover characteristics have significant power to explain the post-merger profitability of combined firms.18 The intercept is also insignificant in each regression model regardless of its specification, which suggests that the operating performance does not change significantly following takeovers. Strikingly, there is a systematic negative relationship between pre- and post-acquisition performance: better performance prior to the takeover is associated with poorer performance after the deal’s completion.
[INSERT TABLES 13 and 14 ABOUT HERE]
6.
Summary and conclusions
While numerous research papers have been written on the stock price performance following mergers and acquisitions, the empirical evidence on changes in post-acquisition operating performance is relatively scarce and their conclusions are inconsistent. The differences in the measurement of profitability and in the benchmarking (the choice of the correct peer-companies) is partly responsible for the inconsistency in conclusions across studies. Whilst most of the research focuses on US deals, there is little empirical evidence on the long-term operating performance following European mergers and acquisitions.
In this paper, we investigate the long-term profitability of 155 European corporate takeovers completed between 1997 and 2001, where the acquiring and target companies are from Continental Europe and the UK. We employ four different measures of operating performance that allow us to overcome a number of measurement and statistical limitations of the previous
18
Our results do not change when the multivariate analysis comprises dummies instead of continuous variables for pre-acquisition leverage of the acquiring firm, pre-acquisition cash reserves held by the acquirer and relative target size.
studies and to test whether the conclusions vary across the measures. We find that profitability of the combined firm decreases significantly following the takeover. However, this decrease become insignificant after we control for the performance of the peer companies which are chosen in order to control for industry, size and pre-event performance. This suggest that the decrease is caused by macroeconomic changes unrelated to takeovers. We also find that both acquiring and target companies significantly outperform the median peers in their industry prior to the takeovers. We also reveal that the conclusions regarding changes in post-merger profitability critically depend on the model applied to estimate the changes. Generally, an increase in profitability following M&As is higher when the intercept model is applied, whereas the change model returns lower estimates of the increase in post-acquisition profitability.
Our analysis of the determinants of the post-acquisition operating performance reveals that none of the takeover characteristics such as means of payment, geographical scope, and industry-relatedness have significant explanatory power. However, we find an economically significant difference in the long-term performance of hostile and friendly takeovers, and of tender offers and negotiated deals: the performance deteriorates following hostile bids and tender offers. The acquirer’s leverage prior takeover seems to have no impact on the post-merger performance of the combined firm, whereas its cash holdings are negatively related to the performance. This suggests that companies with excessive cash holdings suffer from free cash flow problems (Jensen, 1986) and are more likely to make poor acquisitions. Acquisitions of relatively large targets result in better profitability of the combined firm subsequent to the takeover, whereas acquisitions of small target lead to the profitability decline.
References
Agrawal, A., Jaffe, J.F. and Mandelker, G.N. (1992). The post-merger performance of acquiring firms: a re-examination of an anomaly. Journal of Finance 47, 1605-1621.
Asquith, P. and Mullins, D.W. (1986). Equity issues and offering dilution. Journal of Financial Economics 15, 61-89.
Barber, B.M. and Lyon, J.D. (1996). Detecting abnormal operating performance: the empirical power and specification of test statistics. Journal of financial Economics 41, 359-399. Bradley, M., A.S. Desai, and E.H. Kim (1988). Synergistic gains from corporate acquisitions and
their division between the stockholders of target and acquiring firms. Journal of Financial Economics 21, 3-40.
Clark, K. and Ofek, E. (1994). Mergers as a means of restructuring distressed firms: an empirical investigation. Journal of Financial and Quantitative Analysis 29, 541-566.
Coffee et al. (Eds.). Knights, raiders and targets. Oxford University Press, New York.
Cornett, M. and Sankar, De (1991). Medium of payment in corporate acquisitions: Evidence from interstate bank mergers. Journal of Money, Credit, and Banking 23, 767.
Denis, D.J. and Denis, D.K. (1995). Performance changes following top management dismissals. The Journal of Finance 50, 1029-1057.
Dickerson, A.P., Gibson, H.D. and Tsakalotos, E. (1997). The impact of acquisitions on company performance: Evidence from a large panel of U.K. firms. Oxford Economic Papers 49, 344-361.
Ghosh, A. (2001). Does operating performance really improve following corporate acquisitions? Journal of Corporate Finance 7, 151-178.
Ghosh, A. and Jain, P.J. (2000). Financial leverage changes associated with corporate mergers. Journal of Corporate Finance 6, 377-402.
Ghosh, A. and Ruland, W. (1998). Managerial ownership, method of payments for acquisitions, and executive job retention. Journal of Finance 53, 785-798.
Goergen, M and Renneboog, L. (2004). Shareholder wealth effects of European domestic and cross-border takeover bids. European Financial Management Journal 10, 9-45.
Gugler, K, Mueller, D.C., Yurtoglu, B.B. and Zulehner, C. (2003). The effects of mergers: an international comparison. International Journal of Industrial Organization 21, 625-653. Harford, J. (1999). Corporate cash reserves and acquisitions. Journal of Finance 54, 1969-1998. Healy, P.J., Palepu, K.G., Ruback, R.S. (1992). Does corporate performance improve after
Herman, E. and Lowenstein, L. (1988). The efficiency effects of hostile takeovers. In: Knights, Raiders and Targets (J.C. Coffee, Jr., L. Lowenstein, and S. Rose-Ackerman, eds.). New York: Oxford University Press, 211-240.
Heron, R and Lie, E. (2002). Operating performance and the method of payment in takeovers. Journal of Financial and Quantitative Analysis 37, 137-156.
Hogarty, T.F. (1970). The profitability of corporate mergers. The Journal of Business 33, 317-327.
Jensen, M.C., 1986. Agency costs of free cash flow, corporate finance, and takeovers. American Economic Review 76, 323–329.
Kang, J.K., Shivdasani, A. and Yamada, T. (2000). The effect of bank relations on investment decisions: an investigation of Japanese takeover bids. Journal of Finance 55, 2197-2218. Kruse, T.A., Park, H.Y., Park, K., Suzuki, K.I. (2002). The value of corporate diversification:
evidence from post-merger performance in Japan. AFA 2003 Washington, DC Meetings. Lev, B. and Mandelker, G. (1972). The microeconomic consequences of corporate mergers. The
Journal of Business 45, 85-104.
Linn, S.C. and Switzer, J.A. (2001). Are cash acquisitions associated with better postcombination operating performance than stock acquisitions? Journal of Banking and Finance 6, 1113-1138.
Loughran, T. and Vijh, A. (1997). Do long term shareholders benefit from corporate acquisitions? The Journal of Finance 52, 1765-1790.
Maloney, M.T., McCormick, R.E. and Mitchell, M.L. (1993). Managerial decision making and capital structure. Journal of Business 66, 189-217
Martynova, M. and Renneboog, L. 2006a. Takeover waves: triggers, performance and motives, Working paper European Corporate Governance Institute.
Martynova, M. and L. Renneboog, 2006b. Mergers and acquisitions in Europe, in L. Renneboog (ed.), Advances in Corporate Finance and Asset Pricing, Amsterdam: Elsevier.
Masulis, R.W. and Korwar, A.N. (1986). Seasoned equity offerings: an empirical investigation. Journal of Financial Economics, 91-118.
Meeks, G. (1977). Disappointing marriage: a study of the gains from merger. Cambridge University Press.
Moeller, S.B. and Schlingemann, F.P. (2004). Are cross-border acquisitions different from domestic acquisitions? Evidence on stock and operating performance for U.S. acquirers. Journal of Banking and Finance.
Mueller, D.C. (ed.) (1980), The determinants and effects of mergers: an international comparison. Cambridge, Mass.: Oelgeschlager, Gunn & Hain.
Parrino, J.D. and Harris, R.S. (1999). Takeovers, management replacement, and post-acquisition operating performance: some evidence from the 1980s. Journal of Applied Corporate Finance 11, 88-97.
Powell, R.G., Stark, A.W. (2005). Does operating performance increase post-takeover for UK takeovers? A comparison of performance measures and benchmarks. Journal of Corporate Finance11, 293-317.
Rahman, R.A. and Limmack, R.J. (2004). Corporate acquisitions and the operating performance of Malaysian companies. Journal of Business Finance & Accounting 31, 359-400.
Ravenscraft, D.J. and Scherer, F.J. (1987). Mergers, selloffs, and economic efficiency. Washington, DC: The Brookings Institution.
Sharma, D.S. and Ho, J. (2002). The impact of acquisitions on operating performance: some Australian evidence. Journal of Business Finance & Accounting 29, 155-200.
Spiess, D.K. and Affleck-Graves, J. (1995). Underperformance in long-run stock returns following seasoned equity offerings. Journal of Financial Economics, 243-267.
Switzer, J.A. (1996). Evidence on real gains in corporate acquisitions. Journal of Economics and Business 48, 443-460.
Yeh, T.M. and Hoshino, Y. (2002). Productivity and operating performance of Japanese merging firms: Keiretsu-related and independent mergers. Japan and the World Economy 14, 347-366.
Table 1: Overview of the empirical studies on post-acquisition operating performance Author(s) Sample period Market Sample size Performance measure
Scaled by Matched by Pre-merger performance
Change (C) or Intercept (I) Model
Conclusion
Studies that document an improvement in post-acquisition operating performance
Powell & Stark (2005)
1985-1993 UK 191 (1) Pre-tax CF (2) "Pure" CF (incl. changes in WC) (1) MV Assets (2) Adj. MV Assets (3) BV Assets (4) Sales (1) Industry (2) Industry, Size and Pre-event performance
A and T C + I Median
post-acquisition operating performance increases
Rahman & Limmack (2004) 1988-1992 Malaysia 113 "Pure" CF (incl. changes in WC)
BV Assets Industry and
Size
A and T C + I Operating cash flow
performance improves
Heron & Lie (2002)
1985-1997 US 859 Operating income Sales (1) Industry (2) Industry and Pre-event performance Only A C Operating performance improves after M&As
Linn & Switzer (2001)
1967-1987
US 413 Pre-tax CF MV Assets Industry A and T C Post-acquisition
cash flow increases
Parrino & Harris (1999) 1982-1987
US 197 Pre-tax CF Adj. MV
Assets
Industry None Other Post-acquisition
operating performance improves
Switzer (1996)
1967-1987
US 324 Pre-tax CF MV Assets Industry A and T C + I Median performance
improves over 5 years following the acquisition Healy, Palepu & Ruback
(1992)
1979-1984
US 50 Pre-tax CF Adj. MV
Assets
Industry A and T C + I Post-merger
operating cash flow returns increase Moeller & Schlingemann
(2004)
1985-1995
US acquirers
2,362* Pre-tax CF MV assets Industry Only A I Negative (but
insignificant) change in cash flow performance after mergers; Cross-border acquirers underperform domestic acquirers. Gugler, Mueller, Yurtoglu
& Zulehner (2003)
1981-1998
World 2,753 (1) EBIT
(2) Sales
No scaling Industry None Other Post-acquisition
profits are higher than predicted (mostly
significantly); Sales are lower than predicted (mostly significantly). Studies that document no significant changes in post-acquisition operating performance
Sharma & Ho (2002) 1986-1991 Australia 36 "Pure" CF (incl. changes in WC) (1) BV Assets (2) BV Equity (3) Sales (4) Nr. shares Industry and Size
A and T C + I Insignificant change
in post-acquisition performance.
Ghosh (2001)
1981-1995
World 315 Pre-tax CF Adj. MV
Assets Industry, Size and Pre-event performance A and T C + I No significant changes in operating performance following M&As Herman & Lowenstein
(1988) 1975-1983 US hostile offers 56 (1) Net income (2) EBIT (1) BV Equity (2) Capital
Unmatched Only A C Bidders’ return on
capital (ROC) decreases; ROE increases.
Table 1 continued Author(s) Sample period Market Sample size Performance measure
Scaled by Matched by Pre-merger performance Change (C) or Intercept (I) Model Conclusion Mueller (1980) 50s, 60s, 70s Belgium, Germany, UK, US, France, Netherl, Sweden Different per country
Profit after tax BV Assets Industry and
Size
None Other Belgium, Germany,
UK, and US: an increase in post-merger profitability; France, Netherlands, and Sweden: a decline in profitability.
Lev & Mandelker (1972)
1952-1963 US 69 (1) Net income (2) Op. income (1) BV Assets (2) BV Equity (3) Nr of shares (4) Sales Industry and Size A and T C NI/assets significantly increase for acquiring firms; Other performance measures exhibit no significant changes
Lev & Mandelker (1972)
1952-1963 US 69 (1) Net income (2) Op. income (1) BV Assets (2) BV Equity (3) Nr of shares (4) Sales Industry and Size A and T C NI/assets significantly increase for acquiring firms; Other performance measures exhibit no significant changes Studies that document a deterioration in post-acquisition operating performance
Kruse, Park, Park & Suzuki (2002)
1969-1992
Japan 46 Pre-tax CF (1) Adj.
MV Assets (2) Sales
Industry and Size
A and T C + I Overall decline in
cash flow; however, mergers lead to a significant improvement in the performance
Yeh & Hoshino (2001)
1970-1994
Japan 86 (1) Net income
(2) Op. income (1) BV
Equity (2) BV Assets
Industry Only A Other Significant decline
in ROA and ROE following a merger; however, only M&As that involve keiretsu are followed by a significant decline in ROE and ROA; M&As involving independent firms – do not.
Dickerson, Gibson & Tsakalotos (1997)
1948-1977
UK 1,443** Pre-tax profits Net assets Industry Only A Other A significant decline
in acquirer’s ROA
Clark & Ofek (1994)
1981-1988 US distressed targets
38 EBITD Sales Industry A and T C Operating
performance declines over 3 years following M&As Meeks (1977) 1964-1972
UK 223 Pre-tax profits Net assets Industry A and T C Post-merger
profitability is significantly lower than the pre-merger profitability. Hogarty (1970) 1953-1964 US 43 EPS and Capital gains Nr. of shares
Industry Only A Other Investment
performance of the acquirers (acquirer's perspective) deteriorates after M&As * While the total sample consists of 4,430 acquisitions, the regression model used to estimate changes in operating performance is based on 2,362 observations. ** More specifically, the sample includes 2,941 companies, of which 613 (21%) companies were involved in 1,443 acquisitions.
Table 2. Sample selection procedure
Total Nr of completed deals (’97-’01): 873
Removed deals: 15(a) -
Net # of deals: 858 (100%)
Nr. of deals where A and T have at least 1 year pre- and 1 year post-acquisition
financials available in Amadeus: 155 (18%)
Nr. of deals where A and T have at least 3 years pre- and post-acquisition
financials available: 81 (9%)
(a)
15 deals were removed from the sample because of the following reasons: target (or part of target) was sold again within 1 year after the acquisition (8x), more than 1 acquirer (2x), acquirer was taken over within 1 year after acquisition (2x), other (3x).