Results of the Global Youth Tobacco Survey
and implementation of the WHO Framework
Convention on Tobacco Control in the WHO
Eastern Mediterranean Region (EMR) countries
Gulnoza Usmanova
*
, Ali H. Mokdad
Institute for Health Metrics and Evaluation, 2301 5th Avenue, Suite 600, Seattle, WA 98121, United States
Received 31 May 2013; received in revised form 13 July 2013; accepted 17 July 2013
Available online 31 August 2013
KEYWORDS
Youth;
Tobacco;
FCTC;
WHO Eastern
mediterra-nean region
Abstract
We used Global Youth Tobacco Survey (GYTS) data collected over time to
monitor articles of the World Health Organization Framework Convention on
Tobacco Control (WHO FCTC) in WHO Eastern Mediterranean Region (EMR).
Methods:
The GYTS is a school-based survey, conducted in 23 countries in WHO
EMR countries from 1999–2008.
Results:
The prevalence of current smokeless tobacco use was high compared to
cigarette use in all countries. In general, the following changes were observed
between baseline and repeated surveys: in five countries fewer youth supported a
ban on smoking in public places. In four countries more youth saw actors smoking
on TV and were exposed to second-hand smoke (SHS) outside of home. Fewer youth
were offered free cigarettes in ten countries; in eight countries youth saw less
advertisement on TV; in seven countries youth had fewer items with a tobacco logo,
discussed more reasons for smoking and dangers of smoking, and were less exposed
to SHS at home; in six countries youth saw less advertisement at sports events.
Conclusion:
The GYTS data can be used for monitoring, evaluation of national
tobacco control plans and defining future directions for tobacco control.
ª
2013
1. Introduction
In 2011, tobacco use killed almost 6 million people,
with nearly 80% of these deaths occurring in
low-and middle-income countries
[1]
. Every day an
esti-mated 82,000–99,000 young people start smoking
throughout the world; many are children under
age 10, and most reside in low- or middle-income
countries
[2]
.
The World Health Organization (WHO)
Frame-work Convention on Tobacco Control (FCTC) was
2210-6006/$ - see front matter
ª
2013
* Corresponding author.
addresses:
gulnoza@uw.edu
(G.
Usmanova),
mokdaa@uw.edu
(A.H. Mokdad).
Journal of Epidemiology and Global Health (2013)
3, 217
–
234
h t t p : / / w w w . e l s e v i e r . c o m / l o c a t e / j e g h
Ministry of Health, Saudi Arabia. Published by Elsevier Ltd. This is an open
access article under the CC BY-NC-ND license (http://creativecommons.org/licenses/
by-nc-nd/4.0/).
Ministry of Health, Saudi Arabia. Published by Elsevier Ltd.
This is an open access article under the CC BY-NC-ND license (http://creativecommons.org/licenses/by-nc-nd/4.0/).
http://dx.doi.org/10.1016/j.jegh.2013.07.001
developed in response to the globalization of the
tobacco epidemic. It was adopted by the 56th
World Health Assembly in May 2003 and became
an international law in February 2005. The WHO
FCTC is an evidence-based treaty that reaffirms
the right of all people to receive the highest
standards of health. Today, 176 countries covering
87% of the world
Õ
s population embrace the treaty
[3,4]
.
In December 1998, the WHO, the United States
Centers for Disease Control and Prevention (CDC),
and
the
Canadian
Public
Health
Association
(CPHA) developed the Global Tobacco
Surveil-lance System (GTSS) to assist countries in
estab-lishing
the
tobacco
control
surveillance
and
monitoring programs
[5,6]
. The GTSS involves
the collection of data via four surveys: the Global
Youth Tobacco Survey (GYTS), the Global School
Personnel Survey, the Global Health Professions
Student Survey, and the Global Adult Tobacco
Survey
[7]
.
The Middle East has been targeted by
transna-tional tobacco companies since the 1970s as a key
emerging market because of its young and growing
population. Between 1990 and 1997, tobacco
con-sumption in the region grew by 24.3%, making it
‘‘one of the few growing markets in the world’’
[8]
. Cigarette consumption in Western Europe
de-clined by 26% between 1990 and 2009; however,
it increased by 57% in the Middle East and Africa
during the same period
[1]
. Another unique aspect
of the tobacco epidemic in the Middle East is the
use of other tobacco products called ‘‘nargileh,’’
‘‘waterpipes,’’ ‘‘shisha,’’ ‘‘shamma,’’ and
‘‘nush-oog’’
[9–15]
.
During the last decades, there have been several
attempts to understand and measure the rise in
tobacco use among the youth in this part of the
world
using
different
methodologies
[12,13,
16–23]
; however, no papers describing and linking
changes in tobacco use over time in this region
have been published as far as the researchers of
this study are aware of.
The GYTS was conducted in 23 countries of the
WHO Eastern Mediterranean Region (EMR) between
1999 and 2008.
Table 1
provides a detailed
descrip-tion of the sample size, response rates, and date of
FCTC ratification.
Previously, a paper was presented regarding
implementation of the WHO FCTC in the former
So-viet Union
[24]
. The purpose of this paper is to use
the data that has been collected in the GYTS
con-ducted in EMR countries to set the baseline and
monitor changes in tobacco use among youth and
monitor the WHO FCTC articles.
2. Methods
2.1. Sample design
Within each country, the GYTS standard sampling
methodology was used as described in detail
elsewhere
[5–7]
. Briefly, the GYTS standard
sam-pling methodology uses a two-stage cluster sample
design that generates samples composed of
stu-dents in school grades corresponding to the ages
13–15 years.
STATA 12 software (StataCorp. 2011.
Stata
Sta-tistical Software: Release 12
. College Station,
TX: StataCorp LP) was used for the analysis and
to account for survey design.
Table A1 in Web Appendix A presents the
indica-tors related to the WHO FCTC articles and
corre-sponding questions from GYTS.
In Saudi Arabia, the GYTS for the year 2001
in-volved only males; however, in 2007, the survey
was administered to both sexes. For this reason,
comparison over time for Saudi Arabia was only
conducted for males.
3. Results
3.1. Total prevalence of ever and current
cigarette smoking, initiating smoking before
age 10, susceptibility to initiate smoking in
the next year, and smokeless tobacco use
(
Table 3
; Web Appendix A, Table A2)
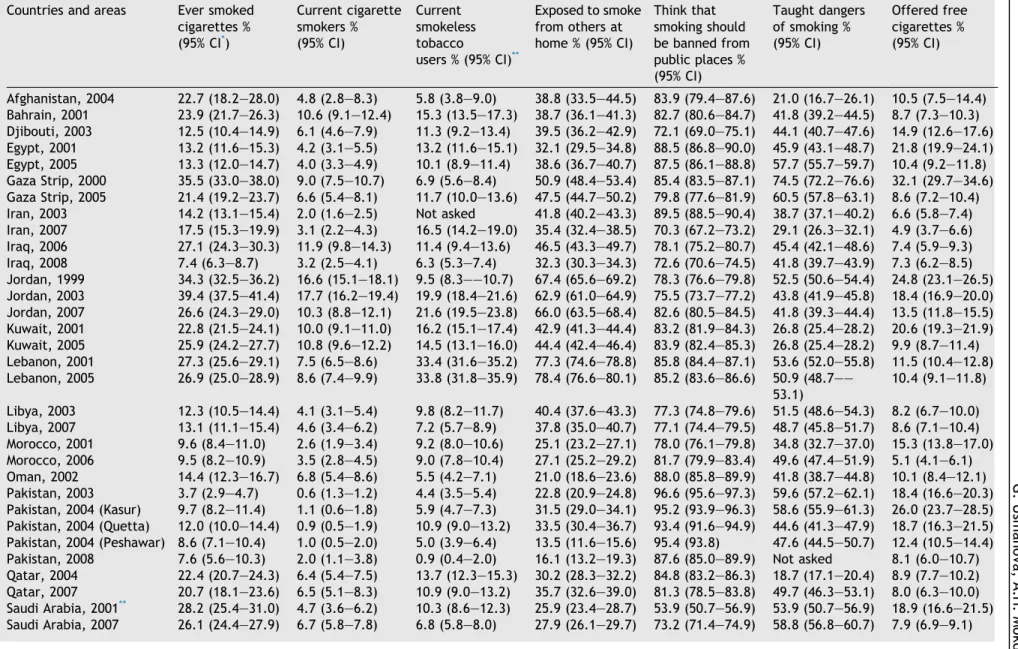
Overall, 3.7% of youth in Pakistan (2003) and 49.5%
in the West Bank (2000) were ever smokers. The
prevalence of current smoking varied between
0.6% in Pakistan (2003) and 18.6% in Somalia
(2004). The most dramatic decrease in the
preva-lence of ever and current smokers was observed
in Iraq, the Gaza Strip, and Somalia; it has
in-creased substantially in Saudi Arabia and Syria,
and decreased and then increased again in Pakistan
and Jordan over time.
The likelihood of initiating smoking in the year
following the survey was high (28.5%) in Yemen
(2003) and low (2.5%) in Pakistan (Peshawar,
2004). Over time, this likelihood increased
signifi-cantly in the Gaza Strip and decreased in Yemen;
however, in Jordan and Pakistan, it fluctuated over
time.
More than 50% of young individuals have initiated
smoking before age 10 in Egypt (2001), Iran, and
Somalia (2004). In general, the age of onset has
decreased significantly in Egypt, Somalia, and
Ye-men, while increasing in the Gaza Strip over time.
Table 1
Date of GYTS data collection, population, and sample counts of schools, classes, and students and survey
response rates in Eastern Mediterranean Region (Centers for Disease Control and Prevention).
#
Country
Date of FCTC
ratification
(DD/MM/YYY)
Date of
GYTS data
collection
Number
of
students
Number
of students
(ages 13–15)
School
response
rate (%)
Class
response
rate (%)
Student
response
rate (%)
Overall
response
rate (%)
1
Afghanistan
13/08/2010
2004
CC
1498
331
96
100
71
68.2
2
Bahrain
20/03/2007
2001
N
2158
1596
100
100
95.2
95.2
3
Djibouti
31/07/2005
2003
N
1580
847
100
100
92.5
92.5
4
Egypt
25/02/2005
2001
N
3792
2215
90.2
100
85.4
77.0
2005
N
2898
2898
100
100
81.7
81.7
5
Gaza Strip
Not ratified
2000
N
1940
1940
100
100
95.8
95.8
2005
N
2109
1395
100
100
94.5
94.5
6
Iran
06/11/2005
2003
N
3841
3841
92.2
100
95.4
87.9
2007
N
1153
1153
92.3
100
93.1
85.9
7
Iraq
17/03/2008
2006
C
1989
957
100
100
95.6
95.6
2008
CC
3604
2182
100
100
94.0
94.0
8
Jordan
19/08/2004
1999
N
3912
2847
91
100
92.2
83.9
2003
N
6313
3683
100
100
89.1
89.1
2007
N
2250
1550
100
100
91.6
91.6
9
Kuwait
12/05/2006
2001
N
6330
4205
100
100
94.8
94.8
2005
N
3935
2636
100
100
88.7
88.7
10
Lebanon
07/12/2005
2001
N
4951
3017
98
98
98.3
94.4
2005
N
3314
2431
98
100
99.2
97.2
11
Libya
07/06/2005
2003
N
1850
1174
98
100
99
97
2007
N
2028
1243
100
100
94.1
94.1
12
Morocco
Not ratified
2001
N
3147
2008
98
100
94.8
92.94
2006
N
3186
1991
98
100
93.5
91.6
13
Oman
9/03/2005
2002
N
1962
1099
100
100
96.9
96.9
15
Pakistan
03/11/2004
2003
N
3812
2565
100
100
87.8
87.8
2004
C
(Kasur)
2241
1386
100
100
87.2
87.2
2004
C
(Quetta)
1804
911
100
100
87.6
87.6
2004
C
(Peshawar)
2159
1216
100
100
90.9
90.9
2008
CC
1402
720
100
100
85.6
85.6
16
Qatar
23/07/2004
2004
N
3240
2229
92
100
91.9
84.5
2007
N
1434
943
96
100
90.9
87.3
17
Saudi Arabia
09/05/2005
2001
CC*
1830
1088
100
100
87.5
87.5
2007
N
3829
2574
94
100
87.4
82.1
18
Somalia
Not ratified
2004
N
1563
374
88
100
94.2
82.9
2007
N
1998
897
96
100
90.2
86.6
19
Sudan
31/10/2005
2001
N
2783
1734
94
100
94.2
88.5
2005
N
4277
2831
92
100
93.2
85.7
20
Syria
22/11/2004
2002
N
4531
3278
100
100
98.3
98.3
2007
N
2039
1621
100
100
83.7
83.7
21
Tunisia
07/06/2010
2001
N
4282
2942
100
100
94.1
94.1
2007
N
2155
1499
100
100
92.4
92.4
22
UAE
07/11/2005
2002
N
4178
2285
100
100
95.1
95.1
2005
N
16,447
10,821
100
100
93.1
93.1
23
West Bank
Not ratified
2000
N
8374
4387
98.7
100
94.8
93.5
2005
N
2182
1305
100
100
95.6
95.6
24
Yemen
22/02/2007
2003
N
12,658
9040
100
99.3
84.3
83.7
2008
N
1219
650
100
100
83.5
83.5
N
At the national level.
CC
Capital city.
C
City.
*
Only boys included.
Table 2
Total prevalence of ever and current cigarette smoking, current smokeless tobacco, exposure to second hand smoking, information about dangers of smoking, being
offered free cigarettes
Countries and areas
Ever smoked
cigarettes %
(95% CI
*
)
Current cigarette
smokers %
(95% CI)
Current
smokeless
tobacco
users % (95% CI)
**
Exposed to smoke
from others at
home % (95% CI)
Think that
smoking should
be banned from
public places %
(95% CI)
Taught dangers
of smoking %
(95% CI)
Offered free
cigarettes %
(95% CI)
Afghanistan, 2004
22.7 (18.2–28.0)
4.8 (2.8–8.3)
5.8 (3.8–9.0)
38.8 (33.5–44.5)
83.9 (79.4–87.6)
21.0 (16.7–26.1)
10.5 (7.5–14.4)
Bahrain, 2001
23.9 (21.7–26.3)
10.6 (9.1–12.4)
15.3 (13.5–17.3)
38.7 (36.1–41.3)
82.7 (80.6–84.7)
41.8 (39.2–44.5)
8.7 (7.3–10.3)
Djibouti, 2003
12.5 (10.4–14.9)
6.1 (4.6–7.9)
11.3 (9.2–13.4)
39.5 (36.2–42.9)
72.1 (69.0–75.1)
44.1 (40.7–47.6)
14.9 (12.6–17.6)
Egypt, 2001
13.2 (11.6–15.3)
4.2 (3.1–5.5)
13.2 (11.6–15.1)
32.1 (29.5–34.8)
88.5 (86.8–90.0)
45.9 (43.1–48.7)
21.8 (19.9–24.1)
Egypt, 2005
13.3 (12.0–14.7)
4.0 (3.3–4.9)
10.1 (8.9–11.4)
38.6 (36.7–40.7)
87.5 (86.1–88.8)
57.7 (55.7–59.7)
10.4 (9.2–11.8)
Gaza Strip, 2000
35.5 (33.0–38.0)
9.0 (7.5–10.7)
6.9 (5.6–8.4)
50.9 (48.4–53.4)
85.4 (83.5–87.1)
74.5 (72.2–76.6)
32.1 (29.7–34.6)
Gaza Strip, 2005
21.4 (19.2–23.7)
6.6 (5.4–8.1)
11.7 (10.0–13.6)
47.5 (44.7–50.2)
79.8 (77.6–81.9)
60.5 (57.8–63.1)
8.6 (7.2–10.4)
Iran, 2003
14.2 (13.1–15.4)
2.0 (1.6–2.5)
Not asked
41.8 (40.2–43.3)
89.5 (88.5–90.4)
38.7 (37.1–40.2)
6.6 (5.8–7.4)
Iran, 2007
17.5 (15.3–19.9)
3.1 (2.2–4.3)
16.5 (14.2–19.0)
35.4 (32.4–38.5)
70.3 (67.2–73.2)
29.1 (26.3–32.1)
4.9 (3.7–6.6)
Iraq, 2006
27.1 (24.3–30.3)
11.9 (9.8–14.3)
11.4 (9.4–13.6)
46.5 (43.3–49.7)
78.1 (75.2–80.7)
45.4 (42.1–48.6)
7.4 (5.9–9.3)
Iraq, 2008
7.4 (6.3–8.7)
3.2 (2.5–4.1)
6.3 (5.3–7.4)
32.3 (30.3–34.3)
72.6 (70.6–74.5)
41.8 (39.7–43.9)
7.3 (6.2–8.5)
Jordan, 1999
34.3 (32.5–36.2)
16.6 (15.1–18.1)
9.5 (8.3––10.7)
67.4 (65.6–69.2)
78.3 (76.6–79.8)
52.5 (50.6–54.4)
24.8 (23.1–26.5)
Jordan, 2003
39.4 (37.5–41.4)
17.7 (16.2–19.4)
19.9 (18.4–21.6)
62.9 (61.0–64.9)
75.5 (73.7–77.2)
43.8 (41.9–45.8)
18.4 (16.9–20.0)
Jordan, 2007
26.6 (24.3–29.0)
10.3 (8.8–12.1)
21.6 (19.5–23.8)
66.0 (63.5–68.4)
82.6 (80.5–84.5)
41.8 (39.3–44.4)
13.5 (11.8–15.5)
Kuwait, 2001
22.8 (21.5–24.1)
10.0 (9.1–11.0)
16.2 (15.1–17.4)
42.9 (41.3–44.4)
83.2 (81.9–84.3)
26.8 (25.4–28.2)
20.6 (19.3–21.9)
Kuwait, 2005
25.9 (24.2–27.7)
10.8 (9.6–12.2)
14.5 (13.1–16.0)
44.4 (42.4–46.4)
83.9 (82.4–85.3)
26.8 (25.4–28.2)
9.9 (8.7–11.4)
Lebanon, 2001
27.3 (25.6–29.1)
7.5 (6.5–8.6)
33.4 (31.6–35.2)
77.3 (74.6–78.8)
85.8 (84.4–87.1)
53.6 (52.0–55.8)
11.5 (10.4–12.8)
Lebanon, 2005
26.9 (25.0–28.9)
8.6 (7.4–9.9)
33.8 (31.8–35.9)
78.4 (76.6–80.1)
85.2 (83.6–86.6)
50.9 (48.7––
53.1)
10.4 (9.1–11.8)
Libya, 2003
12.3 (10.5–14.4)
4.1 (3.1–5.4)
9.8 (8.2–11.7)
40.4 (37.6–43.3)
77.3 (74.8–79.6)
51.5 (48.6–54.3)
8.2 (6.7–10.0)
Libya, 2007
13.1 (11.1–15.4)
4.6 (3.4–6.2)
7.2 (5.7–8.9)
37.8 (35.0–40.7)
77.1 (74.4–79.5)
48.7 (45.8–51.7)
8.6 (7.1–10.4)
Morocco, 2001
9.6 (8.4–11.0)
2.6 (1.9–3.4)
9.2 (8.0–10.6)
25.1 (23.2–27.1)
78.0 (76.1–79.8)
34.8 (32.7–37.0)
15.3 (13.8–17.0)
Morocco, 2006
9.5 (8.2–10.9)
3.5 (2.8–4.5)
9.0 (7.8–10.4)
27.1 (25.2–29.2)
81.7 (79.9–83.4)
49.6 (47.4–51.9)
5.1 (4.1–6.1)
Oman, 2002
14.4 (12.3–16.7)
6.8 (5.4–8.6)
5.5 (4.2–7.1)
21.0 (18.6–23.6)
88.0 (85.8–89.9)
41.8 (38.7–44.8)
10.1 (8.4–12.1)
Pakistan, 2003
3.7 (2.9–4.7)
0.6 (1.3–1.2)
4.4 (3.5–5.4)
22.8 (20.9–24.8)
96.6 (95.6–97.3)
59.6 (57.2–62.1)
18.4 (16.6–20.3)
Pakistan, 2004 (Kasur)
9.7 (8.2–11.4)
1.1 (0.6–1.8)
5.9 (4.7–7.3)
31.5 (29.0–34.1)
95.2 (93.9–96.3)
58.6 (55.9–61.3)
26.0 (23.7–28.5)
Pakistan, 2004 (Quetta)
12.0 (10.0–14.4)
0.9 (0.5–1.9)
10.9 (9.0–13.2)
33.5 (30.4–36.7)
93.4 (91.6–94.9)
44.6 (41.3–47.9)
18.7 (16.3–21.5)
Pakistan, 2004 (Peshawar)
8.6 (7.1–10.4)
1.0 (0.5–2.0)
5.0 (3.9–6.4)
13.5 (11.6–15.6)
95.4 (93.8)
47.6 (44.5–50.7)
12.4 (10.5–14.4)
Pakistan, 2008
7.6 (5.6–10.3)
2.0 (1.1–3.8)
0.9 (0.4–2.0)
16.1 (13.2–19.3)
87.6 (85.0–89.9)
Not asked
8.1 (6.0–10.7)
Qatar, 2004
22.4 (20.7–24.3)
6.4 (5.4–7.5)
13.7 (12.3–15.3)
30.2 (28.3–32.2)
84.8 (83.2–86.3)
18.7 (17.1–20.4)
8.9 (7.7–10.2)
Qatar, 2007
20.7 (18.1–23.6)
6.5 (5.1–8.3)
10.9 (9.0–13.2)
35.7 (32.6–39.0)
81.3 (78.5–83.8)
49.7 (46.3–53.1)
8.0 (6.3–10.0)
Saudi Arabia, 2001
**
28.2 (25.4–31.0)
4.7 (3.6–6.2)
10.3 (8.6–12.3)
25.9 (23.4–28.7)
53.9 (50.7–56.9)
53.9 (50.7–56.9)
18.9 (16.6–21.5)
Saudi Arabia, 2007
26.1 (24.4–27.9)
6.7 (5.8–7.8)
6.8 (5.8–8.0)
27.9 (26.1–29.7)
73.2 (71.4–74.9)
58.8 (56.8–60.7)
7.9 (6.9–9.1)
220
G.
Usmanova
,
A.H.
Mokdad
Table 2
(
continued
)
Countries and areas
Ever smoked
cigarettes %
(95% CI
*
)
Current cigarette
smokers %
(95% CI)
Current
smokeless
tobacco
users % (95% CI)
**
Exposed to smoke
from others at
home % (95% CI)
Think that
smoking should
be banned from
public places %
(95% CI)
Taught dangers
of smoking %
(95% CI)
Offered free
cigarettes %
(95% CI)
Somalia, 2004
28.3 (23.5–33.7)
18.6 (14.4–23.6)
18.6 (14.7–23.4)
56.9 (51.6–62.0)
78.1 (73.1–82.3)
44.7 (39.2–50.3)
28.8 (23.7–34.5)
Somalia, 2007
12.6 (10.5–15.1)
5.8 (4.3–7.7)
12.5 (10.4–14.9)
29.1 (26.1–32.2)
75.4 (72.4–78.2)
47.3 (43.9–50.7)
17.8 (15.4–20.6)
Sudan, 2001
17.1 (15.2–19.2)
6.1 (4.9–7.7)
13.5 (11.8–15.4)
29.2 (27.0–31.5)
78.0 (75.8–80.0)
30.0 (27.8–32.3)
12.7 (11.0–14.5)
Sudan, 2005
19.3 (17.7–21.1)
6.0 (5.0–7.2)
2.8 (2.1–3.6)
27.5 (25.6–29.5)
83.8 (82.0–85.5)
31.6 (29.6–33.7)
8.9 (7.7–10.3)
Syria, 2002
11.0 (9.9–12.1)
6.3 (5.5–7.2)
0.5 (0.3–0.8)
54.5 (52.8–56.3)
80.0 (78.6–81.4)
54.6 (52.9–56.4)
7.4 (6.6–8.4)
Syria, 2007
27.4 (25.1–29.7)
12.3 (10.7–14.1)
24.9 (22.8–27.2)
60.1 (57.6–62.6)
77.4 (75.2–79.4)
60.5 (57.9–62.9)
11.8 (10.2–13.5)
Tunisia, 2001
23.0 (21.5–24.6)
11.1 (10.0–12.3)
7.2 (6.3–8.2)
62.4 (60.6–64.1)
87.0 (85.7–88.2)
31.7 (30.0–33.8)
5.5 (4.7–6.4)
Tunisia, 2007
24.6 (22.4–26.9)
8.3 (6.9–9.8)
4.5 (3.5–5.7)
51.9 (49.4–54.5)
85.3 (83.4–87.1)
43.2 (40.7–45.8)
4.8 (3.8–6.1)
UAE, 2002
18.3 (16.6–20.0)
6.8 (5.7–8.1)
8.3 (7.2–9.6)
30.8 (28.8–32.9)
72.1 (70.1–74.1)
44.5 (42.3–46.8)
9.5 (8.3–10.9)
UAE, 2005
22.6 (21.6–23.5)
8.0 (7.4–8.7)
23.6 (22.7–24.6)
25.3 (24.3–26.3)
71.2 (70.0–72.3)
42.8 (41.5–44.1)
9.1 (8.5–9.8)
West Bank, 2000
49.5 (47.9–51.1)
14.2 (13.0–15.4)
9.0 (8.4–9.6)
66.8 (65.3–68.2)
82.5 (81.2–83.7)
53.2 (51.6–54.8)
Not asked
West Bank, 2005
35.4 (32.8–38.1)
18.0 (15.9–20.3)
16.7 (14.7–18.8)
62.4 (59.6–65.1)
78.3 (75.9–80.6)
60.3 (57.5–63.1)
9.9 (8.3–11.7)
Yemen, 2003
15.3 (14.5–16.1)
5.3 (4.8–5.8)
14.6 (13.8–15.4)
44.0 (42.9–45.1)
78.1 (77.2–79.0)
42.7 (41.7–43.8)
19.6 (18.7–20.6)
Yemen, 2008
14.0 (11.2–17.4)
3.9 (2.6–6.0)
4.5 (2.9–6.8)
44.9 (40.9–49.1)
72.5 (68.7–76.0)
39.3 (35.3–43.4)
9.3 (7.1–12.0)
*
Confidence interval.
**
Only boys were included in the survey.
Results
of
the
Globa
l
Youth
Tobacc
o
Survey
and
implem
entatio
n
o
f
th
e
WHO
Frame
work
221
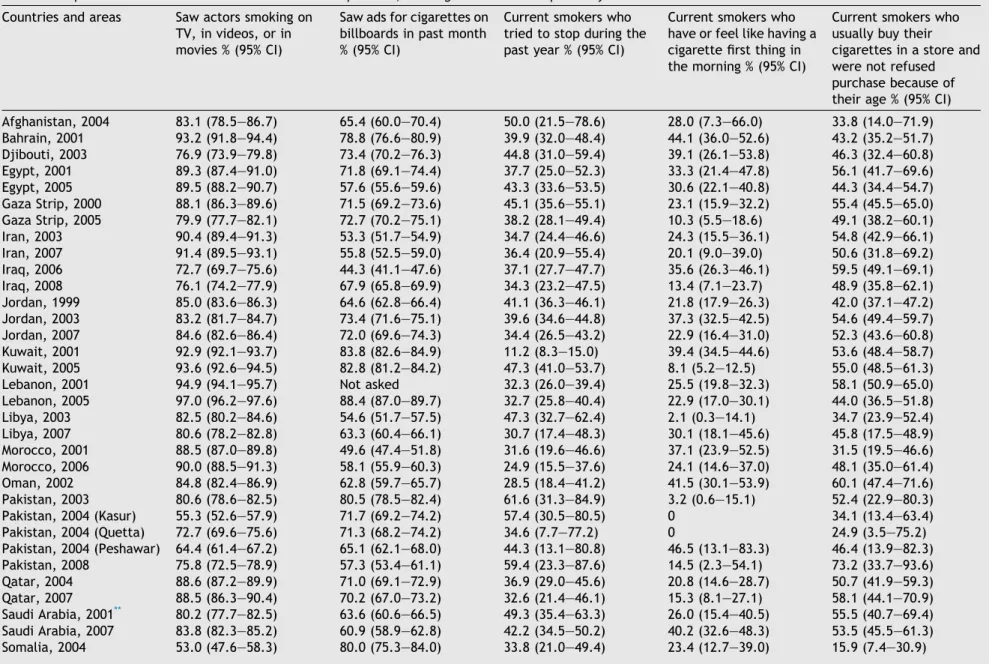
Table 3
Exposure to media and advertisement of tobacco products, smoking cessation and dependency.
Countries and areas
Saw actors smoking on
TV, in videos, or in
movies % (95% CI)
Saw ads for cigarettes on
billboards in past month
% (95% CI)
Current smokers who
tried to stop during the
past year % (95% CI)
Current smokers who
have or feel like having a
cigarette first thing in
the morning % (95% CI)
Current smokers who
usually buy their
cigarettes in a store and
were not refused
purchase because of
their age % (95% CI)
Afghanistan, 2004
83.1 (78.5–86.7)
65.4 (60.0–70.4)
50.0 (21.5–78.6)
28.0 (7.3–66.0)
33.8 (14.0–71.9)
Bahrain, 2001
93.2 (91.8–94.4)
78.8 (76.6–80.9)
39.9 (32.0–48.4)
44.1 (36.0–52.6)
43.2 (35.2–51.7)
Djibouti, 2003
76.9 (73.9–79.8)
73.4 (70.2–76.3)
44.8 (31.0–59.4)
39.1 (26.1–53.8)
46.3 (32.4–60.8)
Egypt, 2001
89.3 (87.4–91.0)
71.8 (69.1–74.4)
37.7 (25.0–52.3)
33.3 (21.4–47.8)
56.1 (41.7–69.6)
Egypt, 2005
89.5 (88.2–90.7)
57.6 (55.6–59.6)
43.3 (33.6–53.5)
30.6 (22.1–40.8)
44.3 (34.4–54.7)
Gaza Strip, 2000
88.1 (86.3–89.6)
71.5 (69.2–73.6)
45.1 (35.6–55.1)
23.1 (15.9–32.2)
55.4 (45.5–65.0)
Gaza Strip, 2005
79.9 (77.7–82.1)
72.7 (70.2–75.1)
38.2 (28.1–49.4)
10.3 (5.5–18.6)
49.1 (38.2–60.1)
Iran, 2003
90.4 (89.4–91.3)
53.3 (51.7–54.9)
34.7 (24.4–46.6)
24.3 (15.5–36.1)
54.8 (42.9–66.1)
Iran, 2007
91.4 (89.5–93.1)
55.8 (52.5–59.0)
36.4 (20.9–55.4)
20.1 (9.0–39.0)
50.6 (31.8–69.2)
Iraq, 2006
72.7 (69.7–75.6)
44.3 (41.1–47.6)
37.1 (27.7–47.7)
35.6 (26.3–46.1)
59.5 (49.1–69.1)
Iraq, 2008
76.1 (74.2–77.9)
67.9 (65.8–69.9)
34.3 (23.2–47.5)
13.4 (7.1–23.7)
48.9 (35.8–62.1)
Jordan, 1999
85.0 (83.6–86.3)
64.6 (62.8–66.4)
41.1 (36.3–46.1)
21.8 (17.9–26.3)
42.0 (37.1–47.2)
Jordan, 2003
83.2 (81.7–84.7)
73.4 (71.6–75.1)
39.6 (34.6–44.8)
37.3 (32.5–42.5)
54.6 (49.4–59.7)
Jordan, 2007
84.6 (82.6–86.4)
72.0 (69.6–74.3)
34.4 (26.5–43.2)
22.9 (16.4–31.0)
52.3 (43.6–60.8)
Kuwait, 2001
92.9 (92.1–93.7)
83.8 (82.6–84.9)
11.2 (8.3–15.0)
39.4 (34.5–44.6)
53.6 (48.4–58.7)
Kuwait, 2005
93.6 (92.6–94.5)
82.8 (81.2–84.2)
47.3 (41.0–53.7)
8.1 (5.2–12.5)
55.0 (48.5–61.3)
Lebanon, 2001
94.9 (94.1–95.7)
Not asked
32.3 (26.0–39.4)
25.5 (19.8–32.3)
58.1 (50.9–65.0)
Lebanon, 2005
97.0 (96.2–97.6)
88.4 (87.0–89.7)
32.7 (25.8–40.4)
22.9 (17.0–30.1)
44.0 (36.5–51.8)
Libya, 2003
82.5 (80.2–84.6)
54.6 (51.7–57.5)
47.3 (32.7–62.4)
2.1 (0.3–14.1)
34.7 (23.9–52.4)
Libya, 2007
80.6 (78.2–82.8)
63.3 (60.4–66.1)
30.7 (17.4–48.3)
30.1 (18.1–45.6)
45.8 (17.5–48.9)
Morocco, 2001
88.5 (87.0–89.8)
49.6 (47.4–51.8)
31.6 (19.6–46.6)
37.1 (23.9–52.5)
31.5 (19.5–46.6)
Morocco, 2006
90.0 (88.5–91.3)
58.1 (55.9–60.3)
24.9 (15.5–37.6)
24.1 (14.6–37.0)
48.1 (35.0–61.4)
Oman, 2002
84.8 (82.4–86.9)
62.8 (59.7–65.7)
28.5 (18.4–41.2)
41.5 (30.1–53.9)
60.1 (47.4–71.6)
Pakistan, 2003
80.6 (78.6–82.5)
80.5 (78.5–82.4)
61.6 (31.3–84.9)
3.2 (0.6–15.1)
52.4 (22.9–80.3)
Pakistan, 2004 (Kasur)
55.3 (52.6–57.9)
71.7 (69.2–74.2)
57.4 (30.5–80.5)
0
34.1 (13.4–63.4)
Pakistan, 2004 (Quetta)
72.7 (69.6–75.6)
71.3 (68.2–74.2)
34.6 (7.7–77.2)
0
24.9 (3.5–75.2)
Pakistan, 2004 (Peshawar)
64.4 (61.4–67.2)
65.1 (62.1–68.0)
44.3 (13.1–80.8)
46.5 (13.1–83.3)
46.4 (13.9–82.3)
Pakistan, 2008
75.8 (72.5–78.9)
57.3 (53.4–61.1)
59.4 (23.3–87.6)
14.5 (2.3–54.1)
73.2 (33.7–93.6)
Qatar, 2004
88.6 (87.2–89.9)
71.0 (69.1–72.9)
36.9 (29.0–45.6)
20.8 (14.6–28.7)
50.7 (41.9–59.3)
Qatar, 2007
88.5 (86.3–90.4)
70.2 (67.0–73.2)
32.6 (21.4–46.1)
15.3 (8.1–27.1)
58.1 (44.1–70.9)
Saudi Arabia, 2001
**
80.2 (77.7–82.5)
63.6 (60.6–66.5)
49.3 (35.4–63.3)
26.0 (15.4–40.5)
55.5 (40.7–69.4)
Saudi Arabia, 2007
83.8 (82.3–85.2)
60.9 (58.9–62.8)
42.2 (34.5–50.2)
40.2 (32.6–48.3)
53.5 (45.5–61.3)
Somalia, 2004
53.0 (47.6–58.3)
80.0 (75.3–84.0)
33.8 (21.0–49.4)
23.4 (12.7–39.0)
15.9 (7.4–30.9)
222
G.
Usmanova
,
A.H.
Mokdad
Table 3
(
continued
)
Countries and areas
Saw actors smoking on
TV, in videos, or in
movies % (95% CI)
Saw ads for cigarettes on
billboards in past month
% (95% CI)
Current smokers who
tried to stop during the
past year % (95% CI)
Current smokers who
have or feel like having a
cigarette first thing in
the morning % (95% CI)
Current smokers who
usually buy their
cigarettes in a store and
were not refused
purchase because of
their age % (95% CI)
Somalia, 2007
57.0 (53.7–60.3)
76.0 (73.0–78.8)
30.2 (16.7–48.3)
18.4 (8.9–34.1)
30.9 (18.1–47.6)
Sudan, 2001
85.7 (83.9–87.4)
56.5 (53.9–58.9)
33.0 (22.7–45.2)
33.2 (22.7–45.6)
43.7 (31.9–56.3)
Sudan, 2005
86.3 (84.5–87.8)
51.5 (49.3–53.7)
33.0 (25.4–41.7)
23.4 (16.3–32.3)
29.7 (22.2–––38.5)
Syria, 2002
88.0 (86.7–89.1)
63.0 (61.3–64.7)
45.1 (38.1–52.2)
25.6 (19.8–32.4)
43.1 (36.2–50.3)
Syria, 2007
90.6 (89.0–92.0)
59.2 (56.6–61.7)
34.2 (27.6–41.6)
25.8 (20.0–32.8)
36.7 (29.9–44.1)
Tunisia, 2001
94.6 (93.7–95.3)
61.8 (60.0–63.6)
36.5 (31.4–41.9)
10.8 (7.6–15.1)
58.0 (52.4––63.3)
Tunisia, 2007
95.1 (93.8–96.1)
64.5 (61.9–66.9)
40.0 (31.2–49.4)
1.7 (0.4––6.9)
48.5 (39.1––57.9)
UAE, 2002
86.2 (84.5–87.7)
75.7 (73.7–77.6)
36.0 (28.0–44.9)
26.8 (19.4–35.8)
46.4 (29.7–46.8)
UAE, 2005
89.8 (89.1–90.5)
69.2 (68.2–70.3)
36.7 (32.7–40.8)
29.1 (25.4–33.0)
34.9 (31.2–39.0)
West Bank, 2000
87.6 (86.5–88.6)
68.9 (67.4–70.3)
46.0 (41.5–50.6)
20.5 (17.1–24.4)
47.8 (43.3–52.4)
West Bank, 2005
87.5 (85.5–89.2)
70.6 (67.9–73.1)
40.5 (34.0–47.3)
9.6 (6.4–14.2)
44.1 (37.5–50.9)
Yemen, 2003
82.0 (81.2–82.9)
80.4 (79.5–81.3)
46.2 (41.0–51.5)
0.4 (0.1–2.5)
41.9 (36.9–47.1)
Yemen, 2008
63.8 (59.7–63.6)
61.5 (57.4–65.4)
26.1 (10.9–50.6)
0
37.0 (16.2–64.0)
**
Only boys were included in the survey.
Results
of
the
Globa
l
Youth
Tobacc
o
Survey
and
implem
entatio
n
o
f
th
e
WHO
Frame
work
223
The prevalence of the use of smokeless tobacco
ranged between 0.5% in Syria (2002) and 33.8% in
Lebanon (2005). It has decreased dramatically in
Libya, Sudan, and Yemen; increased substantially
in Syria, Jordan, and the United Arab Emirates
(UAE); and increased and decreased in Pakistan
over time.
3.2. Exposure to SHS and information about
dangers of tobacco (
Table 2
; Web Appendix
A, Table A3)
The prevalence of exposure to SHS at home varied
between 78.4% in Lebanon (2005) and 13.5% in
Pakistan (Peshawar, 2004). It decreased
dramati-cally in Iraq and Somalia; increased in Egypt,
Qatar, and Syria; and decreased then increased in
Jordan over time.
The prevalence of exposure to smoke from
oth-ers in public places varied between 78.1% (Iraq,
2006) and 28.5% (Pakistan, 2003). It decreased
dra-matically in Iran and Iraq, increased in Lebanon and
Syria, and increased then decreased in Pakistan
over time.
The prevalence of thinking that smoking should
be banned from public places varied between
96.6% (Pakistan, 2003) and 70.3% (Iran, 2007). It
decreased dramatically in Iran, Pakistan, and
Somalia; increased in Saudi Arabia; and decreased
then increased again in Jordan over time.
The prevalence of classes on the dangers of
smoking was 74.5% in the Gaza Strip (2000) and
18.7% in Qatar (2004). It decreased dramatically
in Jordan and Pakistan and increased in Qatar over
time.
Around 50% of the youth in the Gaza Strip (2000)
and 20.1% in Yemen (2003) had previously
dis-cussed in school the reasons why people in their
age group smoke. The prevalence of classes on
the effects of smoking was 64.2% in the Gaza Strip
(2000) and 17.4% in Qatar (2004). Overall, the
prev-alence of discussing why people of their age smoke
and effects of smoking decreased dramatically in
the Gaza Strip, Jordan, and Lebanon, and
in-creased in Egypt, Qatar, Tunisia, and the West
Bank over time.
3.3. Exposure to media and advertisement
of tobacco products (
Table 3
; Web Appendix
A, Table A4)
More than 90% of youth saw actors smoking on
tele-vision, in videos, and in movies in the month before
the survey in Bahrain (2001), Iran, Kuwait,
Leba-non, Syria (2007), and Tunisia. The effect of such
media exposure has dramatically decreased in
Ye-men while increasing over time in Saudi Arabia
and Somalia.
More than 80% of the young population was
ex-posed to cigarette ads displayed on billboards in
the past month prior to the survey in Kuwait,
Leb-anon (2005), Pakistan (2003), and Yemen (2003).
Exposure dramatically decreased in Egypt and
Lebanon and increased in Iraq over time.
Around 89% of the youth in Kuwait (2001) and
33.4% in Afghanistan saw ads for cigarettes in
newspapers or magazines in the month before the
survey. It dramatically decreased in Egypt and
in-creased in Iraq, Lebanon, and Saudi Arabia over
time.
More than 66% of adolescents in the Gaza Strip
(2000), Lebanon (2001), and Sudan (2005) saw ads
for cigarettes at a sporting event in the month prior
to the start of the survey. This dramatically
de-creased in the Gaza Strip and inde-creased in Sudan
over time.
The ownership of objects with a cigarette-brand
logo was found to be 33.1% in the West Bank (2000)
and 9.2% in Saudi Arabia (2001). It dramatically
de-creased in the Gaza Strip and the West Bank and
in-creased in Qatar and Sudan over time.
The prevalence of being offered free cigarettes
varied between 32.1% (Gaza Strip, 2000) and 4.8%
(Tunisia, 2007). It decreased dramatically in the
Gaza Strip and increased and then decreased in
Pakistan over time.
3.4. Smoking cessation and dependency and
minors
Õ
access to tobacco products (
Table 3
;
Web Appendix A, Table A5)
More than 50% of current smokers in Djibouti, Iraq
(2006), Morocco (2001), Oman, Pakistan (Kasur,
2004), Tunisia, and Yemen (2003) have desired to
stop smoking. This percentage has decreased
dramatically in Iraq and increased in Egypt and
Somalia over time.
Around 61% of current smokers in Pakistan
(2003) and 11% in Kuwait (2001) have tried to stop
smoking during the past year. This has dramatically
decreased in Yemen, increased in Kuwait, and
de-creased and then inde-creased in Jordan and Pakistan
over time.
More than 90% of current smokers in
Afghani-stan, the Gaza Strip (2000), Kuwait (2001),
Tuni-sia (2001), and Yemen have received prior help
to stop smoking. It dramatically decreased in
Somalia, increased in Iran, and increased and
then decreased in Pakistan and the West Bank
over time.
More than 46% of current smokers in Pakistan
(Peshawar, 2004) and 0.4% in Yemen (2003) have
or feel like having a cigarette first thing in the
morning. It dramatically decreased in Kuwait,
in-creased in Libya, and inin-creased and then dein-creased
in Jordan over time.
More than 70% of current adolescent smokers in
Pakistan (2008) and 15.9% in Somalia (2004) usually
buy their cigarettes in a store and were not refused
purchase because of their age. It significantly
in-creased in Somalia, Morocco, Libya, and Pakistan,
and decreased in Sudan over time.
A detailed description of gender differences can
be found in Web Appendix A.
4. Discussion
To the best of the researchers
Õ
knowledge, this
manuscript is the first to examine the WHO FCTC
articles and GYTS data for each country in this
region. These results show that there is a major
problem with tobacco in these countries. In fact,
four WHO EMR areas (Gaza Strip, Morocco,
Soma-lia, and the West Bank) have not yet ratified the
FCTC recommendations. The prevalence of ever
smoking in the Gaza Strip (2000), Jordan (1999,
2003), and the West Bank was found to be higher
than the average observed in the Western Pacific
(30.3%), Southeast Asia (9.9%), Eastern
Mediterra-nean (14.8%), and Africa regions (22.9%)
[7]
.
Regardless, the overall prevalence of ever
ciga-rette smoking was lower in the WHO EMR areas
combined compared with the WHO regions of the
Americas (49.4%) and Europe (44.1%). However,
the prevalence of current cigarette smoking was
higher in Jordan (1999, 2003), Somalia (2004),
and the West Bank (2005) in comparison with the
average estimated for the WHO regions of the
European (19.2%), Americas (14.3%), Western
Paci-fic (13.4%), Southeast Asia (5.9%), Eastern
Mediter-ranean (4.9%), and Africa (8.0%) regions
[7]
.
In 18 WHO EMR countries, the GYTS was
con-ducted more than once, which allowed comparison
between a baseline and repeated surveys. As a
re-sult, several urgent public health problems were
identified in the repeated survey. First, current
smokeless tobacco use was significantly higher than
cigarette smoking. Second, in the Gaza Strip,
Jor-dan, Lebanon, Pakistan, Syria, the United Arab
Emirates and the West Bank, more adolescents
may start to smoke within the next year. Third,
in five countries of the EMR region, fewer youth
supported a ban on smoking in public places (Gaza
Strip, Iran, Iraq, Pakistan and Yemen); in four
countries, more youth saw actors smoking on
tele-vision (Iraq, Jordan, Libya and Morocco) and were
exposed to SHS outside their homes (Lebanon,
Li-bya, Pakistan and Syria).
The following positive changes were identified in
the repeated survey compared with the baseline
survey: fewer youth were offered free cigarettes
in 10 countries; in 8 countries they saw less
adver-tisement on television; in 7 countries they had less
items with a tobacco-brand logo and were able to
discuss the reasons for smoking and its dangers,
and were less exposed to SHS at home; and in 6
countries, the youth saw fewer advertisements at
sports events.
This study has some limitations that are worth
mentioning. First, smoking was self-reported and
not validated using biomarkers such as salivary
cotinine. Secondly, the GYTS is limited to students
who are not representative of all young individuals
aged 13–15 years. However, in the majority of
countries in this region, school enrollment is over
90%
[25]
. Finally, the GYTS was conducted in
dif-ferent years and in difdif-ferent countries; some of
the surveys are nationally representative and some
were collected in the capital city. On the other
hand, this study has the following strengths: first,
all GYTS surveys use exactly the same sampling
procedures, core questionnaire items, and
train-ings in field procedures. Secondly, the analysis of
data is consistent and comparable across all survey
sites and over time. Thirdly, the GYTS was
de-signed in a way to help countries monitor some
articles of the WHO FCTC. Finally, it has substantial
implications for monitoring specific WHO FCTC
articles and progress in implementing tobacco
con-trol programs among youth.
This study allows for examining the current
to-bacco burden in the EMR countries in relation to
the current tobacco control policies reported
with-in the WHO FCTC articles. The assessment of the
six articles and their effect on tobacco use and
knowledge are described in more detail below.
4.1. WHO FCTC Article 21: Reporting and
exchange of information
All countries in this region followed the WHO
rec-ommendations on monitoring tobacco use in order
to inform tobacco control policies as well as
con-ducting the GYTS at least once.
Current cigarette smoking was higher among
young males than among young females in all
coun-Results of the Global Youth Tobacco Survey and implementation of the WHO Framework
225
tries, which was comparable with the findings from
other GYTS sites. Furthermore, the surveys have
shown that the difference in current cigarette
smoking between male and female youth is less
than the difference between adult men and women
[5,6,13]
. This could be attributed to the fact that
transnational tobacco companies are targeting
young females and directing their initial marketing
and distribution efforts to major cities
[26,27]
.
At the same time, the specific role of smokeless
tobacco in the regional tobacco epidemic should
also be mentioned. This study has found that the
prevalence of smokeless tobacco is in fact higher
than cigarette smoking, which is consistent with
the results from other studies
[9,12,17,18,20,21]
.
Moreover, the prevalence of smokeless tobacco
has been reported to be high specifically among
young females in this region; for example, in
Lebanon, 29.9% of young females used smokeless
tobacco. This higher prevalence of smokeless
to-bacco in the region could be explained by local
tra-ditions, less stigma
[20,21]
, cost
[11]
, and the
perception that it is less harmful than cigarettes
[19,20]
. Also, it is socially acceptable in the Middle
East for a father to offer his teenage children a puff
from a water pipe
[17]
. Recent studies have shown
that smokeless tobacco is associated with many
health outcomes including cancer, chronic
obstruc-tive pulmonary disease, and coronary artery
dis-eases
[11,28,29]
.
4.2. WHO FCTC Article 8: Protection from
exposure to tobacco smoke
In the EMR countries, exposure to SHS is higher in
public places than at home, except for the
follow-ing areas: the Gaza Strip (2000, 2005), Iraq (2008),
Jordan (1999, 2007), Lebanon, Libya (2003), Syria,
the West Bank, and Yemen (2008).
All the WHO EMR countries have smoke-free
pol-icies that have been signed and approved
[4,30]
.
However, the compliance level differs considerably
between countries. For example, up to two places
are smoke-free in Bahrain, Iraq, Kuwait, Oman,
Qa-tar, Somalia, Sudan, Tunisia, and Yemen with no
information about compliance levels; while three
to five places are smoke-free in Afghanistan,
Jor-dan, Lebanon, Morocco, Saudi Arabia, and UAE
with moderate and minimal compliance; six to
se-ven places are smoke-free with minimal
compli-ance in Egypt, moderate complicompli-ance in Syria, and
complete compliance in the West Bank and the
Gaza Strip; all public places are completely
smoke-free in Iran (complete compliance), Libya
(moderate compliance), and Pakistan (minimal
compliance). In Lebanon, however, a law exists
that allows hotels to allocate 20% of their available
rooms for smokers
[30,31]
.
4.3. WHO FCTC Article 12: Education,
communication, training and public
awareness
The present survey cannot assess the quality of
educational classes on the dangers and the effects
of smoking. While greater levels of teaching are
po-sitive for tobacco control, it is important that in
each country the ministry of health and ministry
of education work together in order to meet the
objectives of Article 12 of the WHO FCTC on
educa-tion, communicaeduca-tion, training, and public
aware-ness
[3]
. However, school programs alone cannot
be an effective tobacco control strategy. A review
of the effect of school-based tobacco prevention
programs has shown that educational programs will
be most successful if they occur after other
tobac-co tobac-control policies are in place, such as tax and
price policies that aim at reducing tobacco
con-sumption, producing a 100% smoke-free
environ-ment in all public places and workplaces, and
comprehensively banning all tobacco
advertise-ments, promotions, and sponsorships
[32]
.
In Lebanon, the national curriculum includes
classes on raising tobacco awareness
[19]
, but the
percentage of students who have actually had
clas-ses on smoking was reported to be around 50% and
has decreased over the past years.
4.4. WHO FCTC Article 13: Tobacco
advertising, promotion, and sponsorship
As the number of countries that have imposed bans
on direct advertisements has increased, the
tobac-co industry has also increased its indirect
advertis-ing methods, such as sponsoradvertis-ing events, puttadvertis-ing
their logos on promotional items, brand stretching,
giving away free samples at events popular with
young
people,
and
sponsoring
entertainment
events
[33]
. Regardless of these efforts, a
substan-tial proportion of young individuals saw actors
smoking on television; were exposed to tobacco
advertisements on billboards, in newspapers or
magazines, or at sporting events; had an object
with a tobacco-brand logo on it; or were offered
free cigarettes during the last month prior to the
survey.
According to WHO FCTC recommendations,
countries are required to ‘‘undertake a
compre-hensive ban on tobacco advertisement, promotion
and sponsorship within 5 years of ratification.’’
Even though Egypt, Libya, Oman, Pakistan, and
Saudi Arabia had endorsed the WHO FCTC 5 years
ago and are subject to the banning regulations
[4,31]
, there was no evident ban on all forms of
di-rect and indidi-rect advertisement, and the
enforce-ment has been rather moderate. In Djibouti, Iran,
Jordan, Kuwait, Qatar, Sudan, Syria, and the
UAE, on the other hand, the compliance with the
prohibition law has been moderate to complete.
In Pakistan and Oman, this ban does not apply to
the national television, radio, and print media. In
September 2011, the Lebanese government
ap-proved a law that entails the complete ban on
to-bacco
advertisement
and
promotion
[31]
.
Moreover, little reduction has been observed in
terms of seeing actors smoking on television or
appearing in ads for cigarettes on billboards
(ex-cept in Egypt and Yemen) and in newspapers and
magazines. In addition, the attempts to reduce
the cigarette promotion ads at sporting events,
dis-tribution of objects with a tobacco-brand logo on
it, and offering free cigarettes have not been
successful.
4.5. WHO FCTC Article 14: Demand
reduction measures concerning tobacco
dependence and cessation
In most of the countries examined, more current
smokers have desired to stop smoking (except in
Iraq, Libya, Morocco, Sudan, Syria, the UAE, and
Yemen); however, in the Gaza Strip, Iraq, Libya,
Morocco, Pakistan, Somalia, Syria, Tunisia, the
West Bank and Yemen, the number of current
smokers who have actually tried to stop during
the past year has decreased. Also, in the Gaza
Strip, Iraq, Kuwait, Lebanon, Libya, Qatar,
Soma-lia, Sudan, Syria, Tunisia, the UAE, and Yemen,
fewer smokers got advice on smoking cessation. It
is not surprising to see no change or only a few
changes in the smoking cessation patterns, because
only four countries (Bahrain, Iran, Saudi Arabia,
and the UAE) have national programs for people
who want to quit smoking and cover the cost of
both nicotine replacement therapy (NRT) and some
cessation services; five countries (Egypt, Jordan,
Kuwait, Qatar, and Syria) have NRT or some
cessa-tion services (at least one of which covers the
cost); three countries (Yemen, Sudan, and Somalia)
have no smoking cessation programs, and the rest
of the countries have NRT or some cessation
ser-vices (neither cost covered)
[4,31]
. Even if smoking
cessation programs are available, it is not clear
how easily accessible they are for the young
individuals.
It is also noteworthy to mention that, over time,
fewer young individuals feel like having a cigarette
first thing in the morning (except in Jordan, Libya,
Pakistan, and the UAE).
4.6. WHO FCTC Article 16: Sales to and by
minors
The WHO FCTC recommends that the sale of
tobac-co products should be prohibited to individuals
un-der the age of 18. This survey showed that, in the
majority of countries, more than 40% of the current
13- to 15-year-old smokers were not refused the
purchase of cigarettes in stores. This is true despite
the fact that all countries in this region have a law
prohibiting the sale of tobacco products or
individ-ual cigarettes to minors
[31]
.
5. Conclusion
The most recent available data has been used in
this study; however, these findings call for newer
data to be collected in the region to better inform
policy and monitor success. Nevertheless, this
study provides valuable information for
policymak-ers and health professionals in the EMR countries. It
is crucial that the data is used as a baseline point
for decision-making concerning National Tobacco
Control Action Plans. Extensive efforts to increase
awareness about the harm of tobacco in this region
are urgently needed. Programs and policies should
aim to prevent smoking initiation among youth.
Moreover, further efforts should target media and
advertisement of tobacco products.
Conflict of interest
None declared.
Appendix A.
Comparison between female and male
j
prevalence of ever smoking and current smoking
j
initiation of smoking in the next year and before age
10, except for Djibouti and Egypt
j
use of other tobacco products, except for Somalia
(2004)
j
being exposed to SHS in public places, except for Iraq
(2008) and Lebanon (2005)
j
classes about the dangers of smoking, except for the
Gaza Strip (2000); Iraq (2008); Jordan (1999); Kuwait
(2001); Libya (2003, 2007), Morocco (2001), Pakistan
(2003), (2004, Kasur, Quetta); Sudan, 2001; Syria,
2002; Tunisia, 2007; and UAE, 2002
j
discussion of reasons why people of their age smoke,
except for the Gaza Strip, 2000; Jordan, 2003; Libya,
Results of the Global Youth Tobacco Survey and implementation of the WHO Framework
227
Table A1. Articles of WHO FCTC and GYTS related measures.
Articles of WHO FCTC
GYTS measures
Article 21 Reporting and exchange of information
Each Party shall submit to the Conference of Parties,
through secretariat periodic reports on its implementation
of this Convention which should include the following:
Ever smoked cigarettes
Current cigarette smoking
Current smokeless tobacco users
Initiating smoking before age 10
Likelihood of smoking initiation by never
smokers during the next 12 months
(d) Information on surveillance and research as specified in
article 20 (research, surveillance and exchange of
information) of this Convention.
Article 8 Protection from exposure to tobacco smoke
Each Party shall adopt and implement in areas of existing
national jurisdiction as determined by national law and
actively promote at other jurisdictional levels the adoption
and implementation of effective legislative, executive,
administrative and/or other measures, providing for
protection from exposure to tobacco smoke in indoor
workplaces, public transport, indoor public places and, as
appropriate, other public places.
Exposure to SHS at home
Exposure to SHS in public places
Opinion about smoking ban in public places
Article 12 Education, communication, training and public
awareness
Each Party shall promote and strengthen public awareness of
tobacco control issues, using all available communication
tools, as appropriate.
Taught about the dangers of smoking in school
Taught about effects of smoking in school
Discussed reasons why people of their age
smoke in school
Toward this end, each Party shall adopt and implement
effective legislative, executive, administrative or other
measures to promote:
(f) Public awareness of and access to information regarding
the adverse health, economic, and environmental
consequences of tobacco production and consumption.
Article 13 Tobacco advertising, promotion and sponsorship
Saw actors smoking on TV, in videos, or in
movies
Saw ads for cigarettes on billboards in city
Saw ads in newspapers or magazines
Saw ads at sports events
Owning an object with a cigarette brand logo
on it
Being offered a free cigarette by tobacco
company
Each Party shall, in accordance with its constitution or
constitutional principles, undertake a comprehensive ban of
all tobacco advertising, promotion and sponsorship.
This shall include, subject to the legal environment and
technical means available to that Party, a comprehensive
ban on cross-border advertising, promotion and sponsorship
originating from its territory.
Article 14 Demand reduction measures concerning tobacco
dependence and cessation
Current smokers who desire to stop smoking
Current smokers who tried to stop during the
past year
Current smokers who received help to stop
smoking
Current smokers who have or feel like having a
cigarette first thing in the morning
Each Party shall develop and disseminate appropriate,
comprehensive and integrated guidelines based on scientific
evidence and best practices, taking into account national
circumstances and priorities, and shall take effective
measures to promote cessation of tobacco use and adequate
treatment for tobacco dependence.
Article 16 Sales to and by minors
Current smokers who were not refused
purchase of cigarettes because of their age
Each Party shall adopt and implement effective legislative,
executive, administrative or other measures at the
appropriate government level to prohibit the sales of
tobacco products to persons under the age set by domestic
law, national law or eighteen.
Table
A2.
Prevalence
of
cigarette,
smokeless
tobacco
and
susceptibility
to
initiate
smoking
in
the
next
year
and
initiating
smoking
before
age
10
(ar
ticle
21
of
WHO
FCTC).
Countries
Ever
smoked
cigarettes
%
(95%
CI)
Smokers
who
initiated
smoking
before
age
10%
(95%
CI)
Current
cigarette
smokers
%
(95%
CI)
Current
smokele
ss
tobacco
users
%
(95%
CI)
Never
smokers
likely
to
initiate
smoking
next
year
%
(95%
CI)
Total
Boy
Girl
Total
Boy
Girl
Total
Boy
Girl
Total
Boy
Girl
Total
Boy
Girl
Afghanistan,
2004
22.7
(18.2–28.0)
27.4
(20.9–35.0)
15.5
(10.3–22.7)
33.0
(21.8–46.4)
38.6
(24.2–55.4)
20.2
(7.1–45.7)
4.8
(2.8–8.3)
7.6
(4.3–13.2)
0
5.8
(3.8–9.0)
7.0
(4.0–11.8)
3.2
(1.3–7.6)
4.3
(2.3–8.1)
5.8
(2.7–12.2)
2.5
(0.8–7.7)
Bahrain,
2001
23.9
(21.7–26.3)
34.2
(30.6–38.0)
13.7
(11.4–16.5)
41.5
(36.1–47.0)
45.6
(38.9–52.4)
31.3
(22.7–41.3)
10.6
(9.1–12.4)
17.5
(14.7–2
0.7)
3.9
(2.7–5.6)
15.3
(13.5–17.3)
19.9
(17.0–23.2)
10.5
(8.5–13.0)
17.3
(15.1–19.8)
21.7
(17.9–25.9)
14.0
(11.4–17.0)
Djibouti,
2003
12.5
(10.4–14.9)
16.7
(13.7–20.4)
6.8
(4.6–10.1)
23.9
(16.4–33.5)
21.4
(13.5–32.1)
32.8
(15.6–56.2)
6.1
(4.6–7.9)
8.5
(6.3–11.5)
2
.6
(1.3–5.0)
11.3
(9.2–13.4)
12.3
(9.7–15.5)
9.6
(6.9–13.2)
13.7
(11.3–16.5)
15.5
(12.3–19.5)
11.6
(8.4–15.8)
Egypt,
2001
13.2
(11.6–15.3)
15.3
(13.6–17.1)
10.6
(7.8–14.3)
57.3
(49.9–64.4)
51.3
(45.0–57.4)
67.2
(51.5–79.8)
4.2
(3.1–5.5)
3.9
(3.1–4.9)
3.9
(2.3–6.8)
13.2
(11.6–15.1)
16.6
(14.7–18.5)
9.8
(7.3–13.2)
Not
asked
Egypt,
2005
13.3
(12.0–14.7)
19.0
(17.0–21.3)
5.6
(4.3–7.2)
44.3
(38.9–49.8)
44.6
(38.5–50.9)
44.9
(32.1–58.3)
4.0
(3.3–4.9)
5.9
(4.8–7.3)
6.7
(5.
3–8.4)
10.1
(8.9–11.4)
12.3
(10.6–14.3)
1.4
(0.8–2.3)
14.8
(13.3–16.5)
18.9
(16.3–21.2)
10.8
(8.9–12.9)
Gaza
Strip,
2000
35.5
(33.0–38.0)
50.1
(45.7–54.5)
22.3
(20.1–24.5)
40.3
(36.0–44.8)
41.4
(35.4–47.6)
38.7
(33.3–44.3)
9.0
(7.5–10.7)
15.1
(12.1–18.6)
3.4
(2.5–4
.6)
6.9
(5.6–8.4)
11.2
(8.7–14.3)
3.0
(2.2–4.1)
4.8
(3.6–6.4)
6.8
(4.3–10.8)
3.3
(2.4–4.6)
Gaza
Strip,
2005
21.4
(19.2–23.7)
30.2
(26.7–33.9)
11.6
(9.3–14.5)
47.8
(41.7–53.9)
52.0
(44.8–59.2)
39.4
(28.1–51.9)
6.6
(5.4–8.1)
9.7
(7.6–12.3)
3.0
(1.9–4.8)
1
1.7
(10.0–13.6)
12.8
(10.4–15.5)
10.0
(7.8–12.6)
12.6
(10.7–14.8)
13.7
(10.8–17.1)
12.0
(9.5–15.1)
Iran,
2003
14.2
(13.1–15.4)
22.8
(20.9–24.9)
7.4
(6.3–8.6)
54.0
(49.7–58.3)
57.0
(51.9–62.0)
45.4
(37.5–53.6)
2.0
(1.6–2.5)
3.2
(2.5–4.2)
1.0
(0.7
–1.6)
Not
asked
9.5
(8.5–10.5)
14.0
(12.2–16.0)
6.5
(5.4–7.7)
Iran,
2007
17.5
(15.3–19.9)
23.7
(20.3–27.5)
11.0
(8.4–14.2)
51.6
(44.1–58.9)
53.7
(44.9–62.3)
46.9
(33.4–60.9)
3.1
(2.2–4.3)
5.1
(3.5–7.3)
0.9
(0
.3–2.4)
16.5
(14.2–19.0)
22.8
(19.2–26.8)
9.4
(7.0–12.5)
5.6
(4.1–7.5)
6.8
(4.6–10.0)
4.3
(2.6–6.9)
Iraq,
2006
27.1
(24.3–30.3)
41.5
(36.8–46.3)
10.6
(8.1–13.8)
34.7
(28.5–41.5)
38.6
(31.4–46.4)
17.5
(9.1–31.2)
11.9
(9.8–14.3)
21.0
(17.3–25.3)
2
.1
(1.2–3.9)
11.4
(9.4–13.6)
13.5
(10.6–17.2)
8.7
(6.5–11.5)
8.3
(6.4–10.8)
10.9
(7.5–15.5)
5.8
(3.9–8.5)
Iraq,
2008
7.4
(6.3–8.7)
7.4
(5.9–9.2)
6.8
(5.2–8.7)
32.8
(25.0–41.7)
36.9
(26.0–49.3)
25.6
(15.3–39.5)
3.2
(2.5–4.1)
3.3
(2.4–4.7)
2.7
(1.8–4.1)
6
.3
(5.3–7.4)
6.7
(5.3–8.3)
5.0
(3.8–6.5)
9.8
(8.6–11.3)
10.3
(8.5–12.3)
9.0
(7.2–10.9)
Jordan,
1999
34.3
(32.5–36.2)
44.1
(41.1–47.1)
24.3
(22.2–26.6)
38.3
(35.0–41.7)
40.8
(36.4–45.4)
33.6
(28.8–38.8)
16.6
(15.1–18.1)
22.0
(19.6–2
4.7)
9.9
(8.5–11.6)
9.5
(8.3–10.7)
12.0
(10.2–14.2)
6.3
(5.2–7.8)
8.8
(7.5–10.2)
11.2
(8.9–14.0)
7.1
(5.7–8.8)
Jordan,
2003
39.4
(37.5–41.4)
44.8
(41.9–47.8)
32.8
(30.3–35.5)
34.9
(31.8–38.2)
38.3
(33.9–42.9)
30.1
(25.6–35.0)
17.7
(16.2–19.4)
21.4
(19.0–2
4.1)
12.6
(10.8–14.7)
19.9
(18.4–21.6)
21.4
(19.0–23.9)
18.2
(16.1–20.5)
18.0
(16.1–20.0)
21.5
(18.4–25.0)
14.9
(12.7–17.5)
Jordan,
2007
26.6
(24.3–29.0)
33.2
(29.2–37.5)
19.8
(17.3–22.5)
30.7
(26.0–35.7)
32.2
(25.4–39.7)
29.6
(23.4–36.6)
10.3
(8.8–12.1)
13.2
(10.5–16
.5)
7.1
(5.6–9.0)
21.6
(19.5–23.8)
23.1
(19.6–26.9)
18.9
(16.6–21.6)
15.8
(13.7–18.2)
17.1
(13.4–21.6)
15.1
(12.7–17.8)
Kuwait,
2001
22.8
(21.5–24.1)
31.3
(29.1–33.7)
14.6
(13.2–16.1)
32.2
(29.2–35.4)
33.5
(29.5–37.7)
27.5
(22.8–32.7)
10.0
(9.1–11.0)
14.8
(13.1–16
.6)
4.9
(4.1–5.9)
16.2
(15.1–17.4)
19.1
(17.3–21.1)
12.9
(11.6–14.4)
13.7
(12.5–14.9)
16.2
(14.1–18.5)
12.2
(10.8–13.7)
Kuwait,
2005
25.9
(24.2–27.7)
36.7
(33.8–39.8)
16.3
(14.4–18.4)
33.6
(29.9–37.6)
33.9
(29.2–39.1)
31.6
(25.6–38.3)
10.8
(9.6–12.2)
17.7
(15.4–20
.2)
4.5
(3.5–5.8)
14.5
(13.1–16.0)
17.4
(15.1–19.9)
11.7
(10.1–13.6)
12.9
(11.4–14.6)
16.4
(13.7–19.6)
10.9
(9.2–12.9)
Lebanon,
2001
27.3
(25.6–29.1)
33.3
(30.5–36.2)
22.8
(20.7–25.0)
39.8
(36.2–43.6)
43.2
(38.1–48.5)
35.9
(30.8–41.2)
7.5
(6.5–8.6)
10.4
(8.7–12.4
)
5.3
(4.3–6.5)
33.4
(31.6–35.2)
38.7
(35.9–41.6)
29.4
(27.2–31.8)
12.6
(11.2–14.2)
15.8
(13.3–18.7)
10.4
(8.8–12.2)
Lebanon,
2005
26.9
(25.0–28.9)
35.8
(32.6–39.2)
19.1
(16.9–21.4)
39.5
(35.3–43.8)
38.9
(33.5–44.8)
40.9
(34.7–47.5)
8.6
(7.4–9.9)
11.8
(9.8–14.2
)
5.6
(4.5–7.1)
33.8
(31.8–35.9)
38.3
(35.1–41.6)
29.9
(27.4–32.5)
17.2
(15.4–19.2)
19.2
(16.1–22.7)
15.7
(13.5–18.1)
Libya,
2003
12.3
(10.5–14.4)
19.2
(16.0–22.8)
5.2
(3.7–7.3)
37.8
(29.8–46.6)
42.0
(32.4–52.3)
28.5
(14.8–47.8)
4.1
(3.1–5.4)
7.3
(5.3–9.8)
0.8
(0.
3–2.0)
9.8
(8.2–11.7)
11.7
(9.2–14.7)
7.5
(5.6–9.9)
16.0
(13.8–18.4)
20.1
(16.5–24.2)
12.0
(9.5–15.0)
Libya,
2007
13.1
(11.1–15.4)
19.9
(16.3–24.0)
5.8
(4.3–7.8)
39.2
(30.8–48.3)
44.0
(33.5–55.1)
20.6
(10.3–36.9)
4.6
(3.4–6.2)
7.8
(5.5–10.7)
0.9
(0
.4–1.9)
7.2
(5.7–8.9)
8.6
(6.3–11.7)
5.6
(4.1–7.6)
16.3
(14.1–18.9)
20.3
(16.4–24.9)
12.5
(10.2–15.3)
Morocco,
2001
9.6
(8.4–11.0)
13.8
(11.8–16.0)
4.8
(3.6–6.50
31.1
(24.9–38.2)
37.2
(29.6–45.5)
10.9
(4.3–24.8)
2.6
(1.9–3.4)
3.9
(2.8–5.3)
1.0
(0.5
–1.9)
9.2
(8.0–10.6)
10.4
(8.6–12.4)
7.6
(6.0–9.6)
8.5
(7.2–9.8)
12.0
(10.0–14.4)
4.8
(3.5–6.4)
Morocco,
2006
9.5
(8.2–10.9)
13.6
(11.4–16.0)
4.6
(3.4–6.0)
34.7
(27.7–42.5)
35.8
(27.4–45.3)
33.7
(21.1–49.0)
3.5
(2.8–4.5)
4.3
(3.1–6.0)
2.1
(1.
3–3.2)
9.0
(7.8–10.4)
10.3
(8.4–12.5)
6.9
(5.5–8.6)
Not
asked
Oman,
2002
14.4
(12.3–16.7)
25.2
(21.2–29.6)
6.6
(4.9–8.9)
42.5
(34.5–50.9)
60.0
(42.0–61.8)
17.9
(8.3–34.6)
6.8
(5.4–8.6)
14.2
(11.1–17.9)
1.8
(0
.9–3.5)
5.5
(4.2–7.1)
10.7
(8.0–14.2)
1.5
(0.8–2.8)
8.8
(7.1–10.9)
11.9
(8.6–16.2)
7.2
(5.3–9.6)
Pakistan,
2003
3.7
(2.9–4.7)
7.2
(5.5–9.4)
1.2
(0.7–2.1)
26.0
(16.8–37.9)
26.5
(16.2–40.1)
13.8
(3.4–41.9)
0.6
(1.3–1.2)
1.3
(0.6–2.5)
0.2
(0.1–0.
7)
4.4
(3.5–5.4)
5.8
(4.4–7.8)
3.3
(2.3–4.6)
3.1
(2.3–4.1)
5.5
(4.0–7.4)
1.6
(0.9–2.9)
Pakistan,
2004
(Kasur)
9.7
(8.2–11.4)
13.6
(11.6–16.0)
0.9
(0.3–2.5)
24.7
(17.7–33.4)
25.0
(17.8–33.9)
20.5
(0.4–94.8)
1.1
(0.6–1.8)
1.3
(0.8–2.3)
0
5.9
(4.7–7.3)
7.1
(5.
5–8.9)
2.7
(1.5–4.8)
2.8
(2.0–3.9)
3.3
(2.2–4.8)
2.1
(1.1–4.1)
Pakistan,
2004
(Quetta)
12.0
(10.0–14.4)
19.1
(15.5–23.3)
5.9
(4.1–8.7)
47.7
(37.9–57.8)
49.4
(37.8–61.1)
44.5
(25.3–65.5)
0.9
(0.5–1.9)
1.6
(0.7–3.6)
0.3
(0.1–1.8)
10.9
(9.0–13.2)
13.4
(10.4–17.1)
8.3
(6.1–11.2)
4.8
(3.5–6.5)
6.7
(4.5–10.0)
3.2
(1.9–5.3)
Pakistan,
2004
(Peshawar)
8.6
(7.1–10.4)
11.8
(9.7–14.3)
3.8
(2.2–6.5)
26.2
(18.4–35.8)
28.5
(19.8–39.1)
11.0
(1.1–58.0)
1.0
(0.5–2.0)
0.9
(0.4–2.0)
0.8
(0.2–3.6)
5.0
(3.9–
6.4)
7.0
(5.4–9.0)
1.4
(0.6–3.3)
2.5
(1.7–3.6)
2.9
(1.9–4.4)
1.5
(0.6–3.6)
Pakistan,
2008
7.6
(5.6–10.3)
11.8
(8.3–16.5)
2.7
(1.4–5.0)
29.4
(17.4–45.1)
29.8
(16.2–48.1)
24.6
(4.6–68.4)
2.0
(1.1–3.8)
3.2
(1.8–6.7)
2.7
(0.5
–18.1)
0.9
(0.4–2.0)
0.7
(1.2–2.8)
0.4
(0.1–1.7)
5.9
(4.3–8.1)
7.9
(5.4–11.5)
4.0
(2.3–6.9)
Qatar,
2004
22.4
(20.7–24.3)
30.4
(27.5–33.4)
16.2
(14.1–18.5)
37.6
(33.2–42.1)
35.4
(29.9–41.2)
39.7
(32.6–47.2)
6.4
(5.4–7.5)
10.7
(8.8–12.9)
2
.8
(2.0–3.9)
13.7
(12.3–15.3)
15.9
(13.7–18.3)
11.9
(10.2–14.0)
12.8
(11.3–14.6)
14.1
(11.7–17.0)
12.0
(10.1–14.3)
Qatar,
2007
20.7
(18.1–23.6)
29.9
(25.1–35.1)
15.5
(12.5–19.1)
34.1
(27.3–41.5)
33.7
(24.8–44.0)
31.1
(21.3–42.9)
6.5
(5.1–8.3)
13.4
(10.0–17.8)
2.3
(1.3–4.1)
10.9
(9.0–13.2)
13.5
(10.2–17.7)
6.5
(4.6–9.2)
8.9
(7.0–11.4)
14.3
(10.4–19.4)
6.6
(4.5–9.6)
Saudi
Arabia,
2001
0
28.2
(25.4–31.0)
0
0
42.2
(36.4–48.3)
0
0
4.7
(3.6–6.2)
0
0
10.3
(8.6–12.3)
0
0
15.0
(12.5–17.8)
0
Saudi
Arabia,
2007
26.1
(24.4–27.9)
35.8
(32.8–38.8)
16.1
(14.2–