VERA VERIFICATION
STATEMENT
VERIFICATION OF ENVIRONMENTAL TECHNOLOGIES FOR
AGRICULTURAL PRODUCTION
It is hereby stated that
Technology: Farm AirClean BIO Flex 3-stage
(with maximum capacity of 2100 m3 air m-2 front surface h-1)Manufactured by: SKOV A/S
has been tested according to the VERA test protocol for Air Cleaning Technologies version 1, September 2010. The following main results have been documented through the test:
Verified environmental efficiency:
Ammonia emission reduction efficiency at 87 % when applied for finishing pig units
Odour emission reduction efficiency at 81 % and no smell of raw gas when applied for finishing pig units Total dust emission reduction efficiency at 73 % when applied for finishing pig units
Verified operational stability:
The Farm AirClean BIO Flex system has demonstrated a satisfactory operational stability
_______________________________________________________________________
Mr. Peter Engel, Head of the International VERA Secretariat
Exemption of liability
The VERA Secretariat does not endorse, certify or approve technologies. VERA verifications are based on an evaluation of the technology performance under spe-cific, predetermined criteria and the appropriate quality assurance procedures. VERA as a representative for the Danish EPA, the German Federal Ministry of Food, Agriculture and Consumer Protection and the Dutch Ministry of Infrastruc-ture and Environment make no expressed or implied warranties as to the perfor-mance of the technology and do not certify that a technology will always operate as verified.
The end user is solely responsible for complying with any and all applicable federal, state, and local requirements. Further the end user must be aware that the countries involved in VERA are having different legal requirements which will influence the status and use of this verification statement in each country.
The VERA organisation
VERA – Verification of Environmental Technologies for Agricultural Production – is an inter-national organisation for test and verification of environmental technologies for agricultural production. VERA is established as a co-operation between the Danish Environmental Protec-tion Agency, the Dutch Ministry of Infrastructure and Environment and the German Federal Ministry of Food, Agriculture and Consumer Protection.
The purpose of VERA is to enhance a well-functioning market for environmental technologies to increase the environmental protection of agricultural production by substantially accelerat-ing the acceptance and use of improved and cost-effective environmental technologies. VERA verifies the performance of technologies by carrying out tests according to pre-defined test protocols. A VERA Verification Statement secures validated documentation for the en-vironmental efficiency and operational stability of the technology and is an important step in introducing the technology to the market. Based on information from the test reports, the VERA Verification Statement gives a general and short description of the technology, its prin-ciple of operation, and the main results and conclusions from the VERA test.
Applicant data
Technology type Biological air cleaner with maximum capacity of 2100 mm-2 front surface h-1 for finishing pig units 3 air Applied for Reduction of ammonia, odour and dust from exhaust air of forced-ventilated animal housing systems Technology name Farm AirClean BIO Flex 3-stage
Company SKOV A/S
Contact person Niels Riis
Adress Hedelund 4, DK-7870 Roslev, Denmark
Website www.skov.com
Phone +45 72 17 55 55
E-mail [email protected]
Test institute
Pig Research Centre (VSP), Danish Agriculture and Food Council, Denmark and Deutsche Landwirtschafts-Gesellschaft e.V. (DLG), Test Center, Technology and Farm Inputs, Germany.
Technology Description
The Farm AirClean BIO Flex 3-stage is a biological air cleaning system consisting of three rows of moistened cellulose pads, which are positioned vertically. Air is cleaned by a biologi-cal process that works by exhaust air being removed from the house through cleaning filters sprinkled with recirculated water. The unwanted substances in the air are absorbed by the water or decompose when they come in contact with the water and the layer of bacteria on the cleaning filters.
Both the first and second stage of the air cleaner consists of 15 cm thick cellulose packed fil-ters, while the third filter is 60 cm thick. Each filter is 5.0-5.4 m wide and 2.0 m high. The air cleaning system has a maximum capacity of 2100 m3 air m-2 front surface h-1 for finishing pig units.
The biological process is controlled by a computer, which monitors the chemical composition of the water. The first two filter steps are sprinkled with water that is recirculated from a sump below each filter step, while the third filter step is only moistened by the moisture in the air that has passed through the first two filter steps. Clean water is fed into the sump below the second filter step, from which it over-flows into the sump below the first filter step. Addition of fresh water is controlled by the water level in the sump below the first filter step. All water from the air cleaner is discharged from the sump below the first filter step and is either col-lected or directed to the slurry storage tank. The discharge of water from the sump below the first filter step is regulated by the conductivity in the sump below the second filter step. An automatic washer is installed between the first and the second filter steps that wash the first filter from the back against the ventilation airflow at regular intervals. This removes dust and redundant biomass. Biological odour separation occurs at the third stage. A perforated plate is installed in front of the first filter as a flow straightener to ensure a steady air flow and to pre-separate dust.
Test Design
The Farm AirClean BIO Flex 3-stage was tested in Denmark by Pig Research Centre (VSP) and in Germany by the Deutsche Landwirtschafts-Gesellschaft e.V. (DLG). The two tests are in the following named test site 1 and 2, respectively. In each country the biological air cleaner was tested at one farm location by installing the air cleaner in a pig finishing house. Measure-ments of ammonia, odour and dust were performed during an 8 weeks summer period and an 8 weeks winter period. Additionally, key parameters were continuously logged and the system was monitored over a period of one year to create a basis for an evaluation of the operational stability of the system.
In the test by VSP (test site 1) the number of animals in the house was 350 pigs. Summer meas-urements were carried out from August to September 2010 and the winter measmeas-urements were carried out from February to April 2011. The maximum capacity was 3600 m3 air m-2 front surface h-1 for finishing pig units and the width of the filter was 5.0 m.
In the test by DLG (test site 2) the number of animals in the house was 180 pigs. Summer measurements were carried out from May to June 2009 and the winter measurements were carried out from December 2009 to January 2010. The maximum capacity was 2100 m3 air m-2 front surface h-1 for finishing pig units and the wide of the filter was 5.4 m. The average ammo-nia emission measured in the air before the air cleaner was 0.35 g NH3-N/hour/animal.
The two test reports from the two tests in combination constitute the foundation for a full VERA test.
Test Results
Environmental Efficiency
Ammonia reduction
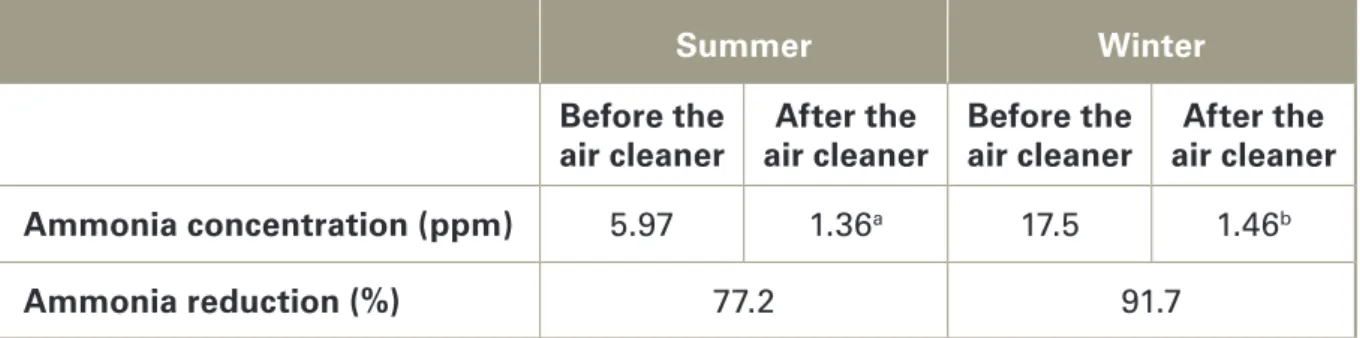
Table 1 presents the ammonia concentration measured at test site 1. Table 2 presents the am-monia emission reduction efficiency of the Farm AirClean BIO Flex 3-stage for both test site 1 and 2 and the overall mean for application at finishing pig units.
Table 1: Ammonia concentration measured at test site 1 before and after the air cleaner dur-ing the summer and winter test periods. The ammonia reduction for test site 1 is calculated accordingly.
Summer Winter
Before the
air cleaner air cleanerAfter the Before the air cleaner air cleanerAfter the
Ammonia concentration (ppm) 5.97 1.36a 17.5 1.46b
Ammonia reduction (%) 77.2 91.7
a Limit of quantification (LOQ) was 1.08 ppm b Limit of quantification (LOQ) was 1.35 ppm
Table 2: Reduction percentages of ammonia by the air cleaner given for test site 1 and 2, respec-tively, and as the overall mean.
Ammonia reduction (%) Mean
Test site 1 84.4
Test site 2 89.0a
Overall 86.7
a Raw data not available
The ammonia emission was on average reduced with 87 %, when air was passed through the filter.
Odour reduction
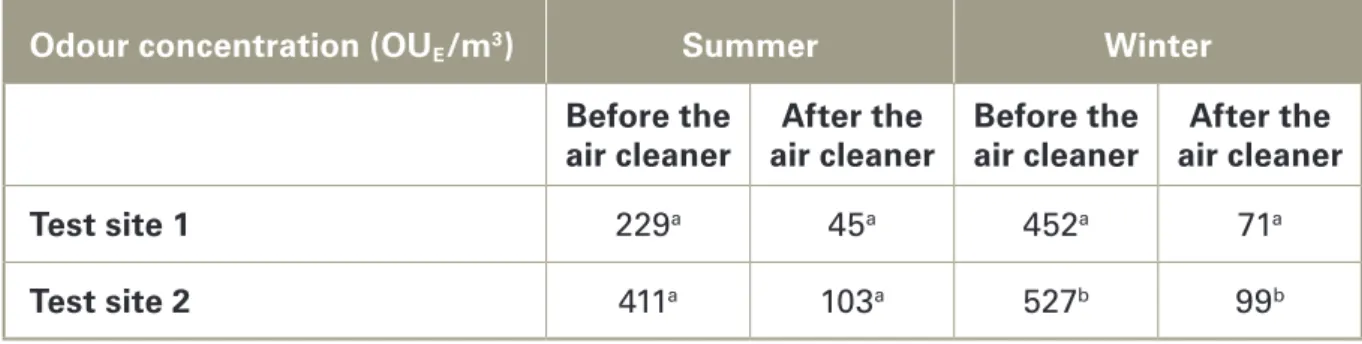
Table 3 presents the odour concentration measured at test site 1 and 2 while table 4 presents the odour emission reduction efficiency for both test site 1 and 2 and the overall mean.
Table 3: Odour concentration measured at the two test sites before and after the air cleaner during the summer and winter test periods.
Odour concentration (OUE/m3) Summer Winter
Before the
air cleaner air cleanerAfter the Before the air cleaner air cleanerAfter the
Test site 1 229a 45a 452a 71a
Test site 2 411a 103a 527b 99b
a Average of 8 measurement days b Average of 7 measurement days
Table 4: Reduction percentages of odour by the air cleaner given for test site 1 and 2, respec-tively, and as the overall mean.
Odour reduction (%) Mean
Test site 1 82.3
Test site 2 79.7
Overall 81
The odour emission was on average reduced with 81 %, when air was passed through the air cleaner.
Odour characteristics
Concerning odour characteristics no smell of raw gas was found after the air had passed the air cleaner.
Dust reduction
The total dust concentration was measured at one test site during both summer and winter (Table 5). The total dust emission reduction is presented in table 6.
Table 5: Total dust concentration measured over 24-hour periods at one test site before and after the air cleaner during the summer and winter test periods. N=2 on each measurement day.
Total dust (mg/m3) Summer Winter
September September July March
Before the air cleaner 1.4 1.6 0.47 2.3
Table 6: Reduction percentages of total dust in the air cleaner given for each summer and winter measurement day and as a mean for each season and the overall mean.
Total dust reduction (%) Summer Winter
September September July March
Each measurement day 71.4 66.9 55.3 80.4
Each season 64.5 80.4
Overall mean 72.5
The air cleaner removed dust from the air passing the filters. The air cleaner showed a total dust removal efficiency of 73 %.
Operational Stability
The test proved that the air cleaning system had satisfying operational stability. The Farm AirClean BIO Flex 3-stage is delivered with a complete user manual, which describes relevant directions for system operation, maintenance and safety. The air cleaning process is monitored by a computer which monitors consumption and alarm limits (water level, conductivity, pH, washer, pressure, leakage, drainage). In addition to weekly inspections of the filter by the user, the test showed a periodic need for manual washing of the filter.
The functionality and the operational stability of the Farm AirClean BIO Flex system can be checked by relevant authorities by inspecting the run time, EC and water supply. These parame-ters can be controlled by checking the log files from the computer that regulate and monitors the system. As a starting point, the system should continuously consume water and keep EC below 15 mS/cm in filter 2 with reservation for temporary stops in relation to maintenance and service. A continuously addition of water is expected when house air is passing the air cleaner in order to compensate for humidification and drainage of water. The volume of water consumed will depend on operation and management of the house, batch plan of pigs, ventilation etc.
Identified Side Effects
Additional Results
None observed.
Additional Information
No additional information.
Test Institutes
Pig Research Centre (VSP), Danish Agriculture and Food Council, Axeltorv 3, 1609 København V, Denmark.
Tel: +45 3339 4000, E-mail: [email protected]
DLG e.V, Test Center, Technology and Farm Inputs, Max-Eyth-Weg 1, 64823 Groβ-Umstadt, Germany. Tel: +49 (0)69 24788-600, E-mail: [email protected]
Validity and terms of use
Validity
This VERA Verification Statement is only valid for the specific verified product/technology and the tested animal category. There is no time limit for the validity of this VERA Verification Statement as long as the product/technology stays unmodified.
The International VERA Secretariat can, however, at any time invalidate the VERA Verifica-tion Statement if it is found to be misused or if significant modificaVerifica-tions have been made to the product/technology that are estimated to have a negative effect on the environmental efficiency or operational stability. In regard to the latter the VERA Secretariat can require that a new VERA test should be performed.
Terms of use
The use of this VERA Verification Statement must be in compliance with these terms: • SKOV A/S must inform the VERA Secretariat if any modifications are applied to the
tech-nology that can significantly influence the environmental efficiency and/or the operational stability
• This verification cannot be considered an endorsement, approval, authorization or warranty of any kind, and the performance parameters provided cannot be extended to other applica-tions or to other technologies
• SKOV A/S agrees not to use this VERA Verification Statement, the test reports, or to refer to those for any other technology than the one specified in the statement.
• The VERA Verification Statement will be made available for public access at the VERA website: www.veracert.eu.
• All other information obtained or produced during the verification process is considered confidential and will not be made available for others than the part owning the intellectual property rights.
Verified by
The test results and the two test reports has been evaluated by independent Dutch and Danish experts according to the VERA Test Protocol for Air Cleaning Technologies (Version 1, September 2010).
Contact Information
This VERA Verification Statement is issued by The International VERA Secretariat
Kollegievej 6
DK-2920 Charlottenlund Denmark