Drink Driving:
Young Drivers and
Accident Research Unit - Medical University Hannover (D) Austrian Road Safety Board (A)
Automobile and Travel Club Germany (D) Belgian Road Safety Institute (B)
Birmingham Accident Research Centre, University of Birmingham (UK) Centre for the Study of Human Factors in Road Accidents (CESDUIS), University of Modena e Reggio Emilia (I)
Centro di ricerca per il Trasporto e la Logistica (CTL), University of Rome “La Sapienza” (I)
Centro Studi Città Amica, University of Brescia (I) Chalmers University of Technology (S)
Comité Européen des Assurances (Int)
Commission Internationale des Examens de Conduite Automobile (Int) Confederation of Organisations in Road Transport Enforcement (Int) Czech Transport Research Centre (CZ)
Dutch Safety Investigation Board (NL)
European Federation of Road Accident Victims (Int) Fédération Internationale de Motocyclisme (Int)
Finnish Motor Insurers’ Centre, Traffi c Safety Committee of Insurance Companies (Fin)
Finnish Vehicle Administration Centre VALT (Fin) Folksam Research (S)
Foundation for the Development of Civil Engineering (PL) Fundación Instituto Tecnológico para la Seguridad del Automóvil FITSA (E)
German Insurance Association (D) German Road Safety Council DVR (D) Hellenic Institute of Transport (HIT) (GR)
Institute for Transport Studies, University of Leeds (UK)
Institute of Traffi c and Road Safety, University of Valencia INTRAS (E) Irish National Safety Council (IE)
Motor Transport Institute (PL) Nordic Traffi c Safety Council (Int)
Parliamentary Advisory Council for Transport Safety PACTS (UK) Prévention Routière (F)
Road and Safety (PL)
Road Safety Institute Panos Mylonas (GR)
Swedish National Road and Transport Research Institute (VTI) (S) Swedish National Society for Road Safety (NTF) (S)
Swiss Council for Accident Prevention BfU (CH)
Netherlands Research School for Transport, Infrastructure and Logistics TRAIL (NL)
University of Lund (S)
Vehicle Safety Research Centre, University of Loughborough (UK)
Members
Professor Herman De Croo (Chairman) Professor Manfred Bandmann
Professor Richard Allsop
Professor Pieter van Vollenhoven Professor G. Murray Mackay
Paolo Costa, MEP
Dr. Dieter-Lebrecht Koch, MEP Inés Ayala Sender, MEP Dirk Sterckx, MEP
Board of directors
Antonio Avenoso
Executive director
Ellen Townsend, Policy Director Timmo Janitzek, Policy Offi cer
Evgueni Pogorelov, Communications Offi cer Paolo Ferraresi, Financial Offi cer
Graziella Jost, Programme Manager Marco Popolizio, Project Offi cer Gabriel Simcic, Project Offi cer Daniel Ugarte, Project Offi cer Roberto Cana, Support Offi cer
Secretariat
For more information about ETSC’s activities, and membership, please contact
ETSC
Avenue des Celtes 20 B-1040 Brussels Tel. + 32 2 230 4106 Fax. +32 2 230 4215 E-mail: information@etsc.be Internet: www.etsc.be ISBN-NUMBER: 9789076024301
Drink Driving:
Young Drivers and
Recidivist Offenders
Written by:
Acknowledgements
ETSC is grateful for the contributions of all national experts and ETSC members to this report. This report would not have been possible without their kind support.
ETSC is grateful for the fi nancial support provided for this report by Diageo. The contents of this publication, however, are the sole responsibility of ETSC and do not necessarily refl ect the view of the sponsor.
The European Transport Safety Council
The European Transport Safety Council (ETSC) is an international non-governmental organisation which was formed in 1993 in response to the persistent and unacceptably high European road casualty toll and public concern about individual transport tragedies. Cutting across national and sectoral interests, ETSC provides an impartial source of advice on transport safety matters to the European Commission, the European Parliament and, where appropriate, to national governments and organisations concerned with safety throughout Europe.
ETSC brings together experts of international reputation and representatives of a wide range of national and international organisations with transport safety interests to exchange experience and knowledge and to identify and promote research-based contributions to transport safety.
ETSC’s work is fi nanced by its members, through projects co-funded by the European Commission as well as private sector sponsorship. ETSC’s sponsorship consortium currently consists of 3M, BP, Diageo, KeyMed, Shell International, Toyota and the Volvo Group.
Executive Director:
Antonio Avenoso
Board of Directors:
Professor Herman De Croo (Chairman) Professor Manfred Bandmann
Professor Richard Allsop Professor Pieter van Vollenhoven Professor G. Murray Mackay
Paolo Costa, MEP
Dr. Dieter-Lebrecht Koch, MEP Inés Ayala Sender, MEP Dirk Sterckx, MEP
3
Contents
Acknowledgements ...2
Executive Summary ...4
1 Introduction
...5
2 Why is drinking and driving a problem? ...5
2.1 Alcohol consumption in Europe ...5
2.2 How is alcohol influencing driving skills? ...6
2.3 Drink driving in Europe ...7
2.3.1 Prevalence of drink driving ...7
2.3.2 Drink Driving crashes and road deaths ...8
3 EU Alcohol and Drink driving policy ...11
3.1 BAC limit Recommendation ... 11
3.2 Traffic Law Enforcement Recommendation... 11
3.3 EU Alcohol Strategy and Alcohol & Health Forum ...12
4 Young and novice drivers ...13
4.1 Countermeasures ...14
4.1.1 Special alcohol limits ...14
4.1.2 Licensing regimes ...14
4.1.3 Drink driving enforcement ...15
4.1.4 Designated driver Programs ...16
5 High-risk
offenders
...18
5.1 Countermeasures ...18 5.1.1 Rehabilitation programs ...18 5.1.2 Alcohol Interlocks ...19Policy Recommendations ...20
Bibliography ...21Executive Summary
This ETSC policy paper on “Drink Driving: Young Drivers and Recidivist Offenders” gives an overview of why drink driving is a major problem in European road safety. In particular it shows what can be done to prevent two high risk groups – young novice drivers and recidivist offenders – from impaired driving. The paper illustrates how alcohol is affecting driving skills and what the effects on the crash risk are. Moreover, it shows European countries’ progress in reducing drink driving by explaining some current trends in reducing alcohol-related road deaths in several countries.
Focusing on young novice drivers, the paper points out why this group is particularly at risk when driving intoxicated. They pose a greater risk to themselves, their passengers and to other road users compared to other drivers. It is illustrated which drink driving countermeasures could be introduced in an attempt to reduce drinking and driving of young or inexperienced drivers.
Focusing on recidivist offenders, it is shown why this group – although representing only a small proportion of all drivers - contributes disproportionately to road accidents. Measures that can be taken to prevent this high risk group from driving under the infl uence of alcohol are explained.
5
1
Introduction
Every year, about 40,000 people die in the European Union as a consequence of road crashes. Drink driving continues to be an important cause of road traffi c crashes, contributing annually to at least 10,000 deaths on EU roads (25% of road deaths). The EU has the goal of halving the number of people killed on European roads from 50,000 in the year 2000 to 25,000 by 2010, and efforts to curb drink-driving can make a substantial contribution to achieving this objective. Young drivers and recidivist offenders are a particular risk group of drink drivers.
Against this background, the European Transport Safety Council set up the Drink Driving Policy Network in 2007. This programme aims at contributing to the reduction of alcohol-related road deaths and injuries. It focuses particularly on strategies to address the issue of high-BAC recidivist drunk drivers and young and novice drivers, as both are a particular risk group of drink drivers with a high risk for an involvement in alcohol-related crashes.
Drink driving causes at least 10,000
road deaths in the EU annually.
2
Why is drinking and driving a problem?
2 . 1
A L C O H O L C O N S U M P T I O N I N E U R O P E
Drinking alcohol is popular throughout the EU, although there are considerable differences between the EU Member States. Figure 1 shows the alcohol consumption (litres of pure alcohol per year) of European states over the years 2000-2003. In countries like Sweden and Malta for example the alcohol consumption per capita is considerably lower than in Luxemburg, the Czech Republic and Ireland.
Fig. 1: Alcohol consumption in Europe, adults aged 15 and over, 2000-2003
Source: WHO 2006 0 2 4 6 8 10 12 14 16 18 20 United Kingdom Sweden Spain Slovenia Slovakia Romania Portugal Poland Netherlands Malta Luxembourg Lithuania Latvia Italy Ireland Hungary Greece Germany France Finland Estonia Denmark Czech Republic Cyprus Bulgaria Belgium Austria 2000 2001 2002 2003
2 . 2
H O W I S A L C O H O L I N F L U E N C I N G D R I V I N G S K I L L S ?
Alcohol has immediate effects on the brain (Table 1). After drinking, the brain works ineffi ciently, taking longer to receive messages from the eye; processing information becomes more diffi cult and instructions to the muscles are delayed. Alcohol results in poor judgment, increased reaction time, lower vigilance and decreased visual acuity (GRSP 2007). The reaction time, for example, can be reduced by 10 to 30 per cent (IAS 2007). At the same time, it reduces the ability to perform two or more tasks. Alcohol also lowers blood pressure and depresses consciousness and respiration.
Tab. 1: Effects of BAC on the body and performance
BAC (g/l) Effects on the body
0.1 – 0.5 Increase in heart and respiration rates Decrease in various brain centre functions
Inconsistent effects on behavioural task performances Decrease in judgment and inhibitions
Mild sense of elation, relaxation and pleasure 0.6 – 1.0 Physiological sedation of nearly all systems
Decreased attention and alertness, slowed reactions, impaired coordination and reduced muscle strength
Reduced ability to make rational decisions or exercise good judgment Increase in anxiety and depression
Decrease in patience 1.0 – 1.5 Dramatic slowing of reactions
Impairment of balance and movement Impairment of some visual functions Slurred speech
Vomiting, especially if this BAC is reached rapidly
1.6 – 2.9 Severe sensory impairment, including reduced awareness of external stimulation Severe motor impairment, e.g. frequently staggering or falling
3.0 – 3.9 Non-responsive stupor Loss of consciousness
Anaesthesia comparable to that for surgery Death (for many)
≥ 4.0 Unconsciousness Cessation of breathing
Death, usually due to respiratory failure Source: GRSP 2007
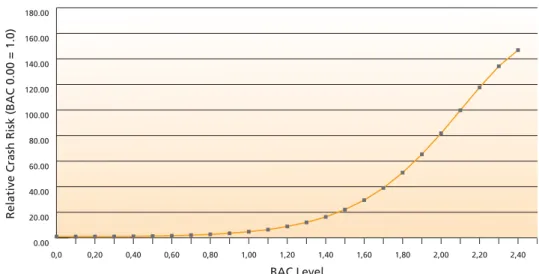
Alcohol impairment has a signifi cant effect on the crash risk of drivers, riders and pedestrians (Figure 2). It is routinely reported as one of the most serious contributing factors to road crashes. Drivers who have been drinking have a much higher risk of involvement in crashes than those with no alcohol in their blood (GRSP 2007). It has been estimated that a Blood Alcohol Content (BAC) of 0.8 g/l increases the crash risk of a driver by 2.7 times compared to having a zero BAC (ERSO 2006a). At a BAC of 1.5 g/l the crash rate becomes even 22 times higher. But also the accident severity grows with increasing BAC. With a BAC of 1.5 g/l the crash rate for fatal crashes is about 200 times higher compared to sober drivers (ERSO 2006a).
Alcohol impairment has a signifi cant
effect on the crash risk of road users.
7 Fig. 2: Crash Risk of Alcohol Impaired Driving
Source: R. P. Compton, et al. “Crash Risk of Alcohol Impaired Driving,” Proceedings of ICADTS T-2002, Vol. I, p. 43.
2 . 3
D R I N K D R I V I N G I N E U R O P E
Drink driving is the second greatest contributory factor of road deaths in the EU after speeding. In the EU as a whole, around 1% of journeys are associated with a BAC of ≥ 0.5 g/l (ERSO 2006a). Drink driving accounts for approximately 25% of all road deaths in the EU and for 30-40% of driver deaths.
2.3.1 Prevalence of drink driving
A reliable comparison of the prevalence of drink driving between EU Member States is impossible as defi nitions of drink drivers and research methods applied differ between EU Member States. However, it is possible to compare drink driving behaviour across the EU by analysing answers from the SARTRE 3 study (SARTRE 2004). In one question of this survey, which was conducted in 23 European countries, drivers were asked: “How many days per week do you drive after drinking even a small amount of alcohol?”. Figure 3 shows the percentage of drivers in each country saying that they never combine drinking and driving.
Fig. 3: The answer ”Never/Non drinker” to the question “How many days per week do you drive after drinking even a small amount of alcohol?”
Sources: SARTRE 2004, ERSO 2006a
0 10 20 30 40 50 60 70 80 90 100 Cyprus France Portugal Switzerland Italy Denmark Slovenia Spain Croatia Greece Austria Germany Netherlands Slovakia Belgium United Kingdom Rep. of Ireland Estonia Czech Republic Finland Sweden Poland Hungary
Drink driving is the second greatest
contributory factor of road deaths in
the EU after speeding.
0,0 0,20 0,40 0,60 0,80 1,00 1,20 1,40 1,60 1,80 2,00 2,20 2,40 0.00 20.00 40.00 60.00 80.00 100.00 120.00 140.00 160.00 180.00
Relative Crash Risk (BAC 0.00 = 1.0)
In Cyprus less than 40% of drivers say that they have always been completely sober when driving, whereas in Hungary more than 90% claim not to have consumed even the smallest amount of alcohol before driving. However, what should be kept in mind when reading these results is that it is self-reported behaviour. Although the SARTRE-questionnaire guaranteed anonymity, people may not always have told the truth.
Moreover, some countries such as the Netherlands, Belgium, Finland, and Estonia try to measure the distribution of alcohol levels among the driver population. To establish this performance indicator, random breath testing actions are repeated regularly at selected times and locations. The Netherlands use the data from these surveys also to estimate the yearly number of deaths from drink driving (AAV 2006). In Belgium, bi-annual measurements were started in 2003. The proportion of drivers found over the 0.5 BAC limit was 3.3% in 2003 and 2.1% in 2005 on average. During weekend nights this was 7.6% in 2005. Figure 4 shows the proportion of drivers impaired by alcohol in the traffi c fl ow in Finland.
Fig. 4: Proportion of drivers impaired by alcohol in all drivers in Finland, 1992-2006
Source: ETSC 2007a
2.3.2 Drink Driving crashes and road deaths
Recording of drink driving crashes and casualties as such tends to be patchy, which makes monitoring of drink driving levels a diffi cult task. There are large differences in the way in which countries defi ne and record a crash related to drink driving (ETSC 2007a). A recent ETSC study examined European countries’ progress in reducing drink driving deaths using two different ranking methods (ETSC 2007a). Uneven progress
Firstly, the study looked at the European countries progress in reducing drink driving deaths compared with progress in reducing other deaths, using each country’s own method of identifying drink driving deaths1. Concerning this method, the study showed that in about one third of countries, progress on drink driving has contributed more than its share to overall reductions in deaths between 1997 and 2005 (Fig. 5). At the top of the ranking are the Czech Republic, Belgium and Germany where progress on drink driving has contributed most to overall reductions in deaths over the last decade. In the 1 There are large differences in the way in which countries defi ne and record a ‘crash related to drink driving’. A comparison of
countries based on numbers of deaths from drink driving crashed is therefore impossible at the moment. See ETSC 2007.
Monitoring of drink driving levels is a diffi cult task.
drunken drivers (BAC >0.5)
some alcohol
0.0 0.2 0.4 0.6 0.8 1.0 1.2 2006 2005 2004 2003 2002 2001 2000 1999 1998 1997 1996 1995 1994 1993 19929
Czech Republic, road deaths from drink driving crashes dropped 11.3% faster than deaths from other crashes. For Belgium, this fi gure is 9.4% and for Germany 6.2%. Poland, Slovakia, the Netherlands, Latvia, Austria, France and Greece also follow this positive trend. These countries have succeeded in reducing deaths from drink driving crashes at the same pace or faster than other deaths, and progress on drink driving has contributed more than its share to overall progress in reducing road deaths. In another group of countries, changes in drink driving deaths have not contributed their share to overall reductions in traffi c deaths. This group includes Sweden, Spain, Hungary, Slovenia, Finland, Great Britain, Estonia, Denmark, Switzerland and Lithuania. In these countries, developments in drink driving deaths have slowed down overall progress in reducing road deaths.
Fig. 5: Yearly percentage change in drink driving deaths relative to other road deaths between 1996-1998 and 2005 in selected countries
Source: ETSC 2007a
* Yearly percentage change in drivers involved in fatal drink driving crashes relative to drivers involved in other fatal crashes (Germany) ** Yearly percentage change in driver deaths from drink driving crashes relative to driver deaths from other crashes (Spain, Sweden) Partial achievement
Secondly, the study measured the decrease in deaths related to drink driving as such, using each country’s own method of identifying drink driving deaths. Concerning this method, the report shows that reductions have been most impressive in the Czech Republic, Belgium, Germany and the Netherlands (Figure 6). In these countries the number of drink driving related deaths has decreased since 1996-98 by more than 50%. Yearly reductions in drink driving deaths between 1996-98 and 2005 were of the order of 12.1% for the Czech Republic, 11.7% for Belgium, 10.4% for Germany and 8.3% for the Netherlands on average. In Hungary, Lithuania, Finland, Spain, Great Britain and Sweden, on the contrary, the drink driving problem actually worsened.
-15 -10 -5 0 5 10 15 Sweden** Spain** Hungary Slovenia Finland Great Britain Estonia Denmark Switzerland Lithuania Greece France Austria Latvia Netherlands Slovakia Poland Germany* Belgium Czech Republic
Fig. 6: Average yearly percentage change in road deaths resulting from crashes related to drink driving between 1996-1998 and 2005.
Source: ETSC 2007a
*Average yearly percentage change in drivers involved in fatal drink driving crashes (Germany) ** Average yearly percentage change in driver deaths from drink driving crashes (Spain, Sweden)
-15 -10 -5 0 5 10 15 Hungary Lithuania Finland Spain** Great Britain Sweden** Slovenia Greece Estonia Switzerland Denmark Austria Slovakia Latvia France Poland Netherlands Germany* Belgium Czech Republic
11
The European Commission has set itself the target of a 50% reduction in road deaths by 2010. It was adopted in the third Road Safety Programme in 2003 which provided the appropriate framework for road safety policy planning in Europe. The programme identifi es three areas of action: the behavior of road users, vehicle safety and improvements of road infrastructure. Concerning drink driving it also included four specifi c measures:
Participate in awareness campaigns including drink driving
Encourage the take up of the BAC Recommendation and continue its work on alcohol
Propose measures to strengthen checks and ensure the police enforcement of the most important
safety rules including drink driving.
Examine driver impairment detection devices.
The EU is also active in promoting best practice via its research programmes. Currently it is supporting a variety of alcohol and driving related research projects including
Alcolock project (completed)
ANDREA – Analysis of Driver Rehabilitation Programmes (completed)
RSPI Road Safety performance Indicators 2004-2008
PEPPER - Police Enforcement Policy and Programmes on European Roads 2006-2008
DRUID Driving Impairments due to alcohol, drugs and medicine 2006-2009
CAST Campaigns and Awareness-raising strategies in Traffi c Safety 2006-2008
3 . 1
B A C L I M I T R E C O M M E N D A T I O N
In January 2001, the Commission adopted a recommendation urging the Member States to prescribe two different BAC limits within the Community. The standard BAC limit for all motor vehicle drivers which should be adopted by all of the Member States was one not exceeding 0.5 mg/ml. In addition a second BAC limits of 0.2 mg/ml was recommended for certain types of driver and vehicle, namely:
inexperienced drivers and more particularly holders of provisional driving licences, learner drivers
accompanied by driving or trainee drivers attending a driving school and novice drivers having held a driving licence for less than two years;
motorcyclists;
drivers of large vehicles, i.e. lorries weighing more than 3.5 tonnes and any passenger vehicle fi tted
with more than eight passenger seats; drivers of vehicles carrying dangerous goods.
The Recommendation states that all of the Member States should adopt a system of random detection by analysing expelled air in order to dissuade drivers from drinking. Moreover, each driver should be exposed to a statistically real probability of being checked at least once every three years. In addition the Commission feels that the Members States should work towards acceptance of the draft Directive on measuring instruments in order to harmonise breathalyser accuracy.
3 . 2
T R A F F I C L A W E N F O R C E M E N T R E C O M M E N D A T I O N
To ensure the proper enforcement of the most important safety rules, the European Commission adopted a Recommendation on Enforcement in the fi eld of road safety in 2004. Enforcement is a means of preventing collisions from happening by way of persuading drivers to comply with the safety rules. It is based on giving drivers the feeling that they run too high a risk of being caught when breaking the rules, regardless of which country they are currently travelling in. Effi cient enforcement strategies are therefore not in the fi rst place about increasing the actual amount of enforcement activity
but about increasing the risk of being caught as perceived by the drivers. In the Recommendation Member States are asked to apply in a national enforcement plan what is known to be best practice in the enforcement of speed, alcohol and seat belt legislation. For drink driving, random breath testing with alcohol screening devices must be applied and evidential breath testing devices used. The impact assessment for the Recommendation showed that improved enforcement of drink driving laws would have the potential to prevent approximately 4,000 deaths and 150,000 injuries annually.
3 . 3
E U A L C O H O L S T R A T E G Y A N D A L C O H O L & H E A L T H
F O R U M
In October 2006 the European Commission adopted a Communication setting out a strategy to support Member States in reducing alcohol-related harm (EC 2006). The priorities identifi ed in the Communication are to:
protect young people and children and the unborn child;
reduce injuries and deaths from alcohol-related road accidents;
prevent harm among adults and reduce the negative impact on the workplace;
raise awareness of the impact on health of harmful alcohol consumption; and on appropriate
consumption patterns
develop a common evidence base at EU level.
The strategy identifi es areas where the EU can support the actions of Member States to reduce alcohol related harm, such as fi nancing projects through the Public Health and Research Programmes, exchanging good practice on issues such as curbing under-age drinking, exploring cooperation on information campaigns or tackling drink-driving and other Community initiatives. Concerning drink driving, the Strategy recommends to introduce maximum BAC limits according to the above mentioned Recommendation (0,5 mg/ml and 0,2 mg/ml for professional and novice drivers). Moreover, the European Commission highlights the importance of effective enforcement of drink driving laws in order to substantially reduce traffi c deaths. Thus, it recommends the introduction and enforcement of frequent and systematic random breath testing, supported by education and awareness campaigns involving all stakeholders. According to the Commission, a combination of strict enforcement and active awareness raising would be a key to success. In the frame of the EU strategy, the Commission, businesses and NGO’s also created a Forum to tackle alcohol-related harm. Moreover, the Forum established two Task Forces on Marketing Communication and Youth-specifi c aspects of alcohol.
13
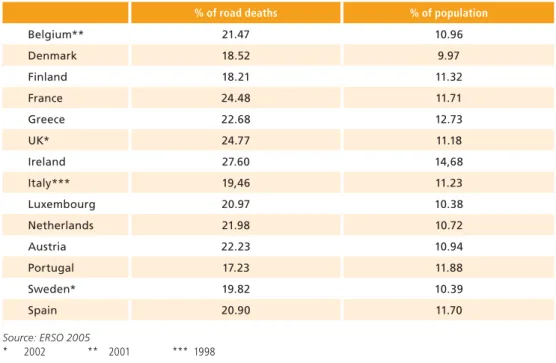
Road accidents are the single biggest killer of 15-24 year olds in OECD countries (ERSO 2006b). In most EU countries, young people are far more likely to be victims of road accidents than people in any other age group. They account for a large part of road victims (Tab. 2).
Road accidents are the single biggest killer of 15-24 year olds in OECD countries.
Tab. 2: Road deaths aged 16-24 by country, in percent (2003)
% of road deaths % of population
Belgium** 21.47 10.96 Denmark 18.52 9.97 Finland 18.21 11.32 France 24.48 11.71 Greece 22.68 12.73 UK* 24.77 11.18 Ireland 27.60 14,68 Italy*** 19,46 11.23 Luxembourg 20.97 10.38 Netherlands 21.98 10.72 Austria 22.23 10.94 Portugal 17.23 11.88 Sweden* 19.82 10.39 Spain 20.90 11.70 Source: ERSO 2005 * 2002 ** 2001 *** 1998
In general, 16-24 year old drivers are greatly overrepresented in crash and road death statistics, with a risk factor 2 to 3 times higher than those of more experienced drivers (ERSO 2006b). The rate of young men is often even higher (SWOV 2007a). They pose a greater risk to themselves, their passengers and to other road users compared to other drivers. The high levels of young driver risk result in principle from factors of inexperience, immaturity and lifestyles associated with their age and gender. In addition to their social and biological immaturity and their lack of driving experience, young drivers are often driving under the infl uence of alcohol. Even when their BACs are not high, young drink drivers are involved in accidents at higher rates than older drivers with similar BACs (NIAAA 1996). Drink driving is particularly dangerous for youngsters due to several reasons (ERSO 2006b):
Their tolerance of alcohol is lower, as their body is not used to its consumption.
Driving is more demanding for young novice drivers than for other drivers; i.e. as they need to pay
more attention to their driving task, the disrupting effect of alcohol is greater than for drivers with more experience.
Alcohol reduces inhibition. As young people possess less developed self-control mechanisms, they
suffer a stronger euphoric and emotional impact from alcohol.
Studies have shown that youngsters tend to underestimate their actual level of intoxication.
Moreover, illicit drug use is on the increase amongst youngsters, in principle resulting in increased crash risk. Particularly the combined use of alcohol and drugs leads to extreme high crash risks (ERSO 2006b).
4 . 1
C O U N T E R M E A S U R E S
4.1.1 Special alcohol limits
As the crash rate for young drivers signifi cantly starts to rise at very low levels, special legal levels of BAC are effective for young and inexperienced drivers. The European Commission recognizes this in its Recommendation to Member States by asking them to introduce a special BAC limit of maximum 0.2 g/l for young and novice drivers.
Zero and low BAC levels have consistently been shown to reduce alcohol related traffi c deaths among youth. A systematic review of the impact of lower BAC laws for young or inexperienced drivers found that the three studies that examined fatal crash outcomes reported declines of 24%, 17%, and 9%; the two studies that examined injury crash outcomes reported declines of 17% and 4%; and the one study that examined crashes in which the investigating police offi cer believed that the driver had been drinking alcohol reported a decline of 11% (Shults et al 2001). Starting from a BAC level of 0.8 g/l, it has been shown that only lowering to 0 or 0.2 g/l was effective, and that lowering BAC levels to 0.4 or 0.6 g/l did not produce signifi cant reductions in alcohol-related road deaths (Hingson et al. 1994). A maximum BAC level of 0 to 0.2 g/l, linked to severe repercussions or high demerit point loss as a result of contraventions, could contribute much towards lowering young driver risk (ERSO 2006b).
4.1.2 Licensing regimes
The general aim of licensing regimes is to exclude individuals with insuffi cient driving ability and competence (OECD/CEMT 2006). Licensing systems are based on laws and regulations referring to the requirements for being licensed (e.g. age, driving aptitude), the quality of licenses (e.g. restrictions), the administrative procedures for licensing (e.g. licensing, withdrawal) and fi tness to drive. Systems differ more or less regarding the items that are tested, the formal procedures and the institutions within the system (ERSO 2006b). In general, two categories of licensing systems can be distinguished: fi rst of all traditional and probationary licensing systems and second of all graduated licensing systems. Traditional and probationary licensing systems
In these systems, drivers are fully licensed after passing a driver test, and no special conditions apply to novice drivers. Thus, traditional licensing systems are often called “single-phase licensing systems” (OECD/ECMT 2006). Most countries using these systems have also introduced a probationary period, which could include restrictions such as zero BAC. Moreover, some countries use “two-phase licensing systems”, in which candidates get a provisional license after having completed a fi rst phase, allowing them to drive solo. Only after completing a second phase of theory and testing, the full license is acquired (ERSO 2006b).
Graduated licensing systems
These systems allow new drivers to acquire driving experience under low risk conditions. Graduated licensing systems (GDL) are primarily designed to address the inexperience component of young and novice drivers’ crash risk but target also risk-taking behavior, which can result from age-related factors (OECD/ECMT 2006). GDL systems are usually divided into three stages: “learner”, “provisional”, and “fully licensed”. Support and restrictions are reduced from stage to stage. With growing experience, more driving privileges are phased in gradually. Most evaluations on the impact of GDL systems have shown that these systems report signifi cant reductions in crashes and road deaths (ERSO 2006b).
Zero and low BAC levels have consistently been shown
to reduce alcohol related traffi c deaths among youth.
15 4.1.3 Drink driving enforcement
Enforcement plays a key role in preventing drink driving. Random and targeted breath testing (RBT) is an effective technique to combat drink driving. In this method drivers are selected purely on the basis of chance and during periods respectively at locations where high alcohol use is expected (e.g. night times and discotheques). RBT increases subjective perception of the possibility of being caught, which affects their drinking and/or driving behaviour. However, according to the SARTRE 3 study, enforcement activity is fairly low across Europe (SARTRE 2004). In this survey, which was conducted in 23 European countries, only 29% of drivers said they had been tested for alcohol over the last three years, whereas 71% of drivers said they had not been tested during the same period.
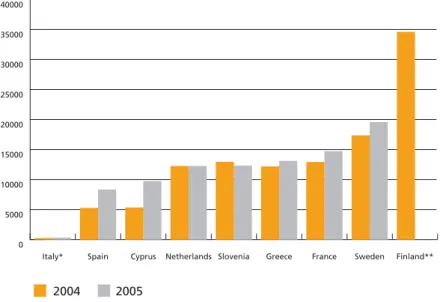
Levels of drink driving enforcement across Europe
ETSC has recently tried to evaluate the levels of enforcement in several EU Member States (ETSC 2006, ETSC 2007b). High levels of drink driving checks were found in Finland, Sweden and France (Fig. 7). In all these countries the police have been empowered to stop and breath test drivers at random. Some forerunner countries such as Sweden, the Netherlands, Finland and Estonia also insist on an alcohol test every time a driver is stopped for whatever reason. Moreover, Finland introduced the so-called blanket testing in 1977. In these road checks a whole road is blocked off and everyone is tested. Today, some other countries like Estonia and Slovenia undertake similar large-scale testing. The aim is to vary time and place and ensure that drivers are aware that they may be tested anytime or anywhere. If random breath testing is applied, drivers will not only feel that they run a high risk of being tested. They will also understand that all blood alcohol levels over the legal limit will be detected in these tests.
If, on the other hand, testing is based on suspicion, chances of being tested are much lower. Moreover, only drivers that have BAC levels far over the limit will be typically apprehended whereas drivers that have BAC levels that are just over the limit will go unpunished (ETSC 2006). Worse still, drivers having an alcohol problem will usually not be recognised as such as they are often very skilful in hiding that fact.
Fig. 7: Drink driving checks per 100,000 inhabitants
Source: ETSC 2006
* data only collected by the Carabinieri and Traffi c Police ** no data for 2005
Enforcement plays a key role
in preventing drink driving.
2004 2005 0 5000 10000 15000 20000 25000 30000 35000 40000 Finland** Sweden France Greece Slovenia Netherlands Cyprus Spain Italy*
Among those countries that have high levels of checks, Sweden, the Netherlands and France report fairly low offences (Fig. 8). In Slovenia, on the other hand, the numbers of offences are still comparatively high. This could be explained by the fact that that Northern and Western European countries introduced random breath testing earlier and offences declined in the long term as a result. Central European Countries – such as Slovenia - introduced this more recently and the levels of offences started to drop later. The example of Slovenia shows that drivers increasingly feel the risk of being tested: while the number of drink driving checks between 2004 and 2005 remained almost stable, the number of offences detected dropped by nearly one third. An explanation for this could be the high visibility of road checks, which are undertaken at road blocks. Special efforts have been made to increase these so that by “word of mouth” the feeling of being detected works to deter risk drivers from drink driving.
Fig. 8: Drink driving offences per 100,000 inhabitants
Source: ETSC 2006
* data only collected by the Carabinieri and Traffi c Police ** no data for 2005
4.1.4 Designated driver Programs
A designated driver can be defi ned as a person at a social gathering who promises to abstain from alcohol so he/she can ensure that others arrive home safely (Ditter et al 2005). Some other defi nitions employ a risk and harm reduction strategy, in which the primary goal is not necessarily abstinence, but to keep the designated driver’s blood alcohol content (BAC) at less than the legal limit (Anderson 2007). Since the 1980s, designated driver programs aimed at reducing alcohol-impaired driving have been widely implemented and promoted in the United States (Ditter et al 2005). In Europe, a designated driver program (the BOB campaign) originated in Belgium in 1995. This was co-fi nanced for a period of 5 years by the European Commission. A total of fourteen countries participated in the last year it was run at a European level in 2006. Many countries still run this campaign at a national level and local initiatives also promote the concept.
Designated driver programs are appealing because they are viewed as simple, pro-social, voluntary, inexpensive, widely applicable, requiring a modest behavioral change, and as translating easily into mass media campaigns to change social norms. Especially the BOB campaign has resulted in widespread recognition and acceptance of the designated driver concept by the general public.
A systematic review was conducted by Ditter et al to assess the evidence of effectiveness of designated driver programs for reducing alcohol-impaired driving and alcohol-related crashes (Ditter et al. 2005). They differentiated between population-based campaigns (i.e. the concept of the campaign is promoted through the mass media) and incentive programs (i.e. campaigns offer free incentives to
2004 2005 0 200 400 600 800 1000 1200 1400 1600 1800 Slovenia Finland** Greece Spain France Cyprus Netherlands Sweden Italy*
17
people in drinking establishments). They only found one evaluation on a designated driver programme that was based on the propagation of this idea via the media (population-based campaign), like the Bob-programmes in Europe. This was the “Pick-a-Skipper” campaign in Western Australia. Telephone survey results indicated a 13% increase in respondents “always” selecting a designated driver, but no signifi cant change in self-reported alcohol-impaired driving or riding with an alcohol impaired driver (Boots & Midford 1999). Seven studies (fi ve of which were reported in the same journal article, and six of which were by the same two principal authors) evaluated the number of patrons who identifi ed themselves as designated drivers before and after programs were implemented, with a mean increase of 0.9 designated drivers per night (Brigham et al. 1995; Meier et al. 1998; Simons-Morton and Cummings 1997). An eighth study reported a 6% decrease in self-reported driving or riding in a car with an intoxicated driver among respondents exposed to an incentive program (Boots 1994). It is very diffi cult to evaluate the effectiveness of designated driver programmes. Interpretation of these results was complicated by the fact that only two of the studies reported the number of patrons or groups of patrons in the bar during each observation period. Thus, although the incentive programs generally found small increases in the number of patrons identifying themselves as designated drivers, the extent to which these changes related to actual designated driver use was unclear. Moreover, it was impossible to estimate the public health effects of observed changes in the number of self-identifi ed designated drivers without information on what their behaviour would have been in the absence of a designated driver program. Thus, due to the small effect sizes observed, and the limitations of the outcome measures, the present evidence is insuffi cient to draw any conclusions about the effectiveness of either type of designated driver promotion program evaluated.
Other campaigns
Nuit European Sans Alcohol (NESA European Nights without alcohol) is another European wide campaign now still being fi nanced by the European Commission. It aims to make young drivers aware of the infl uence of alcohol (and drugs) on driving and to help them to become responsible drivers.
Slovenia runs a drink driving campaigns for two months from November to December. This is launched to coincide with the St. Martin’s Celebrations which traditionally are centered on wine. The 2005 campaign was entitled “Waiter, Taxi please” and also included media and police co-operation. Local Police offi cers spent time going door to door to local pubs to raise the level of understanding of the dangers of drinking and driving with their owners as well as attempting to encourage them to tackle this by for example stopping to serve drunk customers or hiring a mini bus to take them home.
Finland has a similar message with a drink driving campaign carrying the slogan “If you drink alcohol, then take a chauffeur for the trip home”. It started in 2004 and lasted until the end of 2007. It uses radio and TV spots, the internet, newspapers and outdoor advertising. The slogan was also disseminated in pubs and cafes.
The UK’s annual drink drive campaign including an eye-catching young man trapped inside a giant pint glass toured the UK in the run up to Christmas 2007 to raise awareness of the consequences of a drink-drive conviction. The giant glass was taken to key city-centre locations and leafl ets were handed out to the public. The message of the event, which was by the Government’s THINK! campaign, was ‘Don’t let a drink-drive conviction come between you and Christmas’. More information on recent drink driving campaigns can be found in ETSC’s Drink Driving Monitor (www.etsc.be).
5
High-risk offenders
High-risk offenders are defi ned as recidivist offenders of drink driving. In the UK for example, a high-risk offender is categorised by one of the following (Maycock 1997):
A driver who has been disqualifi ed once for driving with an alcohol level in excess of 2.5 times the
legal limit
A driver who has been disqualifi ed twice within a ten year period for any drink drive offence
A driver who has been disqualifi ed for failing to provide a sample for analysis
Research has demonstrated that between 20% and 30% of convicted drink drivers re-offend (Langford 1998; Popkin 1994). High-risk offenders represent only a small proportion of all drivers but contribute disproportionately to road accidents. They are more likely than others to be involved in fatal crashes where alcohol impairment is involved (ICAP 2005). While legal sanctions such as fi nes and licence disqualifi cation periods have been effective in preventing a large proportion of the population from drink driving, high-risk offenders have failed to respond in the same positive way (Marques, Voas & Hodgins 1998). As a result, other measures are being employed as additional countermeasures to avoid drink driving of high risk offenders.
5 . 1
C O U N T E R M E A S U R E S
In particular the following areas can be considered to combat recidivism and recurrence of drink driving.
5.1.1 Rehabilitation programs
Drink driving rehabilitation programs constitute a secondary form of prevention that attempts to directly change offenders’ drink driving behaviour through education and/or treatment aiming at separating drinking from driving (Freeman & Liossis 2002). Some studies have shown that drink driving rehabilitation programs can reduce recidivism and alcohol related crashes (Pratt, Holsinger & Latessa 2000; DeYoung 1997). It has been demonstrated that such programs are most effective for serious repeat offenders who are apprehended with BAC levels of 1.5 g/l or greater (Ferguson et al 2001). Research has shown that rehabilitation programs are most effective in reducing further offences when they are combined with licence disqualifi cation periods (Freeman & Liossis 2002). First, the continued application of fi nes and licence disqualifi cation periods ensures offenders realise the punitive costs associated with re-offending. Second, rehabilitation programs provide recidivist drink drivers with a range of skills and strategies to avoid the drink driving sequence, which include information regarding the effects of alcohol, drink driving laws, safe driving practices and possible indicators of drinking problems. Despite the reported reductions in drink driving behaviour resulting from rehabilitation programs, some ‘hard core’ offenders fail to complete the programs or continue to drink and drive after completing such programs.
Between 20% and 30% of
convicted drink drivers re-offend
19 5.1.2 Alcohol Interlocks
Alcohol Interlocks can form part of a rehabilitation strategy targeting recidivist offenders as they prevent impaired drivers from operating a vehicle. Alcohol interlocks (also termed ‘alcolocks’) are devices that require the driver to take a breath test before starting the car. If the driver fails the test, the device locks the ignition of the car. Internationally the alcolock is considered being a promising measure of reducing drink driving, especially recidivism. Several studies have shown that alcolock programs are more effective than full licence suspension in preventing recidivism (Eurocare 2003). Various studies show 65-90% less repeat offences for users of an alcolock than for drivers with withdrawn licence (SWOV 2007b). In the fi rst years of an alcolock trial in Sweden, no one of the participants was caught drink driving again (Bjerre & Bergman 2004). But there are also problems of alcolock programs. Many countries that introduced alcolock programs report low participation rates of eligible drivers. This is often caused by the fact that these programs are voluntary. In combination with high costs, this has resulted in a participation rate of only 11% in Sweden (Bjerre & Bergman 2004). In criminal law programs that are imposed by law courts the participation rates are often even lower (SWOV 2007b). Another weak point is that the positive effect on recidivism usually disappears completely as soon as the alcolock is removed from the car (Bax et al 2001). However, recent fi ndings from Sweden show that successful completion of the Swedish program appear to have lasting effects in terms of far lower rates of drink driving recidivism rates (Bjerre 2005). Drink drivers who have successfully completed the programme reduce their drink driving recidivism by 60%. Moreover, there is an approximately 80% reduction in the number of police-reported traffi c accidents compared to the situation during the pre-treatment period. The long term effects of the programme are considered to be a better solution in comparison to conventional license revocation. In sum, a possibility of getting a more permanent behavioural change is to combine alcolocks with rehabilitation programs (ERSO 2006a).
Alcolocks are devices that require the driver to
take a breath test before starting the car.
The EU should:
legislate to introduce a limit of maximum 0.2 BAC limit for novice drivers.
Ensure that the new Directive on cross border enforcement aims to achieve high
standards of traffi c law enforcement in the fi eld of drink driving in the EU.
work towards standardized defi nitions of drunk driving and alcohol-related accidents
/ road deaths across the EU.
work towards an EU wide monitoring system for the prevalence of drink driving
act to reduce drinking and driving by supporting a Europe wide campaign and linking
this strongly to increased drink driving enforcement.
include in its future research activities a priority action to evaluate the impact of
designated driver programmes such as the BOB.
Continue their support of NGOs addressing drinking and driving amongst young
people and should especially facilitate their extension in the New Member States.
Member States should:
work towards setting a legal BAC limit of no more than 0.5 g/l for all drivers and
maximum of 0.2 g/l for young novice drivers.
Introduce targeted random breath testing to complement alcohol enforcement based
on suspicion.
ensure that young novice drivers should be subject to probationary periods in
conjunction with higher demerit points which can be assigned for non-compliance
with road rules.
ensure that alcolocks be installed in the cars of fi rst time offenders who are found to
be far in excess of the legal limit (such as 2.5 times) and all recidivists. Essential for
their success is that alcolocks should be combined with driver rehabilitation courses
to achieve a more permanent behavioural change.
21
B I B L I O G R A P H Y
AAV (Adviesdienst Verkeer en Vervoer) 2006: Rijden onder invloed in Nederland 1999-2005. Ontwikkeling van het alcoholgebruik van automobilisten in weekendnachten. Rotterdam, The Netherlands.
Anderson, P. (2007): Reducing Drinking and Driving in Europe. London: Institute of Alcohol Studies Bax, Ch.A. (ed.), Kärki, O., Evers, C., Bernhoft, I.M. & Mathijssen, R. (2001). Alcohol interlock implementation in the European Union; feasibility study; Final report of the European research project. D-2001-20. Stichting Wetenschappelijk Onderzoek Verkeersveiligheid SWOV, Leidschendam.
Bjerre, B. & Bergman, H. (2004): The Swedish ignition interlock programme; is it possible to forecast which DWI offenders will succeed in the programme and which will not? In: Proceedings of the 17th International Conference on Alcohol, Drugs and Traffi c Safety T2004, Glasgow.
Bjerre, B. (2005): Primary and secondary prevention of drink driving by the use of alcolock device and program: Swedish experiences: In: Accident Analysis & Prevention, Volume 37, Issue 6, November 2005, Pages 1145-1152
Boots, K., Midford, R. (1999): “Pick-a-Skipper”: an evaluation of a designated driver program to prevent alcohol-related injury in a regional Australian city. Health Promot Int 1999; 14: 337– 45. Boots, K. (1994): The designated driver program: an outcome evaluation. Health Promot J Austr 1994; 4: 26 –9.
Brigham, T., Meier, S., Goodner, V. (1995): Increasing designated driving with a program of prompts and incentives. J Appl Behav Anal 1995; 28: 83–94.
Deyoung, D. (1997). An evaluation of the effectiveness of alcohol treatment, driver license actions and jail terms in reducing drunk driving recidivism in California. Addiction, 92(8), 989–997.
Ditter, S. M., Elder, R. W., Shults, R. A., Sleet, D. A., Compton, R., Nichols, J. (2005): Effectiveness of designated driver programs for reducing alcohol-impaired driving a systematic review. In: American Journal of Preventive Medicine 2005; 28 (5S).
EC (European Commission) 2006: An EU strategy to support Member States in reducing alcohol related harm. COM(2006) 625 fi nal.
Elvik, R., Vaa, T. (2004): The Handbook of Road Safety Measures. Oslo, Norway.
ERSO (European Road Safety Observatory) (2006a): Alcohol. Retrieved January, 20, 2008. www.erso.eu. ERSO (2005): Traffi c Safety Basic Facts 2005 - Young People (Aged 16-24). Retrieved January, 25, 2007. www.erso.eu.
ERSO (2006b): Novice Drivers. Retrieved January, 20, 2008. www.erso.eu.
ETSC (2006): Traffi c Law Enforcement across the EU. An Overview. Brussels, Belgium ETSC 2007a: Raising Compliance with Road Safety Law. 1st Road Safety PIN Report. Brussels. ETSC 2007b: Traffi c Law Enforcement across the EU. Time for a Directive. Brussels, Belgium. Eurocare (2003): Drinking and driving in Europe. Brussels, Belgium
Ferguson, M., Schonfeld, C., Sheehan, M., Siskind, V. (2001): The Impact of the “Under the Limit” Drink Driving Rehabilitation Program on the Lifestyle and Behaviour of Offenders. Report No. CR 187, Centre for Accident Research and Road Safety, Queensland University of Technology, Australia. Freeman, J., & Liossis, P. (2002): Drink driving rehabilitation programs and alcohol ignition interlocks: Is there a need for more research? Road and Transport Research, 4, 3-13.
GRSP (Global Road Safety Partnership) (2007): Drinking and Driving: a road safety manual for decision-makers and practitioners. Geneva.
Hingson R, Heeren T, Winter M. (1994): Lower legal blood alcohol limits for young drivers. Public Health Reports 109:738–744.
IAS (Institute of Alcohol Studies) (2007): Drinking & Driving. IAS Factsheet. St. Ives.
ICAP (International Center for Alcohol Policies) (2005): ICAP Blue Book Practical Guides for Alcohol Policy and Prevention Approaches. Online only, retrieved 6 February 2008 http://www.icap.org/ Publication/ICAPBlueBook/tabid/148/Default.aspx
ICF Consulting (2003): Costs-Benefi t Analysis of Road Safety. London
Langford, J. (1998): Alcohol ignition interlocks: A background paper. Proceedings of the Road Safety Research, Policing, Education Conference, New Zealand, pp.31–35.
Marques, P.R., Voas, R.B., & Hodgins, D. (1998). Vehicle interlock programs: Protecting the community against the drunk driver, Journal of Prevention and Intervention in the Community, 17(1), 31–44. Maycock, G. (1997). Drinking and driving in Great Britain – a review. TRL Report232. Crowthorne: TRL Limited
Meier, S., Brigham, T., Gilbert, B. (1998): Analyzing methods for increasing designated driving. J Prev Intervention Community 1998;17: 1–14.
NIAAA (National Institute on Alcohol Abuse and Alcoholism) (1996): Alcohol Alert: Drinking and Driving. No. 31 PH. Retrieved at http://pubs.niaaa.nih.gov/publications/aa31.htm
OECD/ECMT (2006): Young Drivers. The Road to Safety. Paris, France
Popkin, C.L. (1994): The deterrent effect of education on DWI recidivism, Alcohol, Drugs and Driving, 10(3–4), 287–294.
Pratt, T.C., Holsinger, A.M., and Latessa, E.J. (2000). Treating the chronic DUI offender ‘turning point’ ten years later, Journal of Criminal Justice, 28, 271–281.
SARTRE (Social Attitudes to Road Traffi c Risks in Europe) 2004: European drivers and road risk – SARTRE 3. Arcueil, France.
Shults, R.A., Elder, R.W., Sleet, D.A., Nicholas, J.L., Alao, M.O., Carande-Kulis, V.G., Zaza, S., Sosin, D.M., Thompson, R.S., and the Task Force on Community Preventive Services (2001): Reviews of evidence regarding interventions to reduce alcohol-impaired driving. American Journal of Preventive Medicine 21, 66-88.
Simons-Morton, B, Cummings, S. (1997): Evaluation of a local designated driver and responsible server program to prevent drinking and driving. J Drug Educ 1997; 27: 321–33.
SWOV (Stichting Wetenschappelijk Onderzoek Verkeersveiligheid) (2007a): Fact Sheet “Young novice drivers”. Leidenscham, The Netherlands.
SWOV (2007b): Fact Sheet “Alcolock”. Leidenscham, The Netherlands.
Zador, P.L., Krawchuk, S.A., Voas, R.B. (2000): Alcohol-related relative risk of driver fatalities and driver involvement in fatal crashes in relation to driver age and gender: an update using 1996 data. Journal of Studies on Alcohol 61:387-95.
23
Notes
... ... ... ... ... ... ... ... ... ... ... ... ... ... ... ... ... ... ... ... ... ... ... ... ... ...Notes
... ... ... ... ... ... ... ... ... ... ... ... ... ... ... ... ... ... ... ... ... ... ... ... ... ...European Transport Safety Council
Avenue des Celtes 20
B-1040 Brussels
tel. +32 2 230 41 06
fax: +32 2 230 42 15
e-mail: information@etsc.be
website: www.etsc.be
ISBN-NUMBER: 9789076024301 P h o to g ra p h : M in is tr y o f I n te ri o r B ra n d e n b u rg • D e si g n : w w w .b e e lz e p u b .c o m