The State of the Estate
in 2012
The State
of the Estate
in 2012
Presented to Parliament pursuant to section 86
of the Climate Change Act 2008
© Crown copyright 2013
You may reuse this information (not including logos) free of charge in any format or medium, under the terms of the Open Government Licence.
To view this licence, go to:
www.nationalarchives.gov.uk/doc/open-government-licence or write to the Information Policy Team,
The National Archives, Kew, London TW9 4DU
email: psi@nationalarchives.gsi.gov.uk
Where we have identified any third party copyright information you will need to obtain permission from the copyright holders concerned.
If you have an enquiry regarding this publication, please contact: 0845 000 4999
servicedesk@cabinet-office .gsi.gov.uk This publication is available from
www.official-document s.gov.uk and www.cabinetoffice.gov.uk
Foreword
Francis Maude, Minister for the Cabinet Office
and Paymaster General
We are turning government into a leaner, more effective machine that manages its estate like the best run businesses.
This is an important agenda for government as we pay off the largest deficit in the UK’s post-war history. Because of the tough spending decisions we have taken the deficit is down by a third since the General Election, but the job isn’t over. Britain is in a global race and we can only prosper again by showing we can pay our way. Budgets across the public sector are tight and so we are determined to drive out wasteful spending. Squeezed resources must be targeted where they are needed most. Reducing the cost of the Government’s property estate is a key part of our efficiency and reform agenda. Government is one of the country’s largest landowners but in the past much of its estate was used inefficiently, and much of it is now unsuitable for a modern office space.
Taxpayers should never again foot the bill for property that is not needed. By introducing greater transparency that shows the true scale of what we own or lease, we have been able to drive efficiency savings. Since 2010 we have generated more than £1 billion from the sale of over 770 property freehold assets. This year’s State of the Estate report shows that government now occupies 15% less space than it did in 2010. We have got out of 1.5 million sq m, around 18 times the office space in the Shard building.
As well as making savings for the taxpayer we have freed up space in prime locations. Last summer I announced the sale of a long-term lease of London landmark Admiralty Arch for £60 million. The Arch will be transformed into a luxury hotel and the restoration will bring jobs to London and beyond. Independent
property experts estimate that the Government’s work to rationalise its estate has stimulated London’s
economy alone by £3 billion since the General Election. We are also ensuring that our estate is more energy efficient and sustainable. This report shows that departments are well on their way to meeting their Greening Government Commitment to reduce
emissions by 25% by 2015, as well as waste and water reduction targets. Meeting these targets doesn’t just help the planet, it helps save money.
We have made good progress but there is more to come. This report has highlighted that the space we occupy per employee is considerably larger than the equivalent in the private sector. I have put in place a new workspace standard for government offices. This is 10 sq m per employee in existing offices and 8 sq m in new occupations. This new standard must be achieved by the end of 2015. We will initially focus on poor performing buildings, including the London freehold estate, to identify and remove barriers that make it difficult to use space more efficiently.
This work must be driven by good quality management Information. This Government introduced Quarterly Data Summaries (QDS), which allow us to analyse and
compare our performance across government and with the private sector. However, some departments are still unable to provide complete data on how much it costs to run their buildings. This is not acceptable; well-run businesses have this data at their fingertips. Departments need to get better at collecting Management Information and providing it to the centre. Through the Government Property Unit we will be expanding property benchmarking to improve cost management and centralising estate plans to co-ordinate rationalisation. These initiatives will play a key role in driving future efficiency savings.
We are also set to increase co-operation with local authorities to maximise efficiency wherever possible, for example by co-locating staff and combining surplus space to increase its disposal value. As part of this work, we will help local authorities to identify buildings and land that can be released for productive use by the private sector, boosting local economies across the country.
Finally, we are determined to build a 21st century workplace for staff. This is a key priority in the Civil Service Reform Plan. Our workplace transformation programme ‘The Way We Work’ was launched in 2012 and will be rolled out across government during the coming year. We want our staff to be equipped with the latest IT and office technology. They should also be able to work seamlessly and flexibly across locations, and at times that are convenient to them and the customer. All of these efforts will help us to build a more effective and efficient property estate and a modern Civil Service that puts the customer first. By continuing to reduce the cost of our estate we will continue to save money for the taxpayer and, crucially, ensure that resources are targeted at the front line.
Francis Maude
The State of the Estate in 2012
Contents
Executive summary 6Chapter 1 About this report 9
Chapter 2 Reducing the size of the estate 15
Chapter 3 Delivering efficiencies 27
Chapter 4 A more sustainable estate 37
Chapter 5 Forward look 47
Appendices
Appendix A – Size of the mandated estate
(summary) 50
Appendix A – Size of the mandated estate
(full) 51
Appendix B – Total cost of the estate in 61
2011/12
Appendix C – Benchmarked offices: efficiency 62
data and KPIs (summary)
Appendix C – Benchmarked offices: efficiency 64
data and KPIs (full)
Appendix D – New procurements 74
Appendix E – Climate Change Act 2008 (extract) 75
Executive summary
The State of the Estate in 2012 reports on progress made during the year in improving the efficiency and sustainability of the Government’s Civil Estate, as required under the Climate Change Act 2008.
Results for 2011/12 show continued progress. Most notably, during the year, the total size of the estate fell by 5% to 9.2 million sq m, while running costs reduced by £36 million in real terms. One clear benefit of the year-on-year reduction in estate size can be seen in the total value of sales receipts, raising £1 billion since the General Election. Carbon emissions also fell by 12% leaving the estate on course to meet the Greening Government Commitment for a 25% reduction over 2009/10 by 2015.
The Government saved nearly £200 million in annual running costs during the year by exiting buildings including leaseholds, freeholds and those funded through the private finance initiative.
Despite the 5% reduction in space, the amount occupied per full-time equivalent employee (FTE) remained static at around 13 sq m. This is a direct result of the
Government’s success in reducing the size of the Civil Service. We anticipate a reduction in this measure, below 13 sq m/FTE, as a result of continuing rationalisation programmes, new workplace standards on the use of space, and efforts to create a more flexible working culture within the Civil Service.
Reducing the size of the estate
During 2012 the overall size of the mandated estate (see figure A1, page 10) fell from 9,719,531 sq m to 9,219,150 sq m, a reduction of 5.1%. The number of holdings in 2012 fell from 5,957 to 5,582, down by 6.3%. These reductions mean that the estate is now 25% smaller than in January 2008.
Running costs
The total cost of running the estate during the financial year 2011/12 was £3.135 billion, based on reported and estimated costs. Adjusted for inflation, this represents a
fall of £36 million when compared to 2010/11, despite an increase in spend on backlog maintenance and above inflation rises in rates and energy.
Delivering efficiency
The main measure of efficiency is cost of office space per employee. This is calculated as the total cost of space divided by the number of FTEs. The result is cost per FTE (£/FTE), which increased from £4,608 in
2010/11 to £5,324 in 2011/12. This is because property costs rose while the space occupied per FTE remained static due to significant reductions in the size of the Civil Service and temporary factors that delayed the disposal of vacant space.
Cost of space
After an accounting change to more accurately reflect the cost of freehold space the cost of office space, including rents, rates and other overheads, was £409/sq m on average, and £867/sq m in London. Despite this change, the cost of space across the estate remains 3% less expensive than the private sector average, while London offices are also less expensive than comparable private sector offices in terms of type and location.
Space efficiency
The amount of space occupied per FTE was similar to the previous year at 13.0 sq m/FTE. Although rationalisation has resulted in significant space reductions, 5.1% over the year, especially in the large cities, this has been matched by significant staff
reductions. While there have been local gains in efficient use of space, this has not always translated into a reduction in holdings. This is because space partially vacated could not be disposed of in the short term due to a combination of contractual restrictions, market conditions and operational reasons. Meanwhile, extra demand for services during the current economic climate has led to some increases in demand for space. However, these are short-term trends. As they level out and consolidation continues, we expect to see a longer-term improvement in sq m/FTE.
The State of the Estate in 2012
Making the estate more sustainable
In February 2011, the Coalition announced the Greening Government Commitments, which called for departments to accelerate improvements in
sustainability, including a 25% reduction in greenhouse gas emissions from the estate and employee transport by 2015. This report highlights progress towards meeting these commitments, with a 12% reduction in emissions between 2009/10 and 2011/12, which leaves the estate well on course to meet the 25% target. Almost two thirds of the estate now has better energy performance than the industry benchmark, up from half last year.
Maximising future gains
The Government recognises that there is a need to accelerate improvements in efficiency. The Government Property Unit (GPU) is therefore working with
departments to develop a new property strategy with clear objectives, savings targets and performance metrics. A key part of this strategy is the new workplace
standards for the central government office estate, which require space efficiency of 10 sq m/FTE for existing buildings and 8 sq m/FTE for new buildings by 2015. This will be achieved through continuing rationalisation of the estate and more flexible working, with staff moving between their offices and new, conveniently located work hubs, as well as working from home. The GPU will also increase co-operation with local authorities to maximise efficiency, for example by co-locating staff and combining surplus space to increase its sale value.
Data collection
Robust performance and management data is essential to allow comparison of the performance of departments, and between public and private sectors. In 2012, 99% of government departments and arm’s-length bodies completed annual verification of their core data, ensuring that it is accurate and up to date. This highlights an increasing focus on the performance of their estates and an understanding of the contribution that good
Chapter 1
About this r
eport
Chapter 1
About this report
The annual State of the Estate report provides an assessment of progress being made towards improving the efficiency and environmental sustainability of the central government Civil Estate during 2012. Its publication is required under the Climate Change Act 2008.
The report concentrates on the four main priorities identified in the Act, which are:
• to reduce the overall size of the estate
• to increase the efficiency of administrative offices on the estate
• to improve the environmental sustainability of buildings on the estate
• to ensure that building acquisitions made during the year fall within the top quartile of energy performance.
The reporting period
This report is focused primarily on the calendar year 1 January to 31 December 2012. It includes
commentary on trends over this period and, where appropriate, relates to baselines set out in the first State of the Estate report produced in 2008. However, data on sustainability, the cost of running the estate and the cost and space efficiency of offices is on a financial year basis. The most recent financial year for which full data is available is 2011/12.
The Civil Estate
The Civil Estate is defined as the workspace, offices and other property (land and buildings) used to deliver departments’ activities which are owned, leased or occupied by a government body, including: • ministerial and non-ministerial departments • executive agencies
• executive non-departmental public bodies (NDPBs) • special health authorities in Great Britain.
It does not include the operational NHS estate, the prisons estate, the Foreign and Commonwealth Office (FCO) overseas estate, the Department for Environment, Food and Rural Affairs (DEFRA) rural estate, the Ministry of Defence (MOD) military estate, the privatised rail entities or public corporations. Figure A2 on pages 12–13 shows the family relationships of organisations that own property on the Civil Estate and how these vary in complexity and size.
Property management on the estate
In central government, departments and their arm‘s-length bodies – including executive agencies and NDPBs – are accountable for the property they own or occupy and are specifically responsible for: • resources spent in providing this accommodation and
improving its environmental impact
• establishing appropriate departmental governance and accountability
• managing property assets as a strategic resource, including the quality of data used in decision making. The operating model may differ depending on the nature of the organisation. For example, some may be funded externally through trading and some arm’s length bodies operate independently from government as part of their function. In some instances, the extent of individual arm’s-length bodies’ property holdings far exceeds that of their parent department. The
importance of effective property asset management (PAM) in this varied landscape is now well established with board-level property champions in departments accountable to permanent secretaries for PAM across the department and its arm’s-length bodies. PAM boards (or their equivalent) have responsibility for leading integrated strategic management across the total property portfolio in a department.
Figure A1: ‘Estates’ comprising the public sector
Central government
General property owned, leased or occupied by:
Government departmentsExecutive agencies Executive NDPBs
Special health authorities
Also includes:
FCO estate in the UK
English Heritage administrative estate Defence administrative estate
Mandated estate
(property types for which inclusion in e-PIMSTM is mandatory)Central government
Specialist property
HMCTS (Her Majesty’s Courts and Tribunals Service)
Laboratories
Other specialist facilities owned, leased and occupied by central government departments, agencies and NDPBs, including: museums, galleries, power stations, port facilities etc Civil engineering infrastructure (flood defences, roads, canals, railways etc)
The Civil Estate
English Heritage estate Historic Royal PalacesCentral Government Estate
Defence military estate* Prisons estate*
NHS estate (e.g. hospitals) DEFRA rural estate (e.g. farms) FCO and Home Office (HO) overseas estate
Public sector estate
GP surgeries and clinics SchoolsHigher/further education Police
Fire and rescue
Local government estate Devolved assemblies Parliament’s estate The Crown Estate Public corporations
*In scope for Greening Government reporting
Measuring performance
Efficient property management depends on having good information available and being able to interpret it meaningfully. Crucial to this is the use of appropriate metrics, which allow performance to be compared across government organisations and with the private sector.
Key Performance Indicators
This report is focused on a dashboard of Key Performance Indicators (KPIs) which measure:
• reductions in the overall area of the Civil Estate (sq m) and in the total cost of the estate
• improvements in the cost of office space per full-time equivalent employee (FTE), expressed as £/FTE. This is calculated by dividing the cost of space in a building by the number of FTEs based there
• the use of occupied office space expressed as sq m/FTE, based on total space in use divided by the total number of FTEs based there
• compliance with the commitment to procure buildings in the top quartile of energy performance
• Display Energy Certificate (DEC) energy efficiency ratings
• sustainability performance for greenhouse gas emissions, waste and water consumption.
Data coverage and collection
The Government has established e-PIMSTM – Electronic Property Information Mapping Service – as its central database for the Civil Estate. This allows departments and their arm’s-length bodies to record and collect the key information for their property holdings. This includes details of landlords, leases and a wide range of performance data. It also provides location data through online mapping.
The mandated estate
Central government organisations are required to record and maintain up-to-date details – including sustainability and benchmarking data – for their core property
holdings through the e-PIMSTM system. This forms the ‘mandated estate’. Figure A1 illustrates where the Civil Estate (both mandated and non-mandated) sits within the wider government and public sector estates.
Buildings in the mandated estate
A building as defined by the Climate Change Act 2008 is one that uses energy for heating or cooling the whole
or any part of its interior. This excludes certain specialist buildings that are operational in nature – for example, vehicle storage facilities. Also, a ‘building’ is part of the mandated Civil Estate if:
• it is used for the purposes of central government administration; or
• at the passing of the Act, the Minister for the Cabinet Office had responsibility for that building in relation to efficiency and sustainability.
Datasets used in this report
Size: Information about the size and distribution of departmental estates is generated from a snapshot of e-PIMSTM showing the mandated estate as recorded on 1 January 2013. This is compared with the position at 1 January 2012. This dataset is explored in Chapter 2 and detailed at Appendix A.
Cost: Departments have provided, from their financial accounts, the actual net cost recorded for running their estate for the financial year 2011/12. This total property cost dataset is used in Chapter 2 and detailed at Appendix B. Cost definitions are based on the latest edition of the IPD1 Cost Code – full definitions can be found in the glossary – and figures are provided by departments.
Efficiency: Efficiency performance data in this report comes from office occupations over 500 sq m submitted through the Property Benchmarking Service. This data specifically relates to the occupation, rather than ownership, of offices. Cost of space data is a subset of the total estate running costs and relates to the financial year 2011/12, and where appropriate as at 31 March 2012. This dataset is used in Chapter 3 and detailed at Appendix C.
Sustainability: Sustainability data is drawn from performance against the Greening Government Commitment targets, DEC ratings and in-year top quartile energy performance derived from data held nationally on Energy Performance Certificates (EPCs). The scope of these datasets is wider than the
administrative estate covered in Chapters 2 and 3 of this report and includes prisons and the MOD military estate. These datasets are used in Chapter 4 and detailed at Appendix D.
Chapter 1
About this r
eport
1 The IPD Cost Code is an established framework for the collection, measurement and analysis of property cost information. For more information visit www.ipd.com
93,684 m 49,332 m2 National Policing Improvement Agency 93,226
Figure A2: Departments with mandated estates over 10,000 sq m and their families as at January 2012 BUSINESS, INNOVATION AND SKILLS
BIS 83,118 Science and Technology 210,811
Learning and Skills Council (disposals) 20,335 Medical Research Council 131,223 Companies House 34,268 Facilities Council Biotechnology and Biological Sciences Research Council 249,290 National Physical Laboratory 48,431 Skills Funding Agency 23,512 UK Atomic Energy Authority 94,751 Insolvency Service 25,130 Intellectual Property Office 21,179 Natural Environment Research Council 119,862 Student Loans Company Ltd 21,534 Ordnance Survey 14,604 RDA Operational (disposals) 10,226 Land Registry 143,023 Technology Strategy Board 39,615 Met Office 26,342 12 others 38,055 CABINET OFFICE CO 63,481 Ex Central Office of Information 10,001 1 other 2,743 Residual estate 20,777 ENVIRONMENT, FOOD AND RURAL AFFAIRS DEFRA 280,330 6 others 25,546 Environment Agency 182,832 EXPORT CREDITS GUARANTEE DEPARTMENT 10,494 TRANSPORT DfT 47,432 Driving Standards Agency 51,092 1 other 2,024 Vehicle and Operator Services Agency 116,067 Driver and Vehicle
Licensing Agency
91,512 Maritime andCoastguard Agency 60,854 British Transport Police Authority 41,094 Highways Agency 200,954 HM TREASURY HMT 22,885 1 other 1,679 INTERNATIONAL
DEVELOPMENT 63,832 DFID UK STATISTICSAUTHORITY 63,398 UKSA
OFFICE OF FAIR TRADING
11,423 HOME OFFICE HO 72,142 Identity and Passport Service 54,205 11 others 108,098 Border Force/ UK Border Agency 214,600
HM REVENUE AND CUSTOMS
HMRC 1,126,776 Valuation Office Agency 41,382 EDUCATION DfE 54,794 Sublet and surplus
property
21,686 4 others
33,210
59,692 m2
m2
m
FOOD STANDARDS AGENCY
13,944 JUSTICE Chapter 1 About this r eport MoJ 63,843 National Offender Management Service (Non custodial) 252,492 HM Courts and Tribunals Service 1,198,804 Legal Services Commission 17,941 3 others 9,985
The National Archives 65,355 ENERGY AND CLIMATE CHANGE 2 others 10,809 DECC 15,702 DEFENCE (CIVIL) MOD 376,377 UK Hydrographic Office 35,000 FOREIGN AND COMMONWEALTH OFFICE FCO 107,147 British Council 16,727 1 other 2,326 ROYAL MINT 32,091 NATIONAL SAVINGS
AND INVESTMENTS 101,113 NS&I
LAW OFFICERS’ DEPARTMENTS
Treasury Solicitor 13,917 Crown Prosecution Service 110,166 2 others 7,769 COMMUNITIES AND LOCAL GOVERNMENT DCLG 30,622 Fire Service College 44,701 Government Office Residual Estate 36,761 Queen Elizabeth II Conference Centre 16,560 6 others 25,104
CULTURE, MEDIA AND SPORT
DCMS 13,645
Arts Council England 12,974
English Heritage 15,967 Big Lottery Fund
17,877 9 others 14,926
OFFICE OF GAS AND ELECTRICITY MARKETS 12,474 HEALTH DH 46,386 Health Protection Agency 89,000 8 others 28,255 NHS Business Services Authority 49,015 NHS Connecting for Health 10,486 2 Retained Estate 18,276 NHS Blood and Transplant 111,494
WORK AND PENSIONS
DWP 1,642,047
Health and Safety Executive 89,807
3 others 9,093
Chapter 2
Reducing the size of the estate
10.5 sq m (millions) 10 9.5 9 8.5
Holding floor area (sq m)
8,000 6,000 4,000 2,000 0
Chapter 2
Reducing the size of the estate
Continuing the trend from previous years, 2012 saw a significant fall in the overall size of the mandated Civil Estate, from 9,719,531 sq m to 9,219,150 sq m, a reduction of 500,381 sq m (5.1%). The proportion of vacant space on the estate remains below the national average.
Area of the mandated estate
The latest space savings mean that the estate is 1 million sq m smaller since January 2011 and almost 3 million sq m smaller than in 2008. This trend reflects consistent efforts by departments to reduce their property holdings and increase the effectiveness and efficiency of the space they occupy, driven by the Government’s National Property Controls (NPCs).
These Controls include a moratorium on the acquisition of new properties and a presumption that leases will be surrendered at the earliest contractual opportunity. Exemptions are allowed only with Cabinet Office approval if strict value or space saving criteria can be met.
Figure B1 shows the year-on-year reductions in the total size of the estate. Changes in the size of the mandated estate are recorded through e-PIMSTM as departments update their data to reflect disposals, sublettings, acquisitions and other changes.
Key achievements
• The total area of the mandated Civil Estate fell by 5.1% in 2012 to 9,219,150 sq m
• The total cost of running the estate fell by £36 million in real terms, despite above inflation rises in rates and energy
• Vacant space amounts to 3.0% of total area, compared to a national average of 10.1%
Figure B1: Total size of the estate as at January 2013
10,310,331
9,719,531
9,219,150
Jan 2011 Jan 2012 Jan 2013
Source: e-PIMS™
Figure B2: Total number of holdings as at January 2013
6,700
5,957
5,582
Jan 2011 Jan 2012 Jan 2013 Source: e-PIMS™
The number of holdings
The reduction in the overall size of the estate is clearly mirrored by a reduction in the total number of holdings, which fell by 6.3% to 5,582 in the year to 1 January 2013, as shown in Figure B2.
16
The State of the Estate in 2012 Figure B3: Definition of a holding(a) Single holding
in one building (b) Several holdingsin one building (c) One holding across several buildings
What is a holding?
The term ‘holding’ refers to the property held under a commercial lease. As shown in Figure B3, this can be a single building or several buildings, or one building might contain several holdings on different floors. A government organisation might have more than one holding in the same building or sublet space to others within a single building holding. A holding leaves the Civil Estate when the lease is broken or expires, or under the terms agreed within a private finance initiative (PFI) contract.
The total cost of running the estate
The total cost of running the mandated Civil Estate in the financial year 2011/12 was £3.135 billion, an increase of £107 million on 2010/11. However, adjusted for inflation, this represents a reduction of £36 million, despite an increase in spend on backlog maintenance and above inflation rises in rates and energy. Overall, this demonstrates that costs are being well managed. Cost data is provided by departments, including arm’s-length and sponsored bodies. Where information is not available, the cost is estimated. Total property operational costs are broken down into specific cost headings and are offset by receipts and income. Appendix B contains the total cost data for each department.
Total area by department/region
Figure B4 shows the size of the mandated Civil Estate held by each department, including their executive agencies and other arm’s-length bodies, over the last three years. In most cases there has been a reduction in space, but in a few cases the total area has increased – this is largely due to machinery of government changes which involve a transfer of property from one
department to another.
The four largest departments have all reduced the size of their estates from the previous year, but still make up more than 63% of the total: the Department for Work and Pensions (DWP) holds 18.7% of the total estate; the Ministry of Justice (MoJ) 17.4%; the Department for Business, Innovation and Skills (BIS) 14.6%; and
HM Revenue and Customs (HMRC) 12.7%. This reflects the relative size of these departments within
government and the importance of property to
delivering their services, for example through jobcentres, courts, tax offices and laboratories. The remaining departments occupy less than 7% each.
The holdings profile varies considerably between departments. For example, the Department for
Transport (DfT) holds an area of approximately 611,000 sq m, split into 1,235 holdings; BIS has a larger estate at over 1.34 million sq m but only 290 holdings. This is because BIS operates fewer, larger sites, whereas DfT holdings are spread across Britain’s transport
infrastructure.
By region, London has the largest amount of occupied space at 1,787,292 sq m, as shown in Figure B5. This is a reduction of 100,000 sq m over the previous year but still represents 19.4% of the total estate, a similar proportion to 2011. The two next largest regions are the South East and the North West, which contain 13.8% and 12.6% of the total estate respectively. Although London has the largest estate by size, only 10.5% of all holdings are located in the region. This indicates larger occupations in London compared to elsewhere, including departmental headquarters concentrated in and around Whitehall.
Figure B4: Total area by department (over 10,000 sq m)* as at January 2013
Chapter 2
Reducing the size of the estate
Work and Pensions Justice Business, Innovation and Skills Revenue and Customs Transport Environment, Food and Rural Affairs Home Office Defence Health Communities and Local Government Law Officers’ Departments Foreign & Commonwealth Office Education National Savings and Investments Culture, Media and Sport International Development Cabinet Office UK Statistics Authority Other CO Agencies Royal Mint Energy and Climate Change Treasury Group FSA OFGEM OFT ECGD 631,794 624,703 611,028 546,218 526,832 488,707 561,919 516,437 449,405 473,080 434,515 411,377 420,004 367,992 350,762 248,618 160,627 153,748 146,444 133,495 131,853 144,105 126,199 126,199 129,611 114,101 109,690 89,848 101,113 101,113 92,605 86,224 75,389 55,671 55,154 63,832 48,345 53,890 63,481 67,995 63,623 63,398 23,354 56,632 33,521 32,091 32,091 32,091 24,675 26,136 26,511 60,516 24,669 24,544 14,326 14,323 13,944 12,174 12,474 12,474 11,423 11,423 11,423 10,494 10,494 10,494 1,856,832 1,788,883 1,720,464 1,985,431 1,701,689 1,608,419 1,211,599 1,386,538 1,342,645 1,388,623 1,267,261 1,168,158 0 500,000 1,000,000 1,500,000 2,000,000 Jan 2011 Jan 2012 Jan 2013
*Appendix A on pages 50–60 includes some references to explain changes in departments’ estate. Source: e-PIMS™
18
The State of the Estate in 2012Figure B5: Regional distribution of total floor area (sq m)* as at January 2013
London South East North West South West Yorkshire and the Humber East of England West Midlands North East Wales Scotland East Midlands Northern Ireland 1, 1,343, 1,9 432,563 425 1,787,29 2,048,706 13,565 2 1,319, 1,267,97 574 4 1,254,881 1,164,654 92 91 966,252 1,948 7,889 740,805 713,700 685,734 678,507 675,479 644,305 779,229 722,279 608,826 567,746 552,029 553,590 580,037 559,574 549,544 608,860 557,617 546,073 4 4 482,188 58,422 54,828 41,214 37,625 35,004 0 500,000 Jan 2011 1,000,000 Jan 2012 1,500,000 Jan 2013 2,000,000 2,500,000
*3,272 sq m of space located overseas not shown here. Source: e-PIMS™
Figure B6: Number of holdings in each region as at January 2013*
714 682 585 623 479 424 462 519 416 336 273 50 = 100 holdings *3,272 sq m of space located overseas not shown here.
1 0 500 3,000 2,000,000 2,500 1,500,000 2,000 1,500 1,000,000 1,000 500,000 0
Figure B7: Number of holdings/office buildings by size (sq m) as at January 2013
Chapter 2
Reducing the size of the estate
2,501–5,0005 0–500 501–1,000 ,001–2,500 ,001–10,000 >10,000 2,651 991 1,155 677 424 457 306 301 128 84 197 131
Number of holdings Number of office buildings Source: e-PIMS™
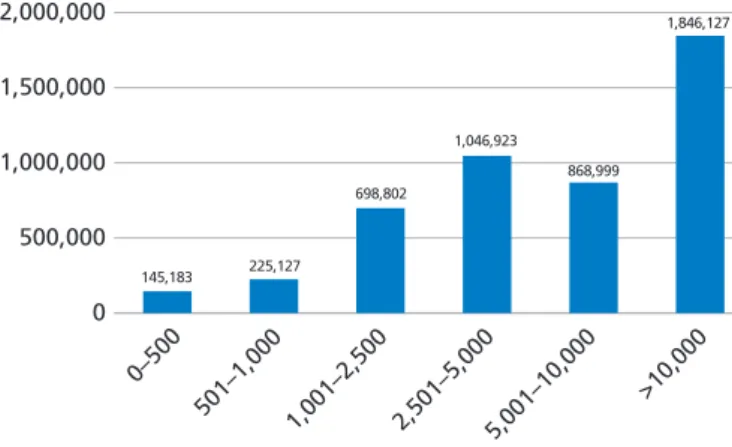
Figure B8: Total area (sq m) comprised in offices in each size (sq m) as at January 2013
501–1,000 1,001–2,500 2,501–5,0005,001–10,000 >10,000 Office building floor area (sq m)
0–500 145,183 225,127 698,802 1,046,923 868,999 1,846,127 Source: e-PIMS™
Figure B6 shows that the regions with the largest numbers of holdings are the North West and the South East, which both have 12.7% of the total mandated Civil Estate. There are also 19 overseas holdings related to borders and customs activities.
Building uses on the Civil Estate
Buildings are used in a variety of ways across the estate, reflecting the diverse nature of government activities. Offices are the largest single use category with
4,831,161 sq m or 52.7% of the total mandated estate, down from 56% in 2011. However, there are a wide range of other occupation types, such as research establishments and laboratories, courts and coastguards’ stations.
Size, age and tenure distribution
The building stock on the mandated Civil Estate varies considerably in size and age. The number of holdings in each size band is shown at Figure B7. Around 56% of all office space is held in the largest 212 buildings which are each greater than 5,000 sq m in size. There are 677 buildings which are 500 sq m or less in size each, and these make up approximately 3% of the total office area. Figure B8 shows the total amount of office space held in each building size band.
Only 42% of buildings on the estate have a date of construction recorded; the age distribution of these is shown at Figure B9.
Figure B10 shows the breakdown of tenure between freehold, leasehold and PFI contracts on the estate. While there have been space reductions across all tenures during 2012, the highest proportion has come from the leasehold and PFI estates. NPCs presume that
all leases will be surrendered at the earliest lease break opportunity or lease expiry and departments have also surrendered space where possible under PFI contract terms. These reductions mean that, from a fairly equal distribution in tenure type only a few years ago, freehold now clearly makes up the greatest proportion of the mandated Civil Estate.
Vacant space
Vacant space is the amount of vacated space ready for release or disposal. Total vacant space on the mandated Civil Estate was 274,119 sq m or 3% of total area at 1 January 2013. Although still well below the reported national average (public and private sector) of 10.1%,1 this represents only a marginal decrease of 0.1% in vacant space over the last year. This means that vacant space across the estate has remained static at around 3% for the last three years.
The South West and the East of England have the highest amount of vacant space as a proportion of total area, with Wales the lowest. Although London has the fourth largest area of vacant space, this represents just 1.8% of the London estate, compared with the average vacancy rate (public and private sector) for London of 7.2%.
Figure B11 shows the breakdown of vacant space as a percentage of total space in each region. Figure B12 shows the vacant space in each region as a proportion of total vacant space on the whole estate.
20
The State of the Estate in 2012Figure B9: Age profile of buildings as at January 2013
2010–19 36 2000–09 266 1990–99 462 1980–89 410 1970–79 521 1960–69 424 1950–59 133 1926–49 129 1900–25 145 Pre-1900 182 No date supplied 11 0 100 200 300 400 500 600 Number of buildings Source: e-PIMS™
Figure B10: Breakdown of size of estate by tenure as at January 2013
Serviced office 7,947 PFI 2,928,165 Other 144,827 Leasehold/Licence 2,565,309 Ground lease 28,666 Freehold 3,544,235 0 500,000 1,000,000 1,500,000 2,000,000 2,500,000 3,000,000 3,500,000 4,000,000 Holding floor area (sq m)
Estate rationalisation
in action
The Government Property Unit’s (GPU’s) estate rationalisation teams help departments, executive agencies and arm’s-length bodies to identify space reduction and relocation opportunities across the Civil Estate.
During 2012 the GPU focused on producing place-based strategies for London and the key metropolitan areas, including: Birmingham/Solihull; Bristol; Croydon to the south coast; Leeds/Bradford; Liverpool; Manchester; North West corridor; Nottingham and Derby; South Yorkshire; and Tyne and Wear.
The teams work with departments to identify appropriate vacant space which can be used as a catalyst for a series of moves within an area which, in turn, enable larger buildings to be vacated and returned to commercial use, benefiting the local economy. This has resulted in major successes in cities from London to Leeds with landmark properties freed up for private investment and staff relocated to more modern,
attractive offices better suited to their operational needs.
Example: Environment Agency Leeds
The Environment Agency occupied three properties in Leeds. These included an area office and a human resources centre, one due for lease break, the other with a lease about to expire. It owned the third property, Rivers House, but this was an outdated building that would have been very costly to renovate to meet current needs.
The Agency wanted to bring all its Leeds-based staff together in one location that supported modern working practices and reduced the amount of space it occupied overall. The GPU identified appropriate space in Lateral, a large, modern open plan office building, which could be freed up with some minor internal moves by its existing government tenants.
As a result, the Environment Agency leased 3,600 sq m from the Department for Communities and Local Government and 270 sq m from the Highways Agency. This is almost 2,500 sq m less than they occupied in the three previous buildings. The space was re-fitted to create a bright, welcoming feel with breakout areas and a clean, modern design which supported the implementation of modern working practices.
The project has delivered on time with the first staff moving into Lateral in September 2012 and the last staff moving from Rivers House in March 2013. The new office houses 593 FTEs in 3,870 sq m giving a space efficiency of 6.5 sq m/FTE and saving £2.1 million a year in running costs. Management and staff feedback has been excellent with staff enjoying their new environment and adopting new ways of working.
Benefits:
• Staff located together in bright, modern offices • Reduction of almost 2,500 sq m in the size of the
estate
• Space efficiency almost doubled from 12 sq m/FTE to 6.5 sq m/FTE
• Saving of more than £2 million a year in running costs
Example: DFID London
The Department for International Development (DFID) had its headquarters at 1 Palace Street, London, occupying more than 15,000 sq m. However, the building was expensive and inefficient at a cost per FTE of £8,748.
Working with the GPU, DFID identified a smaller building at 22/26 Whitehall which was owned by the Cabinet Office and had been recently vacated. An internal review in DFID found that by adopting flexible working practices and relocating around 5% of London-based staff, it could move to the smaller freehold building, saving more than £60 million on its existing lease.
This not only delivered a 35% reduction in space to just 8,678 sq m, it also brought an empty freehold building back into government use, moving DFID closer to other Whitehall departments, while freeing up a major leasehold for commercial use.
The GPU led a project to negotiate an early surrender of the lease at 1 Palace Street, which will be returned to the landlord from December 2013 and is expected to be redeveloped for residential use.
Benefits
• Reduction of 15,273 sq m in the size of the estate • £62.5 million saved over the life of the lease
• Freehold property returned to productive government use
• Leasehold freed up for redevelopment in the heart of London, promoting jobs and growth
Chapter 2
Benefits of rationalisation
As well as creating a smaller, more efficient estate for government that promotes modern ways of working, rationalisation is also bringing benefits for both the economy and the environment.
Boosting growth
When government vacates office buildings, it gives the private sector the opportunity to redevelop or refurbish them, bringing them back into use and generating a quantifiable stimulus to the economy. This is especially the case in London where the Civil Estate includes leased properties in prime locations. Recent independent research by international property
consultants Knight Frank identified a £3 billion boost to the economy since the General Election from buildings previously occupied by government coming back into commercial use.
Estate rationalisation will also benefit regional economies with pilots starting in 2013/14 to explore how central and local government can work together to free up buildings and land to help spur growth across the country. Read more about these plans in Chapter 5.
Example: Admiralty Arch
Standing between Trafalgar Square and The Mall, Admiralty Arch is a world-famous landmark,
commissioned by Edward VII as a memorial to the reign of his mother Queen Victoria. A review of the Cabinet Office’s estate in 2011 decided that it would be too costly and difficult to renovate the Grade 1 listed building for modern offices. A worldwide marketing campaign started in late 2011 to find an innovative and imaginative design solution to bring the building into commercial use, while protecting its heritage, giving greater public access and offering value for money for the taxpayer. Government would retain the freehold to protect it for the nation and future generations. The preferred bidder, Prime Investors Capital (PIC), was selected in July 2012. Pending the approval of funding and planning permission, they will transform the Arch into a hotel with 85 bedrooms, as well as restaurants and bars overlooking The Mall and Buckingham Palace.
Benefits:
• £3 million a year saving in running costs • £60 million in proceeds to the Exchequer
• A reduction of 13,685 sq m in the size of the estate • New commercial life for a Grade I listed building,
boosting London’s economy
Promoting sustainability
By reducing the number of buildings that government has to light and heat, estate rationalisation delivers a significant contribution to meeting carbon emission targets for the Civil Estate, as well as reducing energy and other property costs.
It also enables recycling of equipment such as office furniture. Helped by the GPU, departments across government are developing strategies to maximise re-use of existing stocks of furniture to both reduce costs and strip out waste.
Overcoming obstacles
As estate rationalisation progresses, it becomes increasingly difficult to find space that can be easily vacated. In some cases the costs involved may result in a weak business case for the creation of aggregated vacant space schemes, such as those illustrated above. Departments must ensure that the space they vacate can be delivered in manageable units for re-use by other tenants whether from the public or private sectors. Other questions that need to be addressed include: what are the IT and security implications for the proposed release of space?; are there limits on the capacity of the building services, such as power, heating and cooling?; or any statutory restrictions that limit the department’s ability to create vacant space? The GPU is currently working with departments on a pan-government strategy to overcome these issues and drive the next generation of rationalisation projects. Other key initiatives that promote further rationalisation include workplace transformation (see page 35), a workspace standard of 10 sq m/FTE and more collaborative working with local authorities and the wider public sector. Read more about these plans in Chapter 5.
Figure B11: Vacant space as a percentage of total area in the region as at January 2013
Yorkshire and the Humber 3.8%
West Midlands 4.9% Wales 1.4% South West 4.3% South East 2.4% Scotland 1.8% North West 3.5% North East 2.1% London 1.8% East of England 5.2% East Midlands 2.9% Chapter 2
Reducing the size of the estate
0.0% 1.0% 2.0% 3.0% 4.0% 5.0% 6.0% Source: e-PIMS™
Figure B12: Distribution of vacant space (sq m) by region as at January 2013
Yorkshire and the Humber 26,232 9.6%
West Midlands 29,602 10.8% Wales 7,922 2.9% South West 39,861 14.5% South East 30,170 11.0% Scotland 9,700 3.5% North West 40,653 14.8% North East 11,733 4.3% London 31,711 11.6% East of England 33,234 12.1% East Midlands 13,302 4.9% 0 10,000 20,000 30,000 40,000 50,000 Source: e-PIMS™
24
The State of the Estate in 2012
Figure B13: Space increases/reductions in departments with mandated estates over 10,000 sq m and their families as at January 2013
BUSINESS, INNOVATION AND SKILLS
BIS -1,957 Science and Technology Facilities Council 6,673 Biotechnology and Biological Sciences Research Council -977 Medical Research Council -12,463 Companies House 0 Skills Funding Agency -10,861 National Physical Laboratory 9 UK Atomic Energy Authority 96 Insolvency Service -7,914 Intellectual Property Office 0 Natural Environment Research Council 2,236 Student Loans Company Ltd 430 Ordnance Survey -177
Learning and Skills Council (disposals) -197 Land Registry -27,723 RDA Operational (disposals)
0 Technology Strategy Board
38,400 Met Office -106 12 others -4,142 CABINET OFFICE CO 9,591 Ex Central Office of Information -1,081 1 other -2,889 Residual Estate -551 ENVIRONMENT, FOOD AND RURAL AFFAIRS DEFRA -22,486 6 others -7,642 Environment Agency -13,668 EXPORT CREDITS GUARANTEE DEPARTMENT 0 HM TREASURY GROUP HMT -125 1 other 0 TRANSPORT DfT -7,625 Driving Standards Agency 1,949 Vehicle and Operator Services Agency -2,692 Maritime and Coastguard Agency 672 1 other 0 Highways Agency -383 Driver and Vehicle
Licensing Agency -3 British Transport Police Authority -92 INTERNATIONAL
DEVELOPMENT 8,678 DFID UK STATISTICS AUTHORITY UKSA -225
OFFICE OF FAIR TRADING
0 HOME OFFICE HO 6,403 Identity and Passport Service -1 11 others -20,701 Border Force/ UK Border Agency -51,003 EDUCATION DfE 5,968 Sublet and surplus property 6,752 4 others -9,051
HM REVENUE AND CUSTOMS
HMRC -88,756 Valuation
Office Agency -10,347
Chapter 2
Reducing the size of the estate
JUSTICE
MoJ 5,627 The National Archives
0 National Offender Management Service (non custodial) -96,016 HM Courts and Tribunals Service -269 Legal Services Commission -1,031 3 others -474
FOOD STANDARDS AGENCY
-379 ENERGY AND CLIMATE CHANGE DECC 0 2 others -66,354 DEFENCE (CIVIL) MOD -23,121 UK Hydrographic Office 0 FOREIGN AND COMMONWEALTH OFFICE FCO 0 British Council 0 1 other 0 NATIONAL SAVINGS
AND INVESTMENTS NS&I 0
ROYAL MINT
0
LAW OFFICERS’ DEPARTMENTS
Treasury Solicitor 0 2 others 0 Crown Prosecution Service -1,642 COMMUNITIES AND LOCAL GOVERNMENT DCLG 0 Fire Service College 0 Government Office Residual Estate -11 Queen Elizabeth II Conference Centre 0 6 others 646
CULTURE, MEDIA AND SPORT
DCMS -779 Big Lottery Fund
-112 Arts Council England-1,155
English Heritage -1,750 9 others
-5,714
OFFICE OF GAS AND ELECTRICITY MARKETS
0 HEALTH DH -3,488 Health Protection Agency 69 8 others -2,395 NHS Business Services Authority -4,290 NHS Connecting for Health 40 NHS Blood and Transplant -142 Retained Estate -2,157 Key
WORK AND PENSIONS
DWP -69,742
Increase (sq m) Decrease (sq m) Static (+/– 100 sq m)
Health and Safety Executive -5,588
3 others -3,923
Delivering ef
ficiencies
Chapter 3
Chapter 3
Delivering efficiencies
The main measure of efficiency, cost of office space per employee, increased during the year, from £4,608 in 2010/11 to £5,324 in 2011/12. This was because property costs rose while the amount of space occupied per employee remained static due to rapid continuing staff reductions and short-term factors that delayed the disposal of vacant space. However, space per employee should progressively improve with the introduction of a new, more demanding workspace standard.
Reducing the size of the Civil Estate generated
£200 million in savings from disposals and lease breaks during 2011/12. However, this was not yet matched by gains in efficiency. This is partly explained by continuing staff reductions: although the estate is smaller, there are also fewer people, so the average space occupied per employee remains the same.
Rising property costs compound this effect, making the cost of office space per employee more expensive. This is especially so in London, where there was a sharp rise in property costs during 2011/12. Previous consolidation also means that the London estate is increasingly focused on a core of departmental headquarters, which are expensive to run.
However, while space remains under-utilised, there is still considerable room for further rationalisation across the estate. To help drive this forward and accelerate improved efficiency, the Government has set new workplace standards of no more than 10 sq m per full-time equivalent employee (sq m/FTE) for existing buildings and 8 sq m/FTE for new occupations to be achieved by 2015.
Figure C1: Size of the benchmarked office estate
Benchmarked occupations 1,122
Participating property centres 184
Occupied space (sq m) 3,573,519
Office-based FTE 274,750
Annual property cost £1.463 billion
Cost per full-time equivalent employee
Cost/FTE – key points
• The average cost per FTE (£/FTE) on the benchmarked office estate (see How
performance is measured, page 28) increased in 2012 and, at £5,324, has risen above the private sector equivalent.
• Almost 60% of the benchmarked office estate reports a £/FTE which is above the private sector benchmark average.
• Most regions report a £/FTE close to the regional benchmark average. However, £/FTE in central London has risen far above the average for private sector space to £11,913.
The primary indicator used to report and assess building efficiency on the Civil Estate is the cost per FTE,
expressed as £/FTE. This is measured as the cost of space divided by the number of FTEs.
During 2012, the average £/FTE rose by 16% to £5,324 and now stands above the private sector average. This is because property costs rose, especially in central London, while the space occupied per FTE
remained static.
Key achievements
• Cost per FTE was better or the same in 30% of benchmarked offices compared to 2010/11, while space per FTE was better or the same in 44%
• Average cost of space was 3% lower than the private sector average across the estate • The proportion of benchmarked offices with a
space efficiency of 10 sq m/FTE or less increased from 18% to 21% during 2011/12
28
The State of the Estate in 2012How performance is measured
Government departments and their arm’s-length bodies are required to measure the efficiency, effectiveness and environmental sustainability of their administrative office occupations over 500 sq m, and an increasing number of departments are also opting to include their smaller offices.
Data is collected through the cross-government e-PIMS™ system, with the performance of each building reported back to the occupying organisation through independently validated metrics. This produces one consistent set of data that enables performance to be compared against KPIs, cost factors to be understood and challenged, and efficiency improvements to be realised. The data is reported through the annual GPU Benchmarking Service which focuses departments on improving data accuracy to ensure that the outputs and knowledge that this generates are used to support and improve decision making.
Benchmarking
The Benchmarking Service measures the performance of the central government office portfolio against private sector benchmarks and against government targets and standards, providing a standardised basis for consistent reporting across the estate. Benchmarks come from comparable buildings in the private sector and industry best practice, based on a basket of typical cost elements. However, as benchmarking
develops, it is expected to focus on the total cost of occupation including additional metrics on facilities management costs.
Benchmarking covers administrative office buildings, which account for around 52% of the total Civil Estate, as detailed in Figure C1. It does not cover specialist property, such as courts and tribunals, laboratories, research facilities and jobcentres. This means that some departments’ benchmarked property is low as a proportion of their total property holdings, but coverage of departmental office space is high.
The Civil Estate retains a core of well-managed and efficient office space, with 41% of the benchmarked estate reporting £/FTE values which are equivalent or lower than the private sector. However, this is down from 52% in 2010/11 and a large amount of space is under-utilised.
Some of this under-use is because continuing staff reductions are creating surplus space at a faster rate than it can be disposed of. Meanwhile, a mix of contractual restrictions, market conditions and
operational factors made it difficult to exit vacant space during the year. However, these are short-term trends. As staff reductions level off and consolidation initiatives increase, £/FTE is expected to improve over the
longer term.
The central London estate
Central London accounts for 17% of the central civil office estate annual property cost. It contains the most expensive offices on the estate with a £/FTE of £11,913 and is the least efficient in comparison to the
private sector.
The central London estate will therefore remain a priority for significant rationalisation to carefully manage cost and drive down space usage where possible. Other regions also contain pockets of under-utilised space which also provide opportunities for further rationalisation.
Figure C2 gives a snapshot of current efficiency
performance against Key Performance Indicators (KPIs). Details and scores for each KPI at organisation level are shown in Appendix C.
Figure C3 shows that most UK regions have seen cost increases per FTE since 2009/10, but remain lower than or very close to the private sector average in all regions except Central London.
Cost/sq m – key points
• Although the cost of benchmarked office space (£/sq m) increased during 2011/12, on average it remains 3% lower than the private sector benchmark.
• Average £/sq m of occupied office space is £409 across the estate.
• £/sq m is lower than the private sector average in all UK regions except Central London.
The average cost of space per sq m (£/sq m) in the benchmarked office estate increased by around 17% in 2011/12 to £409. This reflects a sharp increase in property costs in London, from £666/sq m in 2010/11 to £867/sq m. The rise is also affected by a change in accounting methods to more accurately reflect the cost of retaining freehold space within the estate.
Figure C2: Efficiency performance: how the central government estate compares with the private sector
Chapter 3
Delivering ef
ficiencies
Costs
Net rent/sq m £257 21% worse Rates/sq m £68 4% better Other costs*/sq m £84 20% better
10%+ better than benchmark 10%+ worse than benchmark
Total costs £/sq m £409 3% better Space efficiency sq m/workstation 11.8 sq m 25% worse Workstations/FTE 1.1 2% better
Total space efficiency
sq m per FTE 13.0 sq m 25% worse Overall efficiency £/FTE £5,324 22% worse Source: IPD
Note: This diagram shows how the relationship between cost and space components will influence the overall efficiency measure: £/FTE. Costs show the detailed KPIs underpinning the total cost and space efficiency metrics.
*Includes: service charges; internal repair and maintenance; security; cleaning; water and sewerage; and total energy costs.
Figure C3: Average cost/FTE across the country, 2011/12
£11,913 12,000 10,000 8,000 Cost (£) 6,000 4,000 2,000 0 £5,289 £4,907 £4,281 £4,132 £3,684 £4,043 £4,515 £3,658 £3,899 £3,669 £3,369 2009/10 2010/11 2011/12 Central LondonRest of London
South East South W est
East of EnglandEast MidlandsW est Midlands Yorks & Humber North W
est
North East Scotland
30
The State of the Estate in 2012 1,000 800 600 400 200 Cost per sq m (£) 0Despite these changes, the average cost per sq m remains lower than the private sector average by 3%. The wide variations in £/sq m and in relative
performance across the estate do, however, offer opportunities for improvement. Figure C4 illustrates the impact of cost in different locations.
Space efficiency
Sq m/FTE – key points
• The amount of office space occupied per employee (sq m/FTE) across the estate shows little change for the third successive year at 13.0 sq m/FTE.
• The proportion of buildings occupied at less than 10 sq m/FTE has increased to 21% but a significant share of the government office estate remains under-used.
Space efficiency is measured as the amount of space per FTE (sq m/FTE). Across the benchmarked Civil Estate, this has remained at around 13 sq m/FTE for the third successive year. While 40% of space operates at or less than 12 sq m/FTE, the majority is still occupied above this level.
However, there are some signs of progress. In 2011/12, 44% of benchmarked occupations reported sq m/FTE that was better or the same as in 2010/11, while 21% of office space achieved space efficiency better than 10 sq m/FTE, as shown in Figure C5.
The space efficiency of the estate’s smallest occupations also improved. This reflects the efforts made to
rationalise and consolidate staff and organisations from small and under-used offices.
Focus on poor performance
Almost 30% of space suffered deterioration in space efficiency of more than 10%. Efforts will be concentrated on these poor performing pockets to understand where performance falls short.
Use of freehold office space has become more efficient since 2010/11 but at 14.2 sq m/FTE, it remains the least well used part of the benchmarked office estate. These owned buildings can therefore accommodate extra staff and offer a good opportunity to consolidate space in the future.
Figure C4: Average cost/sq m across the country, 2011/12
£867 £392 £310 £328 £271 £272 £295 £339 £294 £333 £323 £297
Central London Rest of London
South East South W est
East of EnglandEast Midlands
North W est
North East Scotland Yorks & Humber
W est Midlands
Wales
0 20 40 60 80 100
>12m2/FTE 10 to 12m2/FTE Less tha 10m2/FTE We also expect to see better gains in 2012/13 and over
the longer term as a result of new workplace standards and efforts to create a more flexible working culture within the Civil Service (see Transforming the Way We Work, page 35).
Figure C6 illustrates the sq m/FTE performance of each main department. Figure C7 shows that there has been little notable change in the space efficiency reported by leased and private finance initiative (PFI) space.
Figure C5: Profile of space utilisation in 2011/12
21% 17% 62%
Less than 10 sq m/FTE 10–12 sq m/FTE >12 sq m/FTE
Source: Property Benchmarking Service/IPD
Figure C6: Space occupation (sq m/FTE) in main departments in 2011/12 20
15
Space per FTE
10 5 0 17.3 15.8 15.2 14.2 14.1 13.7 13.5 13.5 13.2 12.7 12.5 12.4 12.4 12.3 11.3 11.1 10.2 9.2 BIS HO DH
FCO DFID MOD HMRC LOD DEFRA DfE DCMS MOJ DCLG DfT CO DWP DECC HMT
Figure C7: Variations and opportunities across the benchmarked estate in 2011/12
Tenure Freehold Leasehold PFI
14.2 sq m/FTE 13.1 sq m/FTE 12.8 sq m/FTE
Size <500 sq m 500–2,500 sq m >5,000 sq m
13.0 sq m/FTE 14.0 sq m/FTE 13.1 sq m/FTE Source: Property Benchmarking Service
Chapter 3
Delivering ef
ficiencies
Five-year trends
Over a five-year period the trend for offices, both in government and in the private sector, has been one of increasing £/FTE (Figure C8). However, as Figure C9 shows, sq m/FTE in the private sector has reduced annually since the start of the recession as employment levels have stabilised. Meanwhile, ongoing staff reductions and resulting surplus capacity have meant that sq m/FTE in the government office estate remains static. The effort to manage space and consolidate property holdings needs to be maintained to ensure that performance mirrors private sector improvements in efficiency over the longer term.
Figure C8: Cost per FTE trend
£5,000
Cost per FTE
£4,500 £4,000 £3,500 £3,000
2007/08 2008/09 2009/10 2010/11 2011/12 Benchmarked office estate
£4,536
£4,168
£4,449 £4,608
£5,324
IPD private sector £5,500
£3,856
£5,100
£4,523 £4,578
£4,360
Figure C9: Sq m per FTE trend 15.0 Sq m per FTE 10.5 11.0 11.5 12.0 12.5 13.0 13.5 14.0 14.5 10.0 2007/08 2008/09 2009/10 2010/11 2011/12 Benchmarked office estate
14.5 sq m
13.1 sq m 13.0 sq m 13.2 sq m 13.0 sq m
IPD private sector
11.8 sq m
13.3 sq m
11.3 sq m
11.0 sq m
10.4 sq m
Figure C10: Cost per sq m trend £440 £420 £400 Cost per sq m £380 £360 £340 £320 £300 2007/08 2008/09 2009/10 2010/11 2011/12 Benchmarked office estate
32
The State of the Estate in 2012£314 £318
£341
£351
£412
IPD private sector
£330
£390
£407
£418 £424
Efficient facilities
management
In 2012, the Government Property Unit (GPU) began working with the Government Procurement Service (GPS) to develop a standard method for procuring facilities management (FM) across government, which would:
• deliver savings and better value for money through tighter cost and performance management • give more control over FM provision, with the
flexibility to consolidate contracts and adapt to future requirements
• standardise and simplify the procurement process • deliver and share coherent, transparent and
consistent management information
• exploit market capability, knowledge and innovation • support small and medium-sized enterprises and
promote growth in this sector
• improve data transparency to enable robust decision making and performance/contract management • develop and apply common standards to enable
benchmarking and consistency of data.
Individual departments have already been making good progress in rationalising their existing contracts and spend to deliver savings. They are supported by a tightened FM controls process driven by the Cabinet Office Central Controls team, which allows greater scrutiny of all new procurements or extensions to existing contracts. FM service standards introduced in 2011 have also produced some good early results, including an 8% saving by the Cabinet Office.
Standardising facilities management
procurement
Supplier working groups have helped to identify common issues among departments who contracted with the same suppliers. This joined-up and
collaborative approach to contract management has proved to be highly successful in driving better performance from our existing suppliers and enabling a more consistent approach to supplier relationship management.
At the end of 2012, the Government approved the creation of a pan-government FM contract model and the development of a central function to collect, collate and analyse cost data and management information.
Work on the delivery of this model started in early 2013 and a new procurement and category management solution will be up and running by the autumn of 2014.
Generating better quality data
A key part of this effort will be generating consistent and accurate cost data and management information. Total FM spend across the central government estate is around £3.2 billion (2010/11)1 but the data generated has little transparency at a granular level. This has in the past resulted in the inability to identify the actual spend on each contract, benchmark costs, or assess the performance management of both supplier and client. GPU staff are therefore helping departments collect data at a contract level and gain a better understanding of FM category spend across central government, improve data quality and enable effective benchmarking and comparison.
Integrating facilities management in
building design
The Government Construction Strategy of May 2011 identified the need to integrate FM into the design process for buildings to ‘align the interests of those who design and construct an asset with those who subsequently use it’. This reflects the fact that the ongoing maintenance and operational cost of a building during its lifecycle far outweighs the original capital cost of construction.
The resulting Government Soft Landings (GSL) policy was developed during 2011/12 by the GPU FM team, working with a task group of industry specialists. It will apply to all new central government projects and major refurbishments and should be implemented by
departments during 2013.
Fundamental to the concept of GSL is collaborative working across the supply chain and key stakeholder engagement at all stages of the process. There will be a GSL Champion in every project team to represent the interests of the future occupiers of the building.
Chapter 3
Delivering ef
ficiencies
Transforming the Way
We Work
Work in the 21st century is increasingly about what you do, not where you do it. The use of new technologies means that much of the work we do can be carried out from many locations other than offices.
Successful employers across all sectors are already using flexible and smarter ways of working to boost their performance and efficiency while driving down office costs.
In challenging times, government also needs to adopt this agile approach not only to improve efficiency but also to create a better working environment that is well equipped and fit for the future. The Civil Service Reform Plan published in 2012 promises ‘a decent working environment for all staff, with modern workplaces enabling flexible working, substantially improving IT tools and streamlining security requirements to be less burdensome for staff’.
A more dynamic culture
Through The Way We Work programme, government is encouraging the large-scale application of more agile forms of working, including changes in office culture, technology and layout, as well as providing more choice of work location. Ultimately this will reduce the need for space across the estate, increase professional productivity, reduce government’s carbon footprint and help to create a more dynamic culture in the Civil Service.
In practice, this means:
• work being done in a number of settings, not just at a desk, in an office
• desk-sharing and good workplace design to increase capacity and reduce costs
• IT that is usable (including away from the office) • security and access arrangements that make it easy,
yet safe, to work in a variety of settings
• behavioural and managerial changes that support flexibility, productivity and effectiveness in all work settings.
Choice of work location
In this vision of how we work, individual offices and ranks of workstations in open plan will be replaced by desk-sharing with touchdown areas for mobile staff, project areas for teamwork and breakout areas for informal meetings. Remote offices – including home – will also become part of the new working environment. As a first step the Government has put in place new workplace standards for the central government office estate. Read more about this in Chapter 5.
New workplace standards
Private sector experience suggests that organisations moving from a deskbound regime to a fully flexible working environment should expect to save 25–30% of office space, with a similar reduction in property