CDtool
—an integrated software package for circular
dichroism spectroscopic data processing, analysis, and archiving
J.G. Lees
a, B.R. Smith
a, F. Wien
a, A.J. Miles
a, B.A. Wallace
a,b,*aDepartment of Crystallography, Birkbeck College, University of London, London WC1E 7HX, UK
bCentre for Protein and Membrane Structure and Dynamics, Daresbury Laboratory, Warrington WA4 4AD, Cheshire, UK
Received 27 April 2004
Abstract
CDtoolis a software package written to facilitate circular dichroism (CD) spectroscopic studies on both conventional lab-based instruments and synchrotron beamlines. It takes format-independent input data from any type of CD instrument, enables a wide range of standard and advanced processing methods, and, in a single user-friendly graphics-based package, takes raw data through the entire processing procedure and, importantly, uses data-mining techniques to retain in the final output all the information associated with the processing. It permits the facile comparison of data obtained from different instruments without the need for reformatting and displays it in graphical formats suitable for publication. It also includes the ability to automatically archive the processed data. This latter feature may be especially useful in light of recent funding institution directives with regard to data sharing and archiving and require-ments for ‘‘good practice’’ and ‘‘traceability’’ within the pharmaceutical industry. In addition,CDtoolincludes a means of interfacing with protein data bank coordinate files and calculating secondary structures from them using alternate definitions and algorithms. This feature, along with a function that permits the facile production of new reference databases, enables the creation of specialized databases for secondary structural analyses of specific types of proteins. Thus theCDtoolsoftware not only enables rapid data processing and analyses but also includes many enhanced features not available in other CD data processing/analysis packages. Ó2004 Elsevier Inc. All rights reserved.
Keywords:Circular dichroism spectroscopy; Synchrotron radiation circular dichroism (SRCD); Archive; Data processing; Software; PDB
Rapid data collection is one of the advantages of using circular dichroism (CD) spectroscopy for the anal-ysis of protein structures. It is the subsequent data pro-cessing and analysis steps that can be surprisingly time consuming. This discrepancy becomes even more acute for synchrotron radiation-based circular dichroism (SRCD)1spectra, which can be accumulated on a very short timescale.
Currently several different software packages are re-quired for processing, comparing, and analyzing CD
data. Data collection and some processing software are usually supplied with commercial CD instruments and each SRCD beamline has developed its own data collection software. The data processing functions from the various instruments tend to differ considerably, which makes cross-instrument processing of data, and thus comparisons, extremely difficult. To surmount these problems in the past, a very simple generic pro-gram (SUPER3) was developed to include a range of processing functions [1] and simple analyses, but this software does not now adequately meet the needs of ever more sophisticated data collection procedures.
Analysis tools developed for CD spectra include a wide range of secondary structure calculation algo-rithms[2–6]which often require reformatting, rescaling, and other manipulations of the data prior to use [7]. 0003-2697/$ - see front matter Ó2004 Elsevier Inc. All rights reserved.
doi:10.1016/j.ab.2004.06.002
*
Corresponding author. Fax: +44-207-631-6803.
E-mail address:[email protected](B.A. Wallace).
1 Abbreviations used:SRCD, synchroton radiation-based circular
dichroism; GUI, graphical user interface; PDB, protein data bank; 3D, three dimensional.
www.elsevier.com/locate/yabio Analytical Biochemistry 332 (2004) 285–289
Recently some of the difficulties with using the available analysis programs have been mitigated by the develop-ment of the DICHROWEB server interface[8,9]. Never-theless, there still remains a gap in the availability of software that would enable the entire process from data collection to data archiving to be undertaken with a sin-gle program. Hence, a new software package (CDtool) has been written to facilitate CD studies; it has distinct advantages over the existing individual programs. It takes format-independent input data all the way through the processing procedure, using data-mining techniques to retain all the information associated with the processing in the final output. It also includes the ability to automatically archive the processed data. This may be especially useful in light of recent funding insti-tution directives with regard to data sharing and archiv-ing [10] and requirements for ‘‘good practice’’ and ‘‘traceability’’ within the pharmaceutical industry.
Program description
CDtool is a multiplatform graphical user interface (GUI) cross-instrument application package for pro-cessing and analyzing CD data. It contains a range of features associated with data handling, from initial pro-cessing to final storage of data and association with re-lated protein data bank (PDB) crystal structure files.
CDtool has been compiled using Microsoft Visual C++ 7 under Windows and GCC version 2.96 under Li-nux. The GUI was written using the cross-platform application development toolkit Qt (version 3.1) [11]. Data are stored within a MySQL v3.0 database [12], which can be hosted locally for archiving, or on a re-mote computer shared by a group of users. A number of other third-party libraries have also been used; the matrix library gMatVec[13], the QWT graphing library [14], and 3D visualization via OpenGL[15], and 3D sur-face plots are rendered using the QwtPlot3D library[16].
Input
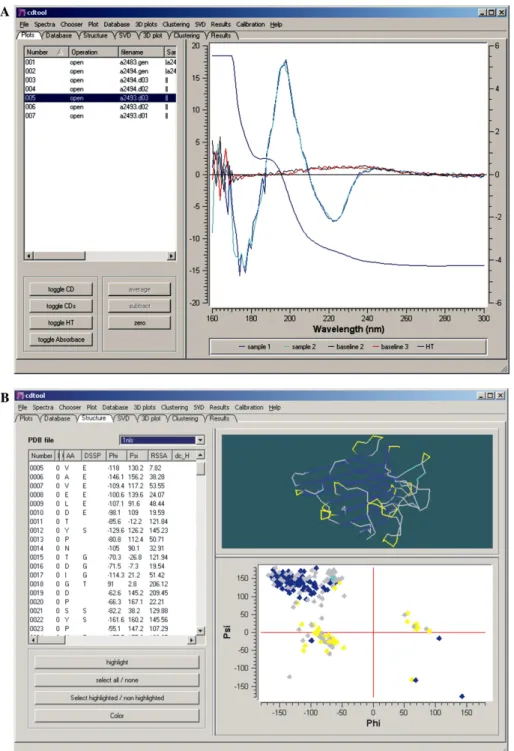
The main window of the CDtool program (Fig. 1A) enables users to input, process, and plot data. Any num-ber of spectra can be input using the open (with browser capability) function; from the input list, any combina-tion of spectra can then be selected for each of the pro-cessing functions by simple highlighting and then toggling the appropriate function button.CDtoolis able to read in file formats produced by several conventional CD instruments and formats produced by various SRCD beamlines. Currently supported formats include those output by Aviv and Jasco instruments and the for-mats produced by the SRCD beamlines at the SRS (CD12), ISA (UV-1), BESSY2, and NSLS (UV9). The
program is capable of automatically determining on which machine the data were collected and converting them to a generic format. The spectra are automati-cally smoothed via a Savitsky–Golay filter [17]. Both smoothed and raw data are plotted, allowing the user to assess the appropriate smoothing interval to be em-ployed and to easily see the reproducibility of the data.
Processing functions
A variety of mathematical functions are included, such as averaging, baseline corrections, addition/subtraction, zeroing (at a single value found at any given wavelength or at the average value over a specified wavelength range), smoothing (selectable interval), and scaling (on an absolute scale or to another spectrum). Averaging of multiple scans can be done either by simple mathematical summation procedures or by use of an autocorrelation function[1]; the latter can potentially be more accurate when the baseline spectrum is either noisy or not feature-less. A correlation coefficient is calculated, which provides an objective means of identifying ‘‘outlier’’ spec-tra. An option that enables the use of a new method for improved calibration, where spectra can be standardized over the entire wavelength range using a second-order polynomial scaling procedure, is also included[18].
Graphical displays
The ‘‘chooser’’ and ‘‘plot’’ tabs and the toggle but-tons allow the choice of spectra and the type and style of plots to be displayed. The CD spectra can be dis-played as either the raw or the smoothed data, and the HT (or dynode values) can be overlaid. This allows the user to easily assess the detector saturation point so that data beyond this can be eliminated from the dataset. Where a detector calibration is provided, the HT can be converted to pseudo-absorbance by previ-ously defined methods [19]. The program includes the ability to convert the data to various types of units (mean residue ellipticity, delta epsilon). In addition, g-factor spectra can be calculated; these can be used in analysis methods when no accurate pathlength or con-centration information is available[20,21].
The program has a zoom function, which enables a more detailed examination of the spectra, and the capac-ity to include error bars (with variable standard deviation levels calculated). It permits overlay of spectra with differ-ent parameters (wavelength, step interval) obtained using different acquisition software on different instruments. The display can be customized in a number of ways, for example titles, headers, fonts, curve styles, and colors.
A further function, accessed by the ‘‘MAP’’ tab, is the rotatable three-dimensional plotting of a series of
related spectra (i.e., a thermal denaturation study) which enables simple simultaneous visualization of changes that occur at all wavelengths.
Output/archiving
Data can be output as graphical plots in postscript or in a number of bitmap formats or sent directly to a prin-ter. Plain text files, which include wavelength, raw, smoothed, averaged, standard deviations, and HT data
and are compatible with other commercial plotting pro-grams and with the DICHROWEB free format can be produced.
Other information associated with a spectrum—such as experimental details and machine parameters—can be quickly accessed and edited via a separate pop-up dialog box. Any information input will be retained in the final output file along with the parameters/functions used in the data processing.
CDtoolcan be remotely connected to a MySQL v3.0 database management system. The database can be set Fig. 1. Screenshots of (A) the main data plotting window and (B) the secondary structure visualization and archiving window.
up locally through scripts provided with CDtool, en-abling the creation of a local archiving database ac-cessed via the ‘‘database’’ tab. After a spectrum has been processed, the user can easily submit the new data to the database. The database is open to complex SQL queries, but attention has been placed on designing fea-tures suitable for those without detailed knowledge of SQL, thereby providing an easy means of archiving the data for future use.
Correlation/association with PDB structures
An important aspect of analyzing CD data is the rela-tionship between the spectrum and the protein structure. The secondary structural features producing CD spectra are not necessarily the same structural features defined by the most commonly used secondary structure assign-ment program DSSP [22], nor are they necessarily the values listed in a PDB file; they may be more closely associated with peptide bond Ramachandran angles and other characteristics[23,24]. To this end, PDB files can be downloaded and associated with the CD spec-trum via the ‘‘Structure’’ tab and then stored in the local database. A 3D viewer (Fig. 1B) provided allows the polypeptide backbones to be displayed and colored using several different secondary structure assignment methods. A zoomable Ramachandran plot colored by secondary structure is displayed in a window next to the 3D viewer. The classifications of each residue are listed in another adjacent window.
This facility enables users to create their own refer-ence databases that can then be used in standard analy-sis programs (such as Selcon3, Contin, and CDSSTR) for secondary structural analyses. This can be done sim-ply by outputting a file of selected spectra for which there are known structures and importing them into the DICHROWEB server [9]for use via the ‘‘custom’’ reference database function. Examples of potential applications of this are (1) to create an entirely new spe-cialized reference database to improve the analyses of proteins with unusual spectral characteristics or struc-tural features (this has been used to produce a specific database for crystallin proteins[25]to enable the exam-ination of mutants of this family of proteins not prop-erly analyzed by any of the existing databases), (2) to use the existing reference databases but change the def-initions of secondary structure included by the original authors to other definitions that may be more suitable for secondary structures that contain unusual elements (i.e., 310 helices or certain types of turns) based on the facilities provided by the PDB visualization window, and (3) to create a subset of proteins from the existing databases (perhaps supplementing it with new spectra) for analyses of specific classes of proteins, i.e., all beta proteins.
Future developments
Future versions will also include secondary structure analysis software, including implementing singular value decomposition, principal component analyses, cluster analyses, and a back-propagation neural network predic-tion algorithm (J.G. Lees et al., unpublished). Addipredic-tional input and output formats and processing functions will be enabled, depending on user feedback received.
Availability
The software (version 1.0) has thus far undergone beta-testing in a number of labs. It is freely available to individual academic users by contacting cdtools@ mail.cryst.bbk.ac.uk. Currently only a Windows version of the program is supported; however, a Linux version is under development. Installation under Windows is per-formed by downloading the setup wizard and following the included instructions. An online manual and other information can be found at http://www.cdtools. cryst.bbk.ac.uk and via the help tab.
Acknowledgments
This work was supported by Grants B13586 and B14225 from the BBSRC to B.A.W. J.G.L. was ported by a BBSRC studentship, and A.M. was sup-ported by an MRC studentship. We thank the researchers in the beta-test sites for helpful discussions.
References
[1] B.A. Wallace, C.L. Teeters, Differential absorption flattening optical effects are significant in the circular dichroism spectra of large membrane fragments, Biochemistry 26 (1987) 65–70. [2] N. Sreerama, R.W. Woody, A self-consistent method for the
analysis of protein secondary structure from circular dichroism, Anal. Biochem. 209 (1993) 32–44.
[3] S.W. Provencher, J. Glockner, Estimation of globular protein secondary structure from circular dichroism, Biochemistry 20 (1981) 33–37.
[4] I.H.M. Van Stokkum, H.J.W. Spoelder, M. Bloemendal, R. Van Grondelle, F.C.A. Groen, Estimation of protein secondary structure and error analysis from circular dichroism spectra, Anal. Biochem. 191 (1990) 110–118.
[5] P. Manavalan, W.C. Johnson Jr., Variable selection method improves the prediction of protein secondary structure from circular dichroism spectra, Anal. Biochem. 167 (1987) 76–85. [6] M.A. Andrade, P. Chaco´n, J.J. Merelo, F. Mora´n, Evaluation of
secondary structure of proteins from UV circular dichroism using an unsupervised learning neural network, Protein Eng. 6 (1993) 383–390.
[7] N. Sreerama, R.W. Woody, Estimation of protein secondary structure from circular dichroism spectra: comparison of CON-TIN, SELCON and CDSSTR methods with an expanded reference set, Anal. Biochem. 287 (2000) 252–260.
[8] A. Lobley, L. Whitmore, B.A. Wallace, DICHROWEB: an interactive website for the analysis of protein secondary structure from circular dichroism spectra, Bioinformatics 18 (2002) 211– 212.
[9] L. Whitmore, B.A. Wallace, DICHROWEB, An online server for protein secondary structure analyses from circular dichroism spectroscopic data, Nucleic Acids Res. 32 (2004) W668–W673. [10] NIH Notice NOT-OD-03-032 (2003) Sharing Research Data. [11] Trolltech AS (1995) Qt.Trolltech AS, Oslo, Norway. [12] MySQL v3.0 (1995) MySQL AB, Sweden.
[13]http://www.gnu.org/software/gama. [14]http://qwt.sourceforge.net/.
[15] D. Shreiner, OpenGL Reference Manual: The Official Reference Document For OpenGL, Release 4, Addison-Wesley, Reading, Massachusetts, (2004).
[16]http://qwtplot3d.sourceforge.net/.
[17] A. Savitsky, M.J.E. Golay, Smoothing and differentiation of data by simplified least squares procedures, Anal. Chem. 36 (1964) 1627–1639.
[18] A.J. Miles, F. Wien, J.G. Lees, A. Roger, R.W. Janes, B.A. Wallace, Calibration and standardisation of synchrotron
radia-tion circular dichroism amplitudes and convenradia-tional circular dichroism spectrophotometers, Spectroscopy 17 (2003) 1–9. [19] J.C. Sutherland, C. Keck, P. Griffin, P.Z. Takacs, Simultaneous
measurement of absorption and circular dichroism in a synchro-tron spectrometer, Nuclear Instr. Meth. 195 (1984) 375–379. [20] P. McPhie, Circular dichroism studies on proteins in films and in
solution: estimation of secondary structure by g-factor analysis, Anal. Biochem. 293 (2001) 109–119.
[21] B.R. Baker, R.L. Garrell, G-factor analysis of protein secondary structure in solutions and thin films, Faraday Disc. 126 (2004) 209–222.
[22] W. Kabsch, C. Sander, Dictionary of protein secondary structure: pattern recognition of hydrogen-bonded and geometrical features, Biopolymers 22 (1983) 2577–2637.
[23] N. Sreerama, R.W. Woody, Structural composition of beta(I)-and beta(II)-proteins, Protein Sci. 12 (2003) 384–388.
[24] S.M. King, W.C. Johnson Jr., Assigning secondary structure from protein coordinate data, Proteins 35 (1999) 313–320.
[25] P. Evans, K. Wyatt, G.J. Wistow, O.A. Bateman, B.A. Wallace, C. Slingsby, The P23T cataract mutation causes loss of solubility of foldedcD crystallin, submitted.