When do politicians pursue more policy information? Journal of Experimental Political Science
A.
Supplementary material
Table of contents
A. Supplementary material ... 1
1. Results of June 2017 vote on Trans Mountain Pipeline Expansion ... 3
2. Text of emailed invitations ... 4
2.1. Control version of the invitation ... 4
2.2. Treatment version of the invitation ... 6
3. Measuring Constituency-Party Disagreement ... 11
4. Model Estimates ... 13
4.1. OLS Models Without Party and Province Covariates...13
4.2. OLS Models With Party and Province Covariates ...15
4.3. Rare Events Models ...19
5. Code used to identify “most similar” constituencies ... 20
List of tables
Table A.1—Results of parliamentary vote on Kinder Morgan Trans Mountain Expansion ... 3
Table A.2—Descriptive statistics of Disagreement measure, by party ... 11
Table A.3—Descriptive statistics of Median Disagreement measure, by party ... 11
Table A.4—Descriptive statistics of Disagree More Than Agree measure, by party... 12
Table A.5—Descriptive statistics of Strong Disagreement measure, by party ... 12
Table A.6—OLS Estimates of the Impact of Constituency-Party Disagreement on the Probability of Accessing Webinar Material (using Disagreement measure) ... 13
Table A.7—OLS Estimates of the Impact of Constituency-Party Disagreement on the Probability of Accessing Webinar Material (using Median Disagreement measure) ... 14
Table A.8—OLS Estimates of the Impact of Constituency-Party Disagreement on the Probability of Accessing Webinar Material (using Disagree More Than Agree measure) ... 14
Table A.9—OLS Estimates of the Impact of Constituency-Party Disagreement on the Probability of Accessing Webinar Material (using Strong Disagreement measure) ... 14
Table A.10—OLS Estimates of the Impact of Constituency-Party Disagreement on the Probability of Accessing Webinar Material (using Disagreement measure), with covariates for MPs’ party and province ... 15
Table A.11—OLS Estimates of the Impact of Constituency-Party Disagreement on the Probability of Accessing Webinar Material (using Median Disagreement measure), with covariates for MPs’ party and province ... 16
Table A.12—OLS Estimates of the Impact of Constituency-Party Disagreement on the Probability of Accessing Webinar Material (using Disagree More Than Agree measure), with covariates for MPs’ party and province ... 17
Table A.13—OLS Estimates of the Impact of Constituency-Party Disagreement on the Probability of Accessing Webinar Material (using Strong Disagreement measure), with covariates for MPs’ party and province ... 18
Table A.14—Rare Event Estimates of the Impact of Constituency-Party Disagreement on the Probability of Accessing Webinar Material (using Disagreement measure) ... 19
Table A.15—Rare Event Estimates of the Impact of Constituency-Party Disagreement on the Probability of Accessing Webinar Material (using Median Disagreement measure) ... 19
Table A.16—Rare Event Estimates of the Impact of Constituency-Party Disagreement on the Probability of Accessing Webinar Material (using Disagree More Than Agree measure) ... 19
Table A.17—Rare Event Estimates of the Impact of Constituency-Party Disagreement on the Probability of Accessing Webinar Material (using Strong Disagreement measure) ... 20
1. Results of June 2017 vote on Trans Mountain Pipeline Expansion
The positions of the parliamentary parties are clear in a vote on federal support for the Trans Mountain Pipeline expansion held on June 6, 2017, approximately one year before we
conducted our field experiment. The text of the motion was as follows:
That the House agree that the Kinder Morgan Trans Mountain Expansion Project: (a) has social license to proceed; (b) is critical to the Canadian economy and the
creation of thousands of jobs; (c) is safe and environmentally sound, as recognized and accepted by the National Energy Board; (d) is under federal jurisdiction with respect to approval and regulation; and (e) should be constructed with the continued support of the federal government, as demonstrated by the Prime Minister personally announcing the approval of the project.
The results of the vote, disaggregated by party, are reported in Table A.1. Of the 301 MPs who voted, only 2—both Liberals from the BC Lower Mainland—rebelled against their party’s position.
Table A.1—Results of parliamentary vote on Kinder Morgan Trans Mountain Expansion
Yea Nay Paired
Liberal 163 2 0 Conservative 87 0 0 NDP 0 39 0 Bloc Québécois 0 9 0 Green Party 0 1 0 Total 250 51 0
Vote held on June 6, 2017 (Division No. 292). Source:
https://www.ourcommons.ca/Parliamentarians/en/votes/42/1/2 92/Party.
2. Text of emailed invitations
2.1. Control version of the invitation Dear «MP_fixed_accents»,
As you know, the proposed expansion of the Trans Mountain Pipeline is in doubt: the BC government and other stakeholders have filed lawsuits to stop the project, the Alberta
government has threatened to retaliate, the federal government is considering legislative and financial help for the project, and Kinder Morgan has set a May 31 deadline to reach an agreement.
As a non-partisan, academic initiative, the Local Parliament Project does not take positions on policy matters—including on the proposed Trans Mountain expansion.
We do, however, believe in empowering MPs by providing them with specialized access to important policy information.
A few months ago, we hosted a webinar on pipelines and energy policy for MPs and their staff. The webinar included presentations from three academic experts: Dr. Kathryn Harrison
(University of British Columbia), Dr. James Meadowcroft (Carleton University), and Dr. Kate Neville (University of Toronto).
Today, in light of the looming deadline for the Trans Mountain pipeline, we are providing you and your staff with access to a recording of this webinar.
To access the video and a written summary of the webinar, please follow the link and enter your parl.gc.ca email address: «link».
We hope that you find this useful. If you have any questions or concerns, please do not hesitate to be in touch with us. We can be reached at:
Peter Loewen: XXX.XXX.XXXX, [email protected]
Daniel Rubenson: XXX.XXX.XXXX, [email protected]
For more information on our project, on our other academic work, and on our partners, please visit www.localparliament.ca.
Yours sincerely, Peter Loewen, PhD
Daniel Rubenson, PhD
---
«fr_salutation»,
Comme vous le savez, le projet d'agrandissement du réseau d’oléoducs Trans Mountain est incertain: le gouvernement de la Colombie-Britannique et d'autres intervenants ont intenté des poursuites pour mettre fin au projet ; le gouvernement albertain a menacé de représailles ; le gouvernement fédéral envisage une aide législative et financière pour le projet et Kinder Morgan a fixé le 31 mai comme date butoir pour parvenir à un accord.
En tant qu'initiative universitaire non partisane, le projet de parlement local ne prend pas position sur des questions de politique, y compris sur l'expansion du réseau d’oléoducs proposée de Trans Mountain.
Nous croyons toutefois à l'autonomisation des députés par le partage d’informations spécialisés sur les enjeux politiques importants.
Il y a quelques mois, nous avons organisé un séminaire en ligne sur les oléoducs et la politique énergétique pour les députés et leur personnel. Le séminaire en ligne comprenait des
présentations de trois experts universitaires : Kathryn Harrison, Ph.D. (Université de la
Colombie-Britannique), James Meadowcroft, Ph.D. (Université Carleton) et Kate Neville, Ph.D. (Université de Toronto).
Aujourd'hui, à la lumière de la date limite imminente pour l’expansion du réseau d’oléoducs Trans Mountain, nous vous offrons à vous et à votre personnel l'accès à un enregistrement de ce séminaire en ligne.
Pour accéder à la vidéo et à un résumé écrit du séminaire en ligne, veuillez suivre le lien et entrer votre adresse courriel Parl.gc.ca: «link».
Nous espérons que vous trouverez cette information utile. Si vous avez des questions ou des préoccupations, n'hésitez pas à nous contacter. Nous sommes joignables aux coordonnées suivantes :
Peter Loewen: XXX.XXX.XXXX, [email protected] Daniel Rubenson: XXX.XXX.XXXX, [email protected]
Pour plus d'informations sur notre projet, sur nos autres travaux universitaires et sur nos partenaires, veuillez visiter le site internet suivant : www.localparliament.ca.
Sincèrement, Peter Loewen, PhD Daniel Rubenson, PhD
2.2. Treatment version of the invitation Dear «MP_fixed_accents»,
As you know, the proposed expansion of the Trans Mountain Pipeline is in doubt: the BC government and other stakeholders have filed lawsuits to stop the project, the Alberta
government has threatened to retaliate, the federal government is considering legislative and financial help for the project, and Kinder Morgan has set a May 31 deadline to reach an agreement.
As a non-partisan, academic initiative, the Local Parliament Project does not take positions on policy matters—including on the proposed Trans Mountain expansion.
We do, however, believe in empowering MPs by providing them with specialized access to important policy information.
A few months ago, we hosted a webinar on pipelines and energy policy for MPs and their staff. The webinar included presentations from three academic experts: Dr. Kathryn Harrison
(University of British Columbia), Dr. James Meadowcroft (Carleton University), and Dr. Kate Neville (University of Toronto).
Today, in light of the looming deadline for the Trans Mountain pipeline, we are providing you and your staff with access to a recording of this webinar.
To access the video and a written summary of the webinar, please follow the link and enter your parl.gc.ca email address: «link».
In addition, we provide below information about your constituents’ preferences on pipelines and energy policy.
To determine your constituents’ preferences and concerns, we have been collecting a very large amount of data. In the 2015 election, we conducted the largest ever study of public
opinion in Canada. Rather than survey just a few thousand Canadians, we conducted a
representative sample of more than 40,000 Canadians.1 Using advanced techniques for
measuring and estimating public opinion, we are able to provide precise estimates of public opinion within each Canadian constituency.
When it comes to pipelines and energy policy, we asked Canadians to respond to the following:
“The federal government should do more to help Canada’s energy sector, including building
oil pipelines.”
Respondents could answer with Strongly disagree; Disagree; Neither agree nor disagree; Agree; or Strongly Agree.
For your constituents in «constituencyname_accented», the distribution of answers was: Strongly disagree (-2) «pos_energy_r_str_disagree_p»
Disagree (-1) «pos_energy_r_disagree_p»
Neither agree nor disagree (0) «pos_energy_r_neither_p»
Agree (1) «pos_energy_r_agree_p»
Strongly Agree (2) «pos_energy_r_str_agree_p»
The average score in your constituency is «pos_energy_r_weighted_score», which is
«pos_energy_r_cat_en». «pos_energy_r_dont_know_p» of your constituents do not have an
opinion on this issue.
These numbers come from a representative sample of «pos_energy_riding_n» of your
constituents. This is a much larger constituency sample than most polls, which would have on average just 3-5 respondents from each electoral district in Canada.
To give you more information, we have also calculated the opinions of your constituency and the 9 constituencies most like yours. This totals «pos_energy_super_riding_n» individuals. The distribution of answers was:
Strongly disagree (-2) «pos_energy_sr_str_disagree_p»
Disagree (-1) «pos_energy_sr_disagree_p»
Neither agree nor disagree (0) «pos_energy_sr_neither_p»
Agree (1) «pos_energy_sr_agree_p»
Strongly Agree (2) «pos_energy_sr_str_agree_p»
The average score in these constituencies is «pos_energy_sr_weighted_score», which is
«pos_energy_sr_cat_en». «pos_energy_sr_dont_know_p» of the constituents in these ridings
do not have an opinion on this issue.
We hope that you find this useful. If you have any questions or concerns, please do not hesitate to be in touch with us. We can be reached at:
Daniel Rubenson: XXX.XXX.XXXX, [email protected]
For more information on our project, on our other academic work, and on our partners, please visit www.localparliament.ca. Yours sincerely, Peter Loewen, PhD Daniel Rubenson, PhD --- «fr_salutation»,
Comme vous le savez, le projet d'agrandissement du réseau d’oléoducs Trans Mountain est incertain: le gouvernement de la Colombie-Britannique et d'autres intervenants ont intenté des poursuites pour mettre fin au projet ; le gouvernement albertain a menacé de représailles ; le gouvernement fédéral envisage une aide législative et financière pour le projet et Kinder Morgan a fixé le 31 mai comme date butoir pour parvenir à un accord.
En tant qu'initiative universitaire non partisane, le projet de parlement local ne prend pas position sur des questions de politique, y compris sur l'expansion du réseau d’oléoducs proposée de Trans Mountain.
Nous croyons toutefois à l'autonomisation des députés par le partage d’informations spécialisés sur les enjeux politiques importants.
Il y a quelques mois, nous avons organisé un séminaire en ligne sur les oléoducs et la politique énergétique pour les députés et leur personnel. Le séminaire en ligne comprenait des
présentations de trois experts universitaires : Kathryn Harrison, Ph.D. (Université de la
Colombie-Britannique), James Meadowcroft, Ph.D. (Université Carleton) et Kate Neville, Ph.D. (Université de Toronto).
Aujourd'hui, à la lumière de la date limite imminente pour l’expansion du réseau d’oléoducs Trans Mountain, nous vous offrons à vous et à votre personnel l'accès à un enregistrement de ce séminaire en ligne.
Pour accéder à la vidéo et à un résumé écrit du séminaire en ligne, veuillez suivre le lien et entrer votre adresse courriel Parl.gc.ca: «link».
En outre, nous fournissons ci-dessous des informations sur les préférences des électeurs de votre circonscription en matière d’oléoducs et de politique énergétique.
Pour déterminer les préférences et les préoccupations des électeurs de votre circonscription, nous avons accumulé une très grande quantité de données. Lors de l’élection de 2015, nous avons mené la plus vaste étude jamais réalisée sur l’opinion publique au Canada. Plutôt que de sonder seulement quelques milliers de Canadiens, nous avons interrogé un échantillon représentatif de plus de 40 000 Canadiens.2 En utilisant des techniques statistiques avancées
pour mesurer et estimer l’opinion publique, nous pouvons offrir des estimations précises à propos de l’opinion des électeurs de chaque circonscription canadienne.
En ce qui concerne les oléoducs et la politique énergétique, nous avons demandé l’opinion des Canadiens à propos de l’énoncé suivant : « Le gouvernement fédéral devrait soutenir
davantage le secteur énergétique au Canada, y compris la construction d’oléoducs. »
Les personnes sondées pouvaient répondre qu’ils étaient fortement en désaccord ; en désaccord ; ni en accord ni en désaccord ; en accord ; ou fortement en accord.
Pour les électeurs de votre circonscription, «constituencyname_accented», la répartition des réponses était la suivante :
Fortement en désaccord (-2) «pos_energy_r_str_disagree_p»
En désaccord (-1) «pos_energy_r_disagree_p»
Ni en accord ni en désaccord (0) «pos_energy_r_neither_p»
En accord (1) «pos_energy_r_agree_p»
Fortement en accord (2) «pos_energy_r_str_agree_p»
Le score moyen dans votre circonscription était de «pos_energy_r_weighted_score», ce qui se situe dans la catégorie « «pos_energy_r_cat_fr» ». «pos_energy_r_dont_know_p» des
électeurs de votre circonscription n'avaient pas d'opinion à ce sujet.
Ces chiffres proviennent d’un échantillon représentatif incluant «pos_energy_riding_n» électeurs de votre circonscription. Cet échantillon est beaucoup plus grand que ce qui est disponible dans la plupart des sondages qui ont en moyenne seulement de 3 à 5 répondants dans chaque circonscription canadienne.
Pour davantage d’information, nous avons aussi calculé l’opinion des répondants de votre circonscription et celle des répondants des neuf circonscriptions les plus semblables à la vôtre. Cet échantillon représente «pos_energy_super_riding_n» individus. La répartition des réponses était la suivante :
Fortement en désaccord (-2) «pos_energy_sr_str_disagree_p»
En désaccord (-1) «pos_energy_sr_disagree_p»
Ni en accord ni en désaccord (0) «pos_energy_sr_neither_p»
2 Pour plus d’informations sur nos techniques d’échantillonnage et sur l’échantillon, veuillez
En accord (1) «pos_energy_sr_agree_p» Fortement en accord (2) «pos_energy_sr_str_agree_p»
Le score moyen de ces circonscriptions était de «pos_energy_sr_weighted_score», ce qui se situe dans la catégorie « «pos_energy_sr_cat_fr» ». «pos_energy_sr_dont_know_p» des électeurs dans ces circonscriptions n'avaient pas d'opinion à ce sujet.
Nous espérons que vous trouverez cette information utile. Si vous avez des questions ou des préoccupations, n'hésitez pas à nous contacter. Nous sommes joignables aux coordonnées suivantes :
Peter Loewen: XXX.XXX.XXXX, [email protected] Daniel Rubenson: XXX.XXX.XXXX, [email protected]
Pour plus d'informations sur notre projet, sur nos autres travaux universitaires et sur nos partenaires, veuillez visiter le site internet suivant : www.localparliament.ca.
Sincèrement, Peter Loewen, PhD Daniel Rubenson, PhD
3. Measuring Constituency-Party Disagreement
In the main text, we develop a continuous measure of the degree to which an MP’s party and their constituency disagreed about federal assistance for energy development. We refer to this as the Disagreement measure. To obtain this measure, we started with the constituency mean scores. Since higher scores on this scale indicate greater support for energy development, we use this as our measure of disagreement for MPs from parties that opposed the expansion of the TransMountain Pipeline: namely, for the NDP, the Bloc Québécois/Groupe parlementaire québécois, and the Green party. For parties that supported the TransMountain expansion—i.e. the Liberals and the Conservatives—we flipped the scale by multiplying by -1 so as to arrive at a measure where higher scores indicate greater disagreement between constituency and party. The descriptive statistics for the Disagreement measure, by party, are reported in Table A.2.
Table A.2—Descriptive statistics of Disagreement measure, by party
mean sd min max count
BQ/GPQ -0.05 0.21 -0.39 0.38 10 CPC -0.32 0.29 -1.01 0.33 96 Green -0.18 . -0.18 -0.18 1 Lib -0.10 0.23 -0.74 0.52 181 NDP -0.08 0.23 -0.55 0.54 43 Total -0.16 0.27 -1.01 0.54 331
We also consider three alternative operationalizations of the disagreement between the MP’s party and their constituency.
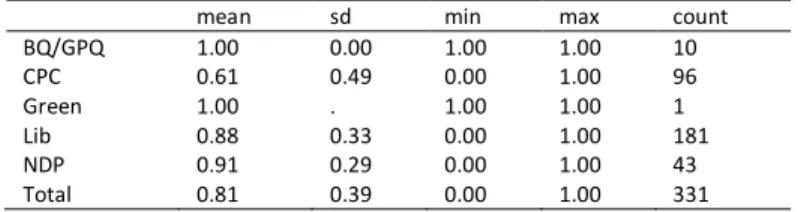
The first alternative operationalization is a binary measure in which a 1 is when the median constituent opposes the MP’s party position. We refer to this as the Median Disagreement
measure. BQ/GPQ, Green, and NDP MPs received a score of 0 if the constituency median responded “Disagree” to the question of more federal help for energy sector and received a score of 1 if the constituency median responded “Agree” to the question of more federal help for the energy sector. CPC and Lib MPs received a score of 0 if the constituency median responded “Agree” and 1 if the constituency median responded “Disagree”. MPs from
constituencies in which the median response was “Neither agree nor disagree” (which was the case in nearly 80% of constituencies) received a score of 1 on the grounds that these
constituencies were not clearly in agreement with the MP’s party position. The descriptive statistics for the Median Disagreement measure, by party, are reported in Table A.3.
Table A.3—Descriptive statistics of Median Disagreement measure, by party
mean sd min max count
BQ/GPQ 1.00 0.00 1.00 1.00 10 CPC 0.61 0.49 0.00 1.00 96 Green 1.00 . 1.00 1.00 1 Lib 0.88 0.33 0.00 1.00 181 NDP 0.91 0.29 0.00 1.00 43 Total 0.81 0.39 0.00 1.00 331
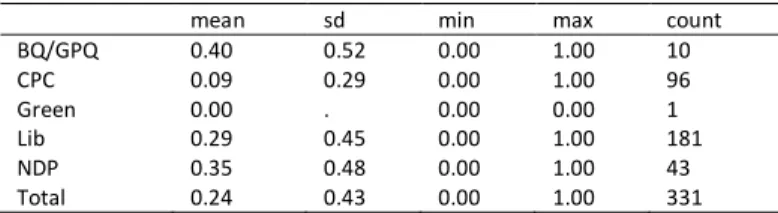
The second alternative operationalization is a binary measure in which a 1 is when the
percentage of constituents who disagree (either strongly or somewhat) with the party position is greater than the percentage of constituents who agree (again, either strongly or somewhat) with the party position. We refer to this as the Disagree More than Agree measure. BQ/GPQ, Green, and NDP MPs received a score of 0 if the percentage of constituents disagreeing with federal help was greater than the percentage of constituents agreeing with federal help. They scored a 1 if the reverse were true. CPC and Lib MPs received a score of 0 the percentage of constituents disagreeing with federal help was less than the percentage of constituents agreeing with federal help. These MPs scored a 1 if the reverse were true. (In six
constituencies, all held by Liberal MPs, the percentage of constituents agreeing and disagreeing with federal help was equal. Consistent with the approach taken above when computing the indeterminate cases for the Median Disagreement measure, we scored these six MPs as 1 on the grounds that these constituencies were not clearly in agreement with the MP’s party position.). The descriptive statistics for the Disagree More than Agree measure, by party, are reported in Table A.4.
Table A.4—Descriptive statistics of Disagree More Than Agree measure, by party
mean sd min max count
BQ/GPQ 0.40 0.52 0.00 1.00 10 CPC 0.09 0.29 0.00 1.00 96 Green 0.00 . 0.00 0.00 1 Lib 0.29 0.45 0.00 1.00 181 NDP 0.35 0.48 0.00 1.00 43 Total 0.24 0.43 0.00 1.00 331
The third and final alternative operationalization is a continuous measure captured as the percentage of constituents who strongly disagree with the party position. We refer to this as the Strong Disagreement measure. BQ/GPQ, Green, and NDP MPs received a score equal to the percentage of their constituents who strongly agreed with federal help for the energy sector. CPC and Lib MPs received a score equal to the percentage of their constituents who strongly disagreed with federal help for the energy sector. The descriptive statistics for the Strong Disagreement measure, by party, are reported in Table A.5.
Table A.5—Descriptive statistics of Strong Disagreement measure, by party
mean sd min max count
BQ/GPQ 9.20 4.57 3.00 15.00 10 CPC 7.51 4.39 0.00 21.00 96 Green 4.00 . 4.00 4.00 1 Lib 10.12 4.95 1.00 25.00 181 NDP 9.30 4.09 0.00 20.00 43 Total 9.21 4.79 0.00 25.00 331
4. Model Estimates
In this section, we report alternative estimates for our regression models. In Subsection 4.1, we report OLS estimates without covariates for MPs’ party and province. In Subsection 4.2, we again report OLS estimates—but this time with covariates for MPs’ party and province. Given the rarity of observing a 1 for our dependent variable (i.e., where an MP’s office accessed the webinar materials), we also ran rare events models as described by King and Zeng (2001). These were implemented in Stata using their -relogit- package. The results of the rare events models can be found in Subsection 4.3.
For each of these three procedures (i.e., OLS without additional covariates, OLS with party and province covariates, and rare events models), we estimated the pertinent relationships for each of the four operationalizations of constituency-party disagreement outlined in Section 3. In each instance, the coefficient capturing the unconditional impact of constituency-party disagreement is not statistically significant, nor is the coefficient capturing the interaction between constituency-party disagreement and the randomized treatment.
4.1.OLS Models Without Party and Province Covariates
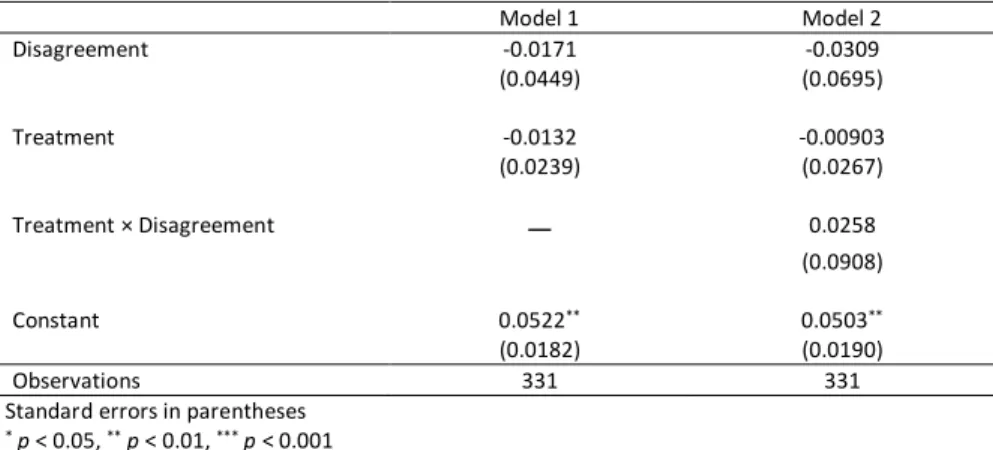
Table A.6—OLS Estimates of the Impact of Constituency-Party Disagreement on the Probability of Accessing Webinar Material (using Disagreement measure)
Model 1 Model 2 Disagreement -0.0171 -0.0309 (0.0449) (0.0695) Treatment -0.0132 -0.00903 (0.0239) (0.0267) Treatment × Disagreement — 0.0258 (0.0908) Constant 0.0522** 0.0503** (0.0182) (0.0190) Observations 331 331
Standard errors in parentheses
* p < 0.05, ** p < 0.01, *** p < 0.001
Note that Table A.6 is identical to Table 1 in the main text. It is reproduced here to facilitate comparison.
Table A.7—OLS Estimates of the Impact of Constituency-Party Disagreement on the Probability of Accessing Webinar Material (using Median Disagreement measure)
Model 1 Model 2
Median Disagreement -0.0393 -0.0633
(0.0365) (0.0614)
Treatment -0.0140 -0.0500
(0.0238) (0.0708)
Treatment × Median Disagreement — 0.0444
(0.0749)
Constant 0.0871* 0.107
(0.0385) (0.0588)
Observations 331 331
Standard errors in parentheses
* p < 0.05, ** p < 0.01, *** p < 0.001
Table A.8—OLS Estimates of the Impact of Constituency-Party Disagreement on the Probability of Accessing Webinar Material (using Disagree More Than Agree measure)
Model 1 Model 2
Disagree More Than Agree 0.0176 0.0148
(0.0303) (0.0418)
Treatment -0.0111 -0.0125
(0.0238) (0.0262) Treatment × Disagree More Than
Agree — 0.00615
(0.0606)
Constant 0.0497** 0.0504*
(0.0190) (0.0202)
Observations 331 331
Standard errors in parentheses
* p < 0.05, ** p < 0.01, *** p < 0.001
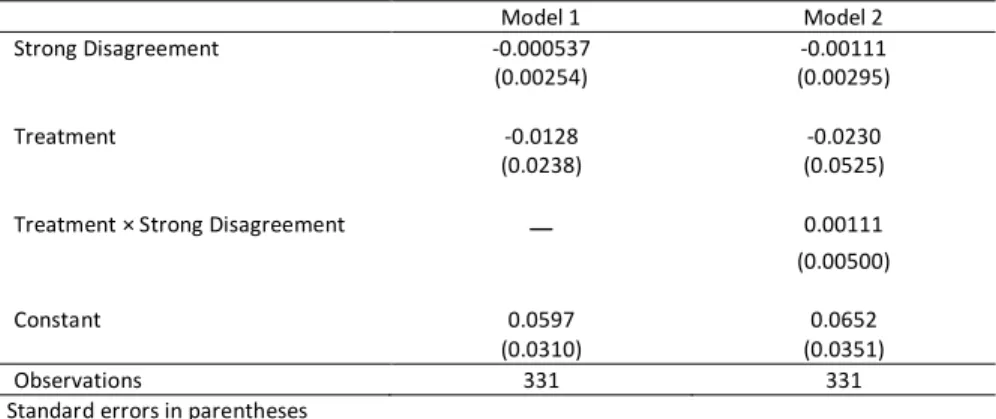
Table A.9—OLS Estimates of the Impact of Constituency-Party Disagreement on the Probability of Accessing Webinar Material (using Strong Disagreement measure)
Model 1 Model 2
Strong Disagreement -0.000537 -0.00111
(0.00254) (0.00295)
Treatment -0.0128 -0.0230
(0.0238) (0.0525)
Treatment × Strong Disagreement — 0.00111
(0.00500)
Constant 0.0597 0.0652
(0.0310) (0.0351)
Observations 331 331
Standard errors in parentheses
4.2. OLS Models With Party and Province Covariates
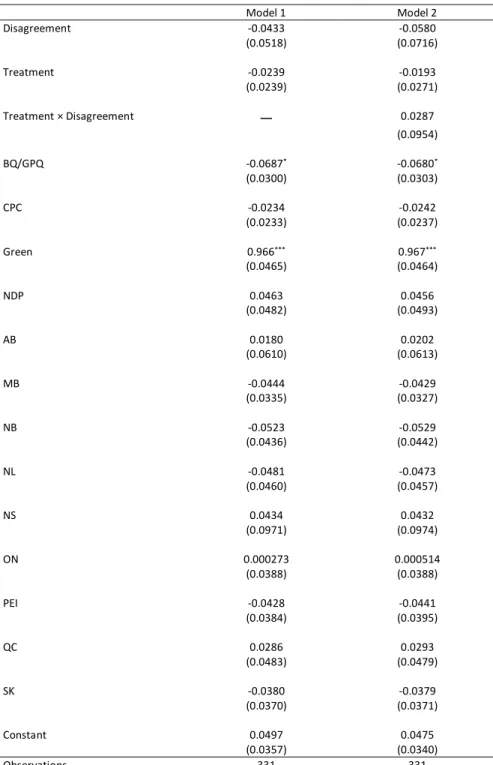
Table A.10—OLS Estimates of the Impact of Constituency-Party Disagreement on the Probability of Accessing Webinar Material (using Disagreement measure), with covariates for MPs’ party and province
Model 1 Model 2 Disagreement -0.0433 -0.0580 (0.0518) (0.0716) Treatment -0.0239 -0.0193 (0.0239) (0.0271) Treatment × Disagreement — 0.0287 (0.0954) BQ/GPQ -0.0687* -0.0680* (0.0300) (0.0303) CPC -0.0234 -0.0242 (0.0233) (0.0237) Green 0.966*** 0.967*** (0.0465) (0.0464) NDP 0.0463 0.0456 (0.0482) (0.0493) AB 0.0180 0.0202 (0.0610) (0.0613) MB -0.0444 -0.0429 (0.0335) (0.0327) NB -0.0523 -0.0529 (0.0436) (0.0442) NL -0.0481 -0.0473 (0.0460) (0.0457) NS 0.0434 0.0432 (0.0971) (0.0974) ON 0.000273 0.000514 (0.0388) (0.0388) PEI -0.0428 -0.0441 (0.0384) (0.0395) QC 0.0286 0.0293 (0.0483) (0.0479) SK -0.0380 -0.0379 (0.0370) (0.0371) Constant 0.0497 0.0475 (0.0357) (0.0340) Observations 331 331
Standard errors in parentheses. The reference category for party is Liberal. The reference category for province is BC.
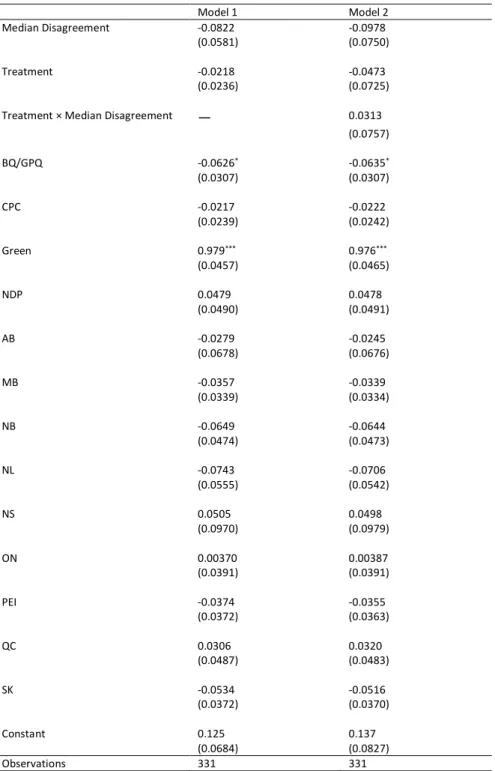
Table A.11—OLS Estimates of the Impact of Constituency-Party Disagreement on the Probability of Accessing Webinar Material (using Median Disagreement measure), with covariates for MPs’ party and province
Model 1 Model 2
Median Disagreement -0.0822 -0.0978
(0.0581) (0.0750)
Treatment -0.0218 -0.0473
(0.0236) (0.0725) Treatment × Median Disagreement — 0.0313
(0.0757) BQ/GPQ -0.0626* -0.0635* (0.0307) (0.0307) CPC -0.0217 -0.0222 (0.0239) (0.0242) Green 0.979*** 0.976*** (0.0457) (0.0465) NDP 0.0479 0.0478 (0.0490) (0.0491) AB -0.0279 -0.0245 (0.0678) (0.0676) MB -0.0357 -0.0339 (0.0339) (0.0334) NB -0.0649 -0.0644 (0.0474) (0.0473) NL -0.0743 -0.0706 (0.0555) (0.0542) NS 0.0505 0.0498 (0.0970) (0.0979) ON 0.00370 0.00387 (0.0391) (0.0391) PEI -0.0374 -0.0355 (0.0372) (0.0363) QC 0.0306 0.0320 (0.0487) (0.0483) SK -0.0534 -0.0516 (0.0372) (0.0370) Constant 0.125 0.137 (0.0684) (0.0827) Observations 331 331
Standard errors in parentheses. The reference category for party is Liberal. The reference category for province is BC.
Table A.12—OLS Estimates of the Impact of Constituency-Party Disagreement on the Probability of Accessing Webinar Material (using Disagree More Than Agree measure), with covariates for MPs’ party and province
Model 1 Model 2
Disagree More Than Agree 0.0147 0.00958 (0.0280) (0.0394)
Treatment -0.0225 -0.0251
(0.0239) (0.0257) Treatment × Disagree More Than
Agree — 0.0113 (0.0629) BQ/GPQ -0.0638* -0.0644* (0.0290) (0.0293) CPC -0.0166 -0.0167 (0.0232) (0.0233) Green 0.980*** 0.981*** (0.0445) (0.0422) NDP 0.0491 0.0485 (0.0484) (0.0500) AB 0.0452 0.0455 (0.0538) (0.0536) MB -0.0423 -0.0417 (0.0330) (0.0322) NB -0.0311 -0.0311 (0.0384) (0.0384) NL -0.0263 -0.0257 (0.0408) (0.0397) NS 0.0574 0.0578 (0.0948) (0.0948) ON 0.00924 0.00935 (0.0380) (0.0378) PEI -0.0478 -0.0474 (0.0398) (0.0388) QC 0.0268 0.0272 (0.0476) (0.0470) SK -0.0262 -0.0264 (0.0344) (0.0348) Constant 0.0424 0.0437 (0.0350) (0.0382) Observations 331 331
Standard errors in parentheses. The reference category for party is Liberal. The reference category for province is BC.
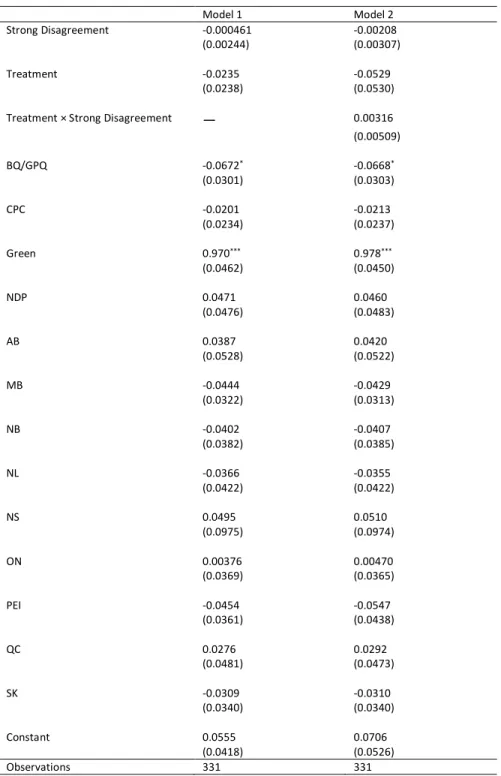
Table A.13—OLS Estimates of the Impact of Constituency-Party Disagreement on the Probability of Accessing Webinar Material (using Strong Disagreement measure), with covariates for MPs’ party and province
Model 1 Model 2
Strong Disagreement -0.000461 -0.00208 (0.00244) (0.00307)
Treatment -0.0235 -0.0529
(0.0238) (0.0530) Treatment × Strong Disagreement — 0.00316 (0.00509) BQ/GPQ -0.0672* -0.0668* (0.0301) (0.0303) CPC -0.0201 -0.0213 (0.0234) (0.0237) Green 0.970*** 0.978*** (0.0462) (0.0450) NDP 0.0471 0.0460 (0.0476) (0.0483) AB 0.0387 0.0420 (0.0528) (0.0522) MB -0.0444 -0.0429 (0.0322) (0.0313) NB -0.0402 -0.0407 (0.0382) (0.0385) NL -0.0366 -0.0355 (0.0422) (0.0422) NS 0.0495 0.0510 (0.0975) (0.0974) ON 0.00376 0.00470 (0.0369) (0.0365) PEI -0.0454 -0.0547 (0.0361) (0.0438) QC 0.0276 0.0292 (0.0481) (0.0473) SK -0.0309 -0.0310 (0.0340) (0.0340) Constant 0.0555 0.0706 (0.0418) (0.0526) Observations 331 331
Standard errors in parentheses. The reference category for party is Liberal. The reference category for province is BC.
4.3. Rare Events Models
Table A.14—Rare Event Estimates of the Impact of Constituency-Party Disagreement on the Probability of Accessing Webinar Material (using Disagreement measure)
Model 1 Model 2 Disagreement -0.403 -0.641 (0.941) (1.258) Treatment -0.269 -0.177 (0.517) (0.618) Treatment × Disagreement — 0.433 (1.886) Constant -2.834*** -2.849*** (0.367) (0.403) Observations 331 331
Standard errors in parentheses
* p < 0.05, ** p < 0.01, *** p < 0.001
Table A.15—Rare Event Estimates of the Impact of Constituency-Party Disagreement on the Probability of Accessing Webinar Material (using Median Disagreement measure)
Model 1 Model 2
Median Disagreement -0.766 -1.030
(0.559) (0.732)
Treatment -0.290 -0.595
(0.519) (0.941)
Treatment × Median Disagreement — 0.468 (1.122)
Constant -2.179*** -1.974**
(0.546) (0.605)
Observations 331 331
Standard errors in parentheses
* p < 0.05, ** p < 0.01, *** p < 0.001
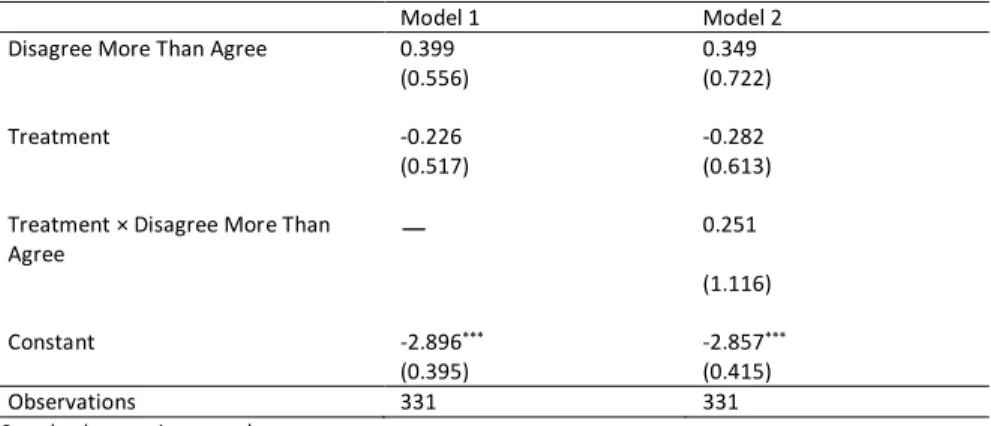
Table A.16—Rare Event Estimates of the Impact of Constituency-Party Disagreement on the Probability of Accessing Webinar Material (using Disagree More Than Agree measure)
Model 1 Model 2
Disagree More Than Agree 0.399 0.349
(0.556) (0.722)
Treatment -0.226 -0.282
(0.517) (0.613)
Treatment × Disagree More Than
Agree — 0.251
(1.116)
Constant -2.896*** -2.857***
(0.395) (0.415)
Observations 331 331
Standard errors in parentheses
Table A.17—Rare Event Estimates of the Impact of Constituency-Party Disagreement on the Probability of Accessing Webinar Material (using Strong Disagreement measure)
Model 1 Model 2
Strong Disagreement -0.00699 -0.0125 (0.0569) (0.0601)
Treatment -0.256 -0.439
(0.516) (1.151)
Treatment × Strong Disagreement — 0.0217 (0.115)
Constant -2.705*** -2.628***
(0.639) (0.647)
Observations 331 331
Standard errors in parentheses
* p < 0.05, ** p < 0.01, *** p < 0.001
5. Code used to identify “most similar” constituencies
Each MP in the treatment condition was provided with two types of riding estimates. The first estimate was the distribution of opinion among survey respondents living in the MP’s
constituency, as identified by postal code. The second estimate was the distribution of opinion in the MP’s constituency and the nine other constituencies most like it.
We identified these “most similar” constituencies through a block-matching technique that leverages observable data from the official Canadian census, as well as select political variables such as party vote shares and turnout. For each constituency, the 9 most similar constituencies are identified with replacement for other constituencies. Accordingly, one constituency may appear in a large number of similar-constituency estimates. The average N of these “super ridings” is 1056, sd=225, min=452, max=1650.
The following code was used with the R package blockTools.
\begin{verbatim}
findSimilarRidings <- function(data, n_similar = 1, id_var = NULL, province_var = NULL, block_vars = NULL, samp_size_var = NULL, verbose = FALSE){
## How many ridings in data? n_units <- nrow(data)
## Calculate vcov matrix from all units: cov_matrix <- cov(data[, block_vars]) ## Initialize storage:
storage <- data.frame(matrix(NA, n_units, n_similar + 3)) ## Name columns of storage:
names(storage) <- c(“Riding”, paste0(“Similar”, 1:n_similar), “SimSampleSize”, “MaxDist”)
## For each unit in the data set: for(idx in 1:n_units){
## Store the riding name:
## If verbose is TRUE, print the status:
if(verbose == TRUE){cat(“Starting unit “, idx, “: “, riding_name, “\n”, sep = “”)}
## Subset the data to include only the current unit’s province:
data_province <- data[data[, province_var] == data[idx, province_var], ] ## Store the row number of the current unit:
which_province_id <- which(data_province[, id_var] == riding_name) ## Store how many units in this province:
n_units_province <- nrow(data_province) ## Subset data for distance calculation: m <- data_province[, block_vars]
## Name rows of distance data matrix: row.names(m) <- data_province[, id_var]
dist_vec <- sqrt(mahalanobis(m, t(m[which_province_id,]), cov_matrix)) nearest_n <- sort(dist_vec)[2:(n_similar + 1)]
storage[idx, 1] <- riding_name
storage[idx, 2:(n_similar + 1)] <- names(nearest_n)
storage[idx, (ncol(storage) - 1)] <- sum(data[data[, id_var] %in% names(nearest_n), samp_size_var]
)
storage[idx, ncol(storage)] <- max(nearest_n, na.rm = TRUE) } return(storage) } ## To run: ## Load blockTools: library(blockTools) ## Load sample data:
riding.data.for.grouping <- read.csv(“~/Dropbox/local-parliament/ Field Experiment/design-pre-analysis/riding-data-for-grouping3.csv”) similar_ridings <- findSimilarRidings(data = riding.data.for.grouping, n_similar = 9, id_var = “ed.nr2", province_var = “reg.can”, block_vars = c(“vote.con15", “vote.ndp15”, “vote.lib15", “vote.bloc15”, “vote.green15", “income”, “pop”, “immigrant”, “unemployed”), samp_size_var = “riding.n2”, verbose = TRUE)
## To view all similar ridings: similar_ridings
## Only the top few: head(similar_ridings)
## To plot 2 dimensions of the data: library(ggplot2)
## Select a set of similar ridings to highlight: row_to_highlight <- 6 ## this choses the 3rd row, e.g. riding.data.for.grouping$tmp_highlight <- 0
riding.data.for.grouping$tmp_highlight[riding.data.for.grouping$ed.nr %in% riding.data.for.grouping$ed.nr[(riding.data.for.grouping$ed.nr %in% similar_ridings[row_to_highlight, 1])]] <- 1
riding.data.for.grouping$tmp_highlight[riding.data.for.grouping$ed.nr %in% riding.data.for.grouping$ed.nr[(riding.data.for.grouping$ed.nr %in% similar_ridings[row_to_highlight, 2:ncol(similar_ridings)])]] <- 2
ggplot(riding.data.for.grouping, aes(income, pop)) + geom_point(aes(color = factor(tmp_highlight))) +
stat_ellipse(level = c(.8)) \end{verbatim}`
Power Analysis
8/19/2019
First, using the existing data, we extract the standardized effect sizes for the difference-in-means, and the interaction effect.
library(haven)
pipelines_original <- read_dta("pipelines_fullvar.dta")
pipelines <- pipelines_original[,c( accessed , disagreement )] simple_ate <- mean(subset(pipelines_original, Z == 1)$accessed)
-mean(subset(pipelines_original, Z == 0)$accessed)
pooled_sd <- sqrt((sd(subset(pipelines_original, Z == 1)$accessed) + sd(subset(pipelines_original, Z == 0)$accessed))/2)
effect_size <- simple_ate/pooled_sd # standardized interaction effect
interaction_effect <- as.numeric(coef(lm(accessed ~ Z*disagreement,
data=pipelines_original))[4])
interaction_effect_size <- interaction_effect/(sqrt(sd(pipelines_original$accessed))) The design declaration for the first model is fairly straightforward: a difference-in-means using the observed ATE and noise that is distributed normally withmu= 0andsigma2 = 1. A random number seed is used for
reproducibility.
# set seed to preference set.seed(08192019) library(DeclareDesign)
design_model1 <- declare_population(N = N, noise = rnorm(N)) + declare_potential_outcomes(Y ~ effect_size * Z + noise) + declare_estimand(ATE = mean(Y_Z_1 - Y_Z_0)) +
declare_assignment(prob = 0.5) + declare_reveal(Y, Z) +
declare_estimator(Y ~ Z, model = lm_robust, term = "Z", estimand = "ATE" )
Withtheseconddesigndeclaration,fordiagnosingthedesignatlargersamplesizesthantheexistingobserved samplesize,itisnecessarytoassumeadistributionfortheincludedpre-registeredcovariate,disagreement, whichrepresentsconstituencydisagreement.Inthiscase,itisnormallydistributedusingtheobservedmeanin thedatasetanditsobservedstandarddeviation,orN≥(≠0.161,0.265).Thisisaplausibleassumptiongiven
theexistingdistributionofthecovariate,asshowninFigures1and2,thoughtheresultsaresubstantively similarusingadifferentdistribution.
The design declaration for the second model uses the same observed ATE and parameters for the noise as the first model, and then uses the observed standardized interaction effect size. The estimand is a difference in means acounting for the continous interaction effect.
design_model2 <- declare_population(N = N,
disagreement = rnorm(N, mean(pipelines$disagreement), sd(pipelines$disagreement)),
noise = rnorm(N)) +
declare_potential_outcomes(Y ~ effect_size * Z + effect_size * disagreement +
interaction_effect_size * disagreement * Z + noise) + declare_estimand(ATE = mean(Y_Z_1 - Y_Z_0), interaction = interaction_effect_size) + declare_assignment(prob = 0.5) + declare_reveal(Y, Z) + declare_estimator( Y ~ Z + disagreement + Z * disagreement, model = lm_robust, term = c("Z", "Z:disagreement"),
estimand = c("ATE", "interaction") )
Each of the designs is assesed atN= 331,500,1000,3000for 1,000 simulations.
designs_model1 <- redesign(design_model1, N = c(331, 500, 1000, 3000, 5000)) designs_model2 <- redesign(design_model2, N = c(331, 500, 1000, 3000, 5000)) simulations_model1 <- simulate_design(designs_model1, sims = 1000)
simulations_model2 <- simulate_design(designs_model2, sims = 1000)
Figure 3 shows the power analyses at each of the designated sample sizes for the difference-in-means estimand.
0.00 0.25 0.50 0.75 1.00 1000 2000 3000 4000 5000 Sample Size P o w er Estimand ATE
In this case, we vary the effect size starting with the observed effect sizes and then according to the typical values for Cohen’s D, where 0.2 is considered to be a small effect, 0.5 is considered to be a medium-sized effect, and 0.8 is considered to be a large effect.
observed_effect_size <- effect_size
observed_interaction_effect_size <- interaction_effect_size rm(effect_size)
rm(interaction_effect_size)
designs_model1 <- redesign(design_model1,
effect_size = c(observed_effect_size, -0.2, -0.5, -0.8))
designs_model2 <- redesign(design_model2,
effect_size = c(observed_effect_size, -0.2, -0.5, -0.8),
interaction_effect_size = c(observed_interaction_effect_size, 0.2, 0.5, 0.8)
simulations_model1 <- simulate_design(designs_model1, sims = 1000) simulations_model2 <- simulate_design(designs_model2, sims = 1000)
Figures 5-9 show the results. The study is sufficiently powered to detect small, medium, and large effect sizes.
0.00 0.25 0.50 0.75 1.00
Observed Effect Size Small Medium Large
Effect Size P o w er Estimand ATE