Discussion Paper No. 05-75
Does Public Scientific Research
Complement Industry R&D Investment ?
The Case of NIH Supported Basic and
Clinical Research and Pharmaceutical Industry R&D
Discussion Paper No. 05-75
Does Public Scientific Research
Complement Industry R&D Investment ?
The Case of NIH Supported Basic and
Clinical Research and Pharmaceutical Industry R&D
Andrew A. Toole
Die Discussion Papers dienen einer möglichst schnellen Verbreitung von neueren Forschungsarbeiten des ZEW. Die Beiträge liegen in alleiniger Verantwortung
der Autoren und stellen nicht notwendigerweise die Meinung des ZEW dar. Discussion Papers are intended to make results of ZEW research promptly available to other economists in order to encourage discussion and suggestions for revisions. The authors are solely
responsible for the contents which do not necessarily represent the opinion of the ZEW. Download this ZEW Discussion Paper from our ftp server:
Non-technical Summary
Policymakers in the U.S. and abroad are engaged in an ongoing debate about the proper role of government in the development of scientific and technical knowledge. The debate centers on how much public money should be spent on scientific research and on which areas of research should receive funding. Policymakers who support public funding believe this research creates knowledge that complements private industry R&D investment by providing new ideas for products or processes or by helping firms to solve technical problems with their existing projects. On the other side, those who want to discontinue or reduce public funding believe this research substitutes for private R&D investment by drawing important research inputs out of the private sector or by funding a project that would otherwise have been pursued by industry firms.
This paper sheds light on the relationship between publicly financed biomedical research, which is performed mainly in university and non-profit research labs, and the investment behavior of private pharmaceutical firms. The main question in the paper asks if public basic and clinical research complement private industry R&D. An increase in industry investment in response to public research is strong evidence supporting a complementary relationship.
New micro-level data on public research investment by the U.S. National Institutes of Health allow measures of basic and clinical research in seven medical areas to be included in a distributed lag model explaining pharmaceutical R&D investment. These data are combined with data on pharmaceutical global R&D investment and sales to analyze the relationship between public and private R&D investment within technology areas over time.
The analysis finds strong evidence that both public basic and clinical research are complementary to pharmaceutical R&D and, thereby, stimulate private industry investment. However, differences in the importance and degree of scientific and market uncertainty between basic and clinical public research lead to differences in the magnitude and timing of the pharmaceutical investment response. The results indicate that a dollar increase in public basic research stimulates an additional $8.38 in pharmaceutical investment after eight years. The industry R&D response to public clinical research is smaller in magnitude and shorter in duration with a dollar increase in public clinical research stimulating an additional $2.35 in pharmaceutical investment over a three year period.
Does Public Scientific Research Complement Industry R&D Investment?
The Case of NIH supported Basic and Clinical Research and Pharmaceutical
Industry R&D*
Andrew A. Toole October 2005
Abstract
This research investigates the hypothesis that publicly funded scientific research complements private R&D investment in the pharmaceutical industry. New micro-level data on public research investment by the U.S. National Institutes of Health allow measures of basic and clinical research in seven medical areas to be included in a distributed lag model explaining pharmaceutical R&D investment. Using a panel of therapeutic classes observed over eighteen years, the analysis finds strong evidence that public basic and clinical research are complementary to pharmaceutical R&D and, thereby, stimulate private industry investment. However, differences in the relevance and degree of scientific and market uncertainty between basic and clinical public research lead to differences in the magnitude and timing of the pharmaceutical investment response. The results indicate that a dollar increase in public basic research stimulates an additional $8.38 in pharmaceutical investment after eight years. The industry R&D response to public clinical research is smaller in magnitude and shorter in duration with a dollar increase in public clinical research stimulating an additional $2.35 in pharmaceutical investment over a three year period.
Keywords: R&D, pharmaceuticals, NIH, distributed lag models
JEL-Classification: C23, L65, H51, O32
Address: Rutgers University
Department of Agriculture, Food and Resource Economics Cook College Office Building
55 Dudley Road
New Brunswick, NJ 08901 United States
E-Mail: toole@aesop.rutgers.edu
* I would like to thank the conference participants at the “Evaluation of Government Funded R&D Activities” conference in Vienna, Austria, May 2003, as well as those attending the Econometric Society North American Summer Meeting at Northwestern University’s Kellogg School of Management, June 2003. Comments by Dan Rich and Dennis Carlton were particularly helpful. I would also like to thank Pfizer, Inc., for financial support of the data construction process required for this research. All opinions, analysis and potential errors are my responsibility. Part of this research was completed while visiting the Centre for European Economic Research (ZEW), Mannheim, Germany.
1 Introduction
Policymakers in the U.S. and abroad are engaged in an ongoing debate about the
proper role of government in the development of scientific and technical knowledge. The
debate centers on how much public money should be spent on scientific research and on
which areas of research should receive funding. Policymakers who support public funding
believe this research creates knowledge that complements private industry R&D investment.
They view this research, which is performed predominantly in universities and non-profit
institutions, as providing new ideas for products or processes or as helping firms to solve
technical problems with their existing projects. On the other side, those who want to
discontinue or reduce funding believe public research substitutes for private R&D
investment. They believe this research crowds-out private investment by drawing important
research inputs out of the private sector or simply substitutes for private R&D by funding a
project that would otherwise have been pursued by industry firms. (David et al. 2000a,
2000b)
Recognizing that complementarity and substitutability may happen concurrently and
along dimensions that are not completely observable or measurable, existing research focuses
on estimating the “net” effect of publicly funded R&D on private R&D. In a recent survey of
the econometric evidence accumulated over the past 35 years, David et al. (2000a) report that
most studies find complementarity, however, the overall literature is mixed and
inconclusive.1 The authors point out that the net effect found in many studies depends
critically on the nature of the public research under investigation as well as the particular
technological opportunity and appropriability conditions facing private firms.
This paper addresses the heterogeneity in publicly funded research and industry
response by specifying an empirical model of R&D investment by the pharmaceutical
industry across medical technology classes. Focusing on the pharmaceutical industry
appropriability conditions while distinguishing between medical technology classes addresses
heterogeneity in opportunities across scientific areas of research. Similar to previous work
(Wiggins 1983, Jaffe 1989, Ward and Dranove 1995) this distinction makes it possible to
analyze the relationship between public and private R&D investment within technology areas
over time.
The data and econometric improvements used this paper set it apart from the existing
research by Ward and Dranove (1995). Unique and comprehensive grant and contract award
data covering all of the U.S. National Institutes of Health (NIH) funding allow accurate
measurement of public research investments into medical areas. For each medical class,
these data allow public biomedical research funding to be separated by character of research
into basic “laboratory” research and clinical “human” research. This is a significant
advantage because pharmaceutical industry investment responds differently depending on the
character of public research in question. Econometrically, the analysis addresses the
endogeneity of industry sales in the R&D investment decision using exogenous measures of
hospital admissions and mortality as instrumental variables.
Using 2SLS on a panel of seven medical classes over the 1981-1997 period, the
estimation results show that both public basic and clinical research complement private
pharmaceutical R&D. However, pharmaceutical investment responds differently to each type
of public research. For public basic research, which is characterized by a high degree of
uncertainty in its scientific “maturity’ and its potential market applicability, changes in
pharmaceutical investment have a “U” shape. Firms respond quickly to new information
from public basic research then, after a period of holding the level of investment constant and
allowing scientific and market uncertainties to resolve, firms again increase private R&D
investment. This finding is consistent with established theory on investment under
1.69 and suggests a dollar increase in public basic research stimulates an additional $8.38 of
industry R&D investment after eight years.
Relative to basic research, public clinical research has very little scientific or market
uncertainty and this difference is reflected in the timing of the pharmaceutical investment
response. The industry R&D response to public clinical research is shorter in duration and
smaller in magnitude. The results suggest that firms increase private R&D investment in
response to public clinical research within the first three years with no significant impact
thereafter. The long-run elasticity estimate is 0.40 and suggests a dollar increase in public
clinical research stimulates an additional $2.35 of industry R&D investment after three years.
The paper begins with a discussion of the interaction between public and private
research drawn mainly from case study evidence on pharmaceutical innovation. Section III
outlines the empirical model of pharmaceutical investment while section IV discusses the
data. Section V presents the estimation results and section VI contains concluding remarks.
2
Interaction between Public Research and Pharmaceutical R&D
How public scientific research influences private R&D depends on the nature of the
research problems that industry scientists face in the pharmaceutical innovative process.
There are two stages in this process, called drug discovery and drug development, and each
stage involves a unique set of research activities. Drug discovery or “pre-clinical” research
involves a wide spectrum of laboratory and non-human research activities ranging from
identification of new drug concepts through to animal models and compound patenting.
Having identified a promising new compound, drug development follows this stage with a
full set of human clinical trials to determine compound safety and efficacy before seeking
Paralleling this division of industry research, public research investment can also be
separated by character of research activity.3 Basic or “fundamental” biomedical research can
be broadly defined as bench-level laboratory research directed at the discovery and
characterization of physiologically active substances and the definition of metabolic
pathways related to normal and disease function. Public clinical biomedical research is
patient-oriented research involving human subjects, including epidemiological research but
excluding social, behavioral, occupational, and health services research.4
In both pharmaceutical research stages, the overall influence of public research will
be determined by the degree to which industry scientists draw from and add to public
scientific knowledge. Since it is not feasible to observe, measure and aggregate across
individual scientists to calculate a “net flow” of knowledge from public research to industry
R&D, the interpretation of the direction and magnitude established by statistical methods
must rely on insights gained from case studies.5
There is a substantial body of case study research that describes a predominantly
complementary relationship between private industry R&D investment and public basic
research.6 Most of this research highlights the role that basic research plays in opening up
new avenues to therapeutic outcomes. It is useful to think of the new therapies being pursued
by industry scientists as “therapeutic jigsaw puzzles” that must be completed before any new
drug treatment can be taken to the market. Using this analogy, public basic research is
providing either completely new puzzles or it is “resurrecting” puzzles that were previously
believed to be unsolvable. In either situation, almost all of the case studies characterize the
new puzzles emerging out of public basic research as “embryonic.” (Colyvas 2002) These
puzzles are in their early stages of scientific development and may only embody the faintest
research is characterized by a high degree of uncertainty in both its scientific “maturity” and
its potential market applicability.
Beyond supplying new ideas for therapies, public basic research can contribute to
industry solutions by providing “puzzle pieces” or by providing the clues required for
discovering new pieces. In the case studies, these pieces and clues take the form of methods
for identifying target compounds, validating these targets, scaling-up the quantities for animal
and human testing, as well as laboratory models for animal studies. (OTA 1993, Cockburn
and Henderson 1997, NIH 2000, Arora and Gambardellla 1994, Gambardella 1995) Because
of the complexity and diversity of the puzzles confronting industry scientists, the pieces
drawn from public basic research are rarely the “plug and play” variety. Information from
this research must be “shaped” to fit the specific puzzle under investigation. Moreover, when
public basic research only provides clues, new pieces must be invented to fit the puzzle.7
While most observers believe that public clinical research is complementary to
industry research, there is relatively little case study evidence shedding light on this
interaction.8 The most specific type of clinical research, the drug trial, is a pure substitute for
private industry research. At least with respect to a specific compound, a publicly supported
clinical trial allows the industry to use their R&D resources elsewhere. If, for instance, a
particular compound is shown to be toxic or ineffective, industry researchers do not need to
spend additional funds to duplicate that research. This being said, the knowledge gained
about a compound’s absorption, toxicity, elimination, side-effect, and efficacy profile may
provide valuable information to industry scientists. Using the specific knowledge gained
from a publicly supported clinical trial, industry researchers might investigate a modified
compound from the same “chemical family” or a modified dosage regime and find a safe and
effective drug.
Cockburn and Henderson (1997) and others point out that publicly supported clinical
promising new indications are revealed from early phase clinical trials performed in the
public sector, the industry may choose to pursue the full complement of clinical trials
necessary for FDA approval. This type of complementarity may also arise in cases where the
expected market value of a new use is low due to a high degree of uncertainty. Gelijns et al.
(1998) suggest that public sector clinical researchers may have an important role to play in
reducing uncertainty and perhaps facilitating the adoption of new drug candidates by industry
firms. Moreover, public epidemiologic studies help the industry gauge demand for new
therapies in the patient population. These alternative types of public clinical research are
likely to stimulate additional investment by the industry.
The most recent empirical contribution looking directly at the relationship between
public and private R&D investment is Ward and Dranove (1995).9 Their analysis relates
pharmaceutical investment to NIH research obligations using a panel of five therapeutic
classes observed between 1970 and 1988. The authors’ data did not allow them to
differentiate between basic and clinical research. Instead, they use total financial obligations
by National Institute (such as the National Cancer Institute, the National Heart Lung and
Blood Institute, and so on) as a measure of public “basic” research in each therapeutic area.
Unfortunately, NIH obligations by institute are a diverse set of financial commitments
including basic, clinical, administrative, training, demonstration, construction, and other
activities. Their main finding indicates that a 1% increase in NIH research obligations leads
to an increase in industry R&D of 0.6% to 0.7 % after a lag of seven years.
3
The Model of Pharmaceutical Investment
The empirical model of pharmaceutical R&D presented below follows the investment
framework described in David et al. (2000a). This framework is commonly used in the
literature and has been applied to pharmaceutical investment using firm level data by
postulates that the level of investment is determined by the interaction between the marginal
cost of capital (MCC) and the marginal rate of return (MRR). Factors that affect the
availability of funds, such as sales revenue and interest rates, determine the shape and
position of the MCC schedule. Factors that affect the demand, cost, and probability of
success in research, such as health status, FDA regulatory stringency, and public scientific
knowledge, determine the shape and position of the MRR schedule. Together, the
equilibrium level of investment is determined.
In the empirical model used here, this framework is specified across medical
technology classes. The factors affecting the availability of funds include gross revenues
from sales and dummy variables to account for differences across classes and shifts over time
due to, among other things, changes in the cost of capital. The factors that affect the returns
to industry investment include measures of demand, proxies for basic and clinical public
scientific knowledge, FDA regulation, and dummy variables to account for differences across
classes and shifts over time due to, among other things, changes in drug regulations. The
reduced form fixed effects model for an individual therapeutic class, i, in year, t, is:
Equation (1):
Iit is industry R&D investment in therapeutic class, i, and year, t and Sit-1 is sales revenue in
class, i, in the previous year, t-1. Gross sales revenue is a measure of the availability of funds
for R&D investment and is lagged one year to reflect the pharmaceutical budgeting process
(Grabowski 2000).10 Bit-j is a distributed lag of public basic research investment in class, i, and year, t-j. Cit-j is a distributed lag of public clinical research investment in class, i, and year, t-j. The data allow these distributed lags to extend back nine years prior to industry
investment.
∑
∑
= = − − − −+
+
+
+
+
+
+
+
=
9 1 9 1 3 1 2 1 1 0ln
ln
ln
ln
ln
ln
j j it t i it it j it j j it j it itS
B
C
R
D
a
I
β
β
α
δ
β
β
γ
ε
Rit-1 is a measure of FDA regulatory stringency. Dit represents a group of drug demand
measures for class, i, and year, t. A sub-group of these measures, the ones that have no effect
on industry R&D, are potential instruments for industry sales. The therapeutic class
unobserved effect is ai and the time dummies are γt. εit is an idiosyncratic error with the standard properties.
In order to estimate equation (1), the industry R&D series must be weakly dependent.
However, using a standard Dickey-Fuller test, it is not possible to reject the null that industry
R&D is a unit root process.11 High persistence in the pharmaceutical investment series is
hardly surprising when one remembers that it takes an average of twelve to fifteen years to
develop a new drug.12 To make the series weakly dependent, the analysis uses the
log-difference estimator. Differencing the equation eliminates the therapeutic class fixed effects
and specifies the equation in growth rates. The new estimating equation (2) is:
The main hypotheses are that public basic and clinical research complement industry
R&D investment in the long-run. To reduce multicollinearity and smooth the private
investment response, the finite distributed lags for public basic and clinical research are
restricted to lie on a 2nd degree polynomial. These are commonly referred to as Almon lags.13
Across time, the estimated lag coefficients may be investment stimulating (positive lag
coefficient) or investment saving (negative lag coefficient) for the industry depending on the
nature and evolution of research projects in each sector. The long-run elasticity is calculated
as the sum of the statistically significant lag coefficients. A positive long-run elasticity is
interpreted as evidence supporting complementarity where public research stimulates
additional private pharmaceutical investment. A negative long-run elasticity, however, is not
conclusive evidence for substitution. Substitution has the additional requirement that firms
∑
∑
= = − − − − + ∆ + ∆ + ∆ + ∆ +∆ +∆ ∆ = ∆ 8 1 8 1 3 1 2 1 1 ln ln ln ln ln ln j j it t it it j it j j it j it it S B C R D I β α δ β β γ εwould have undertaken the research themselves and this cannot be determined from the
available data.
In equation (2), growth in sales, ∆ln(Sales), should be viewed as endogenous. A common rule-of-thumb for industry executives is to set R&D investment as a fixed
proportion of sales. (Grabowski et al. (1980, 2000)) Moreover, in a review of research in this
area, Scherer (1996) points out that industry R&D growth may simply reflect an endogenous
response to “the actual rise in gross profitability” instead of changes in response to “richer
technological opportunities.” (Scherer (1996), p. 269) Scherer (2001) explores this
relationship further using industry time-series data and finds a positive relationship between
gross profitability and R&D spending. Moreover, the causation runs in the opposite direction
as well. R&D spending ultimately feeds back to determine sales revenue. This feedback is a
violation of the strict exogeneity assumption needed for consistency of estimators.
To correct for endogeneity, I need instruments that do not belong in the industry R&D
investment equation (2) but are also highly correlated with industry sales. Valid instruments
may come from the group of hospital admissions and mortality demand measures as long as
they meet these two conditions. In the empirical section, I use a two-step approach. First I
determine the potential set of instruments from the demand variables by finding out which of
these variables are appropriately excluded from the investment model. Next, from the set of
potential instruments, I determine which of these has a strong partial correlation with
pharmaceutical sales. Any demand measures that meet these criteria are valid instruments. It
is important to recognize that the instruments are determined exogenously in the patient
population and are not under the direct control of the pharmaceutical R&D decision makers.
For the empirical model, I assume these measures are strictly exogenous.
While the empirical model used in this paper improves on the current literature, there
are two modeling limitations that should be noted and addressed in future research. First,
channels through which public research and private R&D interact. At this point, research
efforts intended to explore the channels such as publications, personal networks, and so on,
face significant data limitations. The model in this paper treats the channels as an implicit
“black box.”14
Second, the model assumes that public research investment is exogenous to the
private R&D decision by pharmaceutical firms. This is reasonable since pharmaceutical
R&D decision makers have no direct control over the quantity or allocation of Federal
research funding. Based on the lags in the model, public research is clearly a predetermined
variable; however, the assumption does rule out feedback from current industry R&D to
future public research investment. Failure of this strict exogeneity assumption can lead to
inconsistency of the estimators. These limitations should be kept in mind when interpreting
the empirical results.
4
Data and Descriptive Statistics
To estimate the impact of public basic and clinical research on industry investment, I
use a panel of 7 medical therapeutic classes with observations running from 1981-1997.
The therapeutic classes are defined by the U.S Department of Commerce, Bureau of Census.
This classification scheme has been used by the industry to group R&D and sales data since
the early 1960s. Seven therapeutic classes are considered: endocrine/neoplasm (cancer),
central nervous system, cardiovascular, anti-infective, gastro-intestinal/genito-urinary,
dermatologic, and respiratory.
The empirical analysis uses public investment into basic and clinical research as
proxies for the generation of scientific knowledge. The proxies are defined using detailed
data on grant and contract awards by the U.S. Department of Health and Human Services,
particularly the NIH. The NIH is the largest public agency supporting biomedical research in
FY 2002 budget. Further, the American Association for the Advancement of Science reports
that the NIH is the second largest public agency supporting R&D in the U.S. after the
Department of Defense and the largest agency supporting undirected or “basic” research.
(AAAS 2001)
While the limitations of using investment flows to proxy for knowledge generation
are well known, investment flows have at least three advantages over other measures of
knowledge creation. First, other indicators such as patent and publication counts, perhaps
weighted by citations, capture only one form of codified knowledge. At least in principle,
investment proxies are general enough to capture all forms of knowledge creation, either
codified or tacit. Second, investment flows are not restricted to any particular channel of
dissemination. Only looking at published papers, on the other hand, misses public research
flows that happen through conferences, networks or consulting. Third, other indicators of
research output are not under the control of policymakers whereas the allocation of public
funds for research is one of the most important policy tools available.
The investment proxies for public basic and clinical research knowledge are defined
using the CRISP database (Computer Retrieval of Information on Scientific Projects)
maintained by the NIH and covering the years 1972-1996. These data contain specific
information about each biomedical grant and contract awarded by the NIH and other agencies
in the DHHS. A multistage procedure was used to separate these data by character of
research (basic, clinical, other) and further allocate grants and contracts to therapeutic classes.
(Refer to Appendix A for a detailed description of the procedure.) This process results in
seven public basic research flows and seven clinical research flows for every year in the
CRISP database for 1972-1996. These flows are deflated using the NIH Biomedical
Research and Development Price Index (BRDPI) maintained by the Bureau of Labor
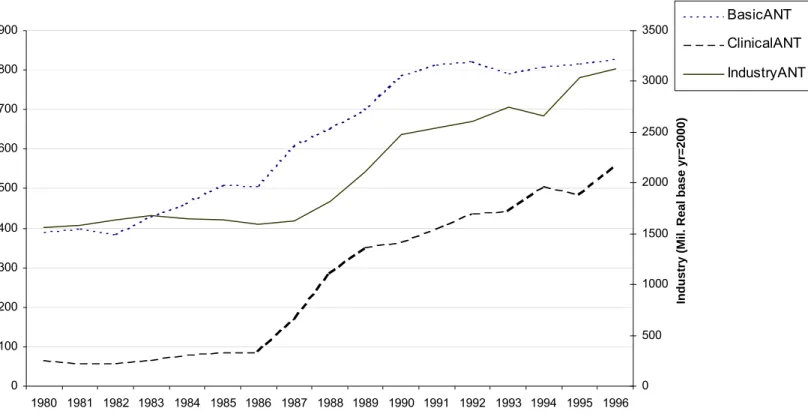
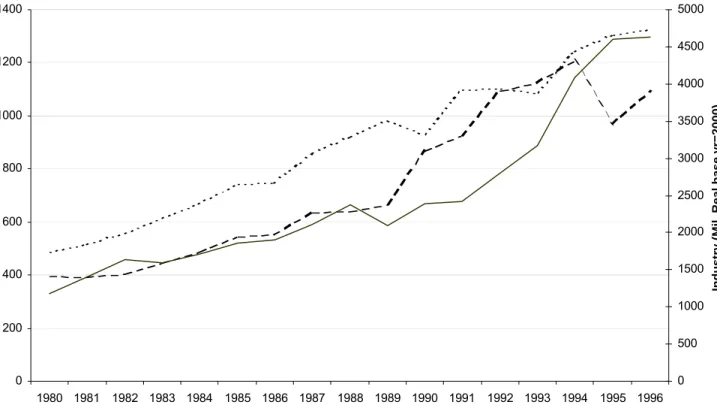
Statistics (base year is 2000). Figure 1 shows the broad level breakout of the complete
4 plot the real flows of industry R&D and the real flows of public basic and clinical research
for three of the seven therapeutic classes over the 1980 to 1996 period.
Pharmaceutical industry investment and sales by therapeutic class were gathered from
various years of the Annual Survey report published by Pharmaceutical Research and
Manufacturers Association (PhRMA). The R&D data correspond to PhRMA member R&D
investment in the U.S. and abroad. The sales figures correspond to total industry sales,
including non-PhRMA members, in the U.S. and sales of U.S. companies abroad. The
nominal flows were deflated using the BLS Producer Price Index for Pharmaceutical
Preparations (base year is 2000).
Regulatory stringency proxies by therapeutic class and year are constructed using data
from the U.S. Food and Drug Administration. Following Wiggins (1983), the proxy is
defined to be the average delay in months between the date of submission of a New Drug
Application and the date of FDA marketing approval. If more than one compound is
approved in a particular therapeutic class, then the regulatory delay variable is an arithmetic
average of the observed review periods. For instance, if a therapeutic class has two approved
drugs in a particular year, one with a ten-month delay and another with a fourteen month
delay, then the delay period used in the analysis would be twelve months. This averaging
methodology is intended to capture how pharmaceutical firms adjust their expectations of
FDA regulatory review.
The demand variables and potential instruments are hospital admissions and mortality
rates by therapeutic class and year in five age groups. These data were gathered from the
National Center for Health Statistics and grouped into therapeutic classes using the
ICD-9-CM (International Classification of Diseases Ninth Edition, Clinical Modification).
Classification was performed at the 3-digit diagnosis level for each of the five age groups:
less than 35 years old, 35-44 years old, 45-54 years old, 55-64 years old, and 65 and older.
National Hospital Discharge survey and are defined per 1000 population. Similarly, the
mortality rates come from the National Vital Statistics System, multiple-cause-of-death file,
and are defined per 1000 population.
5
Estimation Results and Discussion
The empirical analysis takes place in two steps. The first step consists of three pooled
OLS regressions that are used to determine which variables belong in the model. This is a
necessary first step since it is unknown which of the hospital admissions and mortality
demand variables are potential instruments for pharmaceutical sales. If these variables have a
significant effect on pharmaceutical R&D, then they should not be excluded from the model
and are not valid IV candidates. Having determined the IV candidates and verified their
partial correlation with pharmaceutical sales, the second step in the analysis consists of three
pooled 2SLS regressions.
Before turning to the actual estimates, it is also important to recall that the lag
distributions for public basic and clinical research are specified as 2nd degree polynomials.15
The coefficient estimates for the quadratic polynomial terms are reported in the tables. The
implied lag coefficient estimates and their statistical significance will be reported and
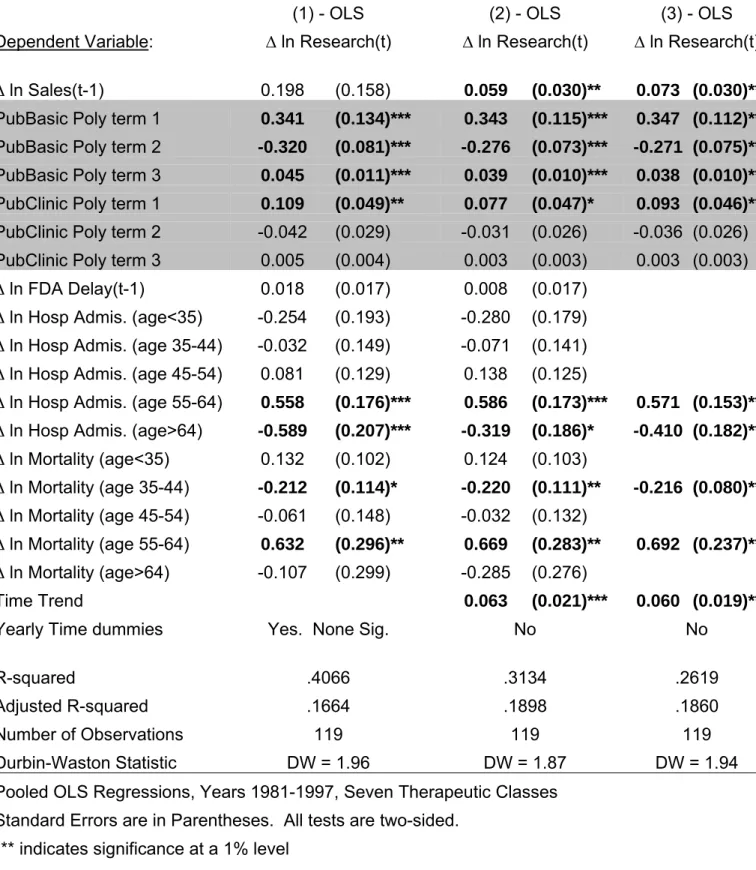
discussed for the final specification of the 2SLS model. In Tables II and III, the explanatory
variables that are statistically significant are shown in boldface. The bottom of each table
lists various regression diagnostics.
Columns (1)-(3) of Table II report the OLS regression results. Column (1) contains
the “fully specified” model that includes all of the available explanatory variables including
year time dummies. Since the year time dummies are not jointly or individually significant,
the model in column (2) replaces these with a time trend. Model (3) cleans up the
Looking across the regressions in Table II, it is evident that both public basic and
clinical research significantly impact the growth of pharmaceutical R&D investment. The
quadratic specification works well for public basic research, however, both the linear and
quadratic terms are insignificant for public clinical research. This will be addressed in the
2SLS regressions in Table III. Growth in pharmaceutical sales is significant in models (2)
and (3) when the time dummies are dropped and replaced with a linear time trend. The
insignificance of industry sales in model (1) is probably due to multicollinearity between
industry sales and the time dummies. The effect of FDA regulatory delay, which is a proxy
for regulatory stringency, is not economically or statistically significant in either model (1) or
(2) and is dropped in model (3).
As for the patient demand variables, four of the ten are significant. The results
indicate that pharmaceutical R&D investment increases strongly in response to the health
conditions of people in the 55-64 year old age group. These are the conditions driving
increases in hospital admissions and mortality. However, growth in pharmaceutical R&D
falls in response to greater hospital admissions for people over sixty-four. It is difficult to
know exactly why this occurs but it could reflect that fact that hospital admissions for the
oldest people are for conditions that are not amenable to drug therapy. Also, growth in
pharmaceutical investment decreases with higher mortality rates in those individuals between
35 and 44 years old. This probably reflects the fall in expected returns to investment as these
potential customers are lost.
While the OLS regressions are the proper place to start, Scherer and others note that
the volume of pharmaceutical sales is an endogenous variable in a pharmaceutical investment
model. On the one hand, increases in sales lead to greater R&D investment, either by
providing internal funds for investment or by capturing expected demand; on the other hand,
current R&D leads to future sales. Of the six potential IV candidates identified in the first
IV. This variable has strong partial correlation with pharmaceutical sales in a first stage
regression with a t-statistic of -2.19 and a p-value < 0.03 while the other variables have no
significant partial correlation with sales. Consequently, one valid instrument is available and
the 2SLS regressions presented in Table III are just-identified.
Columns (1)-(3) of Table III report the 2SLS regression results. Column (1) uses the
same specification as model (3) of Table II. As is typical in an instrumental variables
regression, the standard errors are larger than the OLS regressions and, consequently, hospital
admissions for people over sixty-four years of age are insignificant. The time trend also
becomes insignificant. The model in column (2) drops these variables. The final model,
which is given in column (3), tightens up the specification on public clinical research. High
multicollinearity between the polynomial terms for public clinical research is the likely
culprit for the insignificance of the linear and quadratic terms; however, these terms are not
jointly significant using a standard F-test. Dropping the quadratic term dramatically reduces
the standard errors for public clinical research and the linear term is now significant. This
confirms the presence of multicollinearity. While model (3) is used for the subsequent
discussion, one could easily use model (2) as well. The only difference between the models
is that model (3) gives slightly larger magnitudes for the effects of public basic and clinical
research while model (2) provides a more intuitive shape for the lag distribution for public
clinical research (quadratic versus linear).
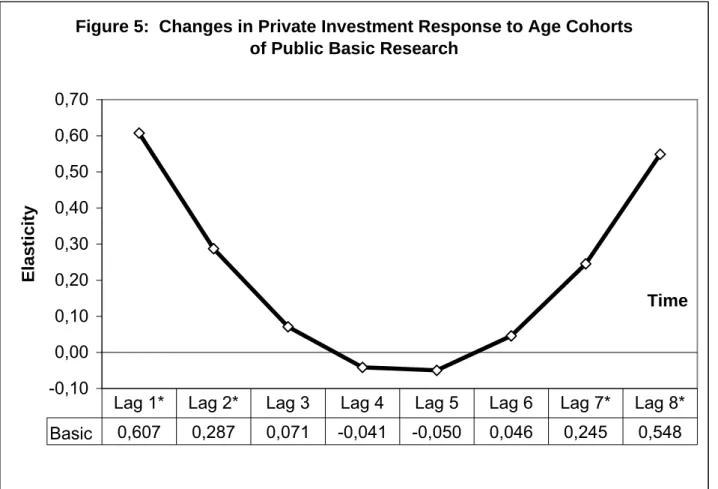
The empirical analysis finds strong evidence that public basic research is
complementary to private pharmaceutical R&D investment and, thereby, stimulates
additional private investment. Using the estimated polynomial parameters in model (3) of
Table III, Figure 5 graphs and reports the estimates of the underlying lag coefficients for
public basic research. Each of these lag coefficients is an elasticity and measures the
percentage change in the growth of pharmaceutical R&D in response to a one percent
elasticities reported at the bottom of Figure 5 are significantly different from zero. These are
the first two lags and the final two lags of public basic research. Using a two-sided test, the
values of each of these coefficients are, respectively: value < 0.006, value < 0.034,
p-value < 0.026 and p-p-value < 0.002. The long-run elasticity, which is the sum of the
statistically significant lag coefficients across time, is 1.69. This is over twice as large as the
elasticity found by Ward and Dranove (1995); however, the estimates are not directly
comparable since their analysis used a very different model and data.
What about the “U” shape of the industry response over time to public investment in
basic research? Recall that public investment is a proxy for scientific knowledge generated
by research institutions outside the pharmaceutical industry, primarily universities. Scientific
knowledge generated by basic research is characterized by a high degree of uncertainty with
respect to both its scientific “maturity” or “completeness” and its potential market
application. The newest ideas emerging from public basic research are the most uncertain
and will appear in the first lag. With each successive year, these ideas are further developed
by researchers in public research institutions. As the idea “ages” and moves through the lag
distribution many of the scientific and market uncertainties will be resolved. The latter part
of the lag distribution, lags seven and eight, represent knowledge from public basic research
that has evolved through seven or eight years of further development.
To understand the time profile of the private pharmaceutical investment response one
must look to the theory of investment under uncertainty described by Pindyck (1991) and
Dixit (1992). A fundamental insight of this work is that a firm’s optimal investment response
can involve waiting or delaying investment until uncertainties have been sufficiently
resolved. Further, the theory points out that the value of waiting depends on the degree of
uncertainty and the degree of inter-firm competition. Greater uncertainty increases the value
The results shown in Figure 5 illustrate both a competitive effect and a waiting effect.
The newest ideas emerging from public basic research elicit an initial burst of investment by
pharmaceutical firms as they try to evaluate this new information, build absorptive capacity
and compete with rival firms. This is a competitive “buy-in” effect. After this initial burst,
firms maintain their research programs and monitor research progress at universities and
other research institutions. It is in this period that firms exercise their option to wait and do
not significantly increase investment. When scientific and market uncertainties are
sufficiently resolved, an average of seven years following the emergence of the original idea,
pharmaceutical firms again significantly increase their investment in response to public basic
research.16 It is important to note that the level of private investment does not fall over this
period. Figure 6 shows how the level of private pharmaceutical investment responds over
time to changes in public basic research.
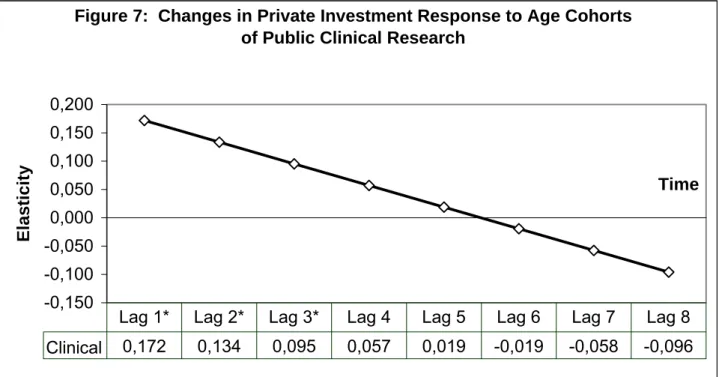
The empirical analysis also finds strong evidence that public clinical research is
complementary to private pharmaceutical R&D investment and, thereby, stimulates
additional private investment. However, relative to public basic research, public clinical
research has very little scientific or market uncertainty. Accordingly, the value of waiting is
much smaller and one should see firms responding quickly to new and valuable information,
particularly when competitive pressures are strong. This is exactly the pattern that emerges
from the analysis. Figure 7 shows that pharmaceutical R&D investment increases in the first
three years following public investment in clinical research. After this, there is no significant
change in private investment as public clinical research “ages.” Using a two-sided test, the
p-values of each of the first three lags of public clinical research are, respectively: p-value <
0.018, p-value < 0.02 and p-value < 0.032. Summing the coefficient estimates of these three
lags gives a long-run elasticity for public clinical research of 0.40. Figure 8 shows how the
level of private pharmaceutical investment responds over time to changes in public clinical
The results from model (3) in Table III also show that changes in pharmaceutical sales
and patient demand influence the growth in pharmaceutical R&D investment. With the
impact of expected demand on pharmaceutical investment is held constant, the partial effect
of pharmaceutical sales measures how changes in the availability of internal funds affects
pharmaceutical R&D investment.17 A 10% increase in internal funds leads to a 5% increase
in R&D investment and this is strongly significant with a p-value < 0.05. In previous work,
Giaccotto (2004) find a slightly larger elasticity of 0.58; however, their estimate includes
both a cash flow and an expected demand effect. The demand variables, which were
discussed above in the context of the OLS specification, have larger magnitudes in the 2SLS
regressions.
It is informative for policy purposes to calculate the marginal impacts of the key
explanatory variables on pharmaceutical R&D investment. The marginal impact is calculated
as the product of the long-run elasticity and the ratio of mean pharmaceutical R&D
investment to the mean of the variable of interest. The marginal effects, consequently,
depend on the relative magnitude of the measured variables. Table IV reports these data for
public basic research funding, public clinical research funding and industry sales. A $1
increase in public basic research generates an $8.38 increase in private pharmaceutical R&D
after eight years. A $1 increase in public clinical research generates a $2.35 increase in
private R&D after three years. With respect to industry sales, each new dollar of revenue
increases next year’s R&D investment by 8 cents.
6 Conclusion
This paper sheds light on the relationship between publicly financed biomedical
research, which is performed mainly in university and non-profit research labs, and the
investment behavior of private pharmaceutical firms. The main question in the paper asks if
investment in response to public research, reflecting the genesis of new projects or the further
development of “embryonic” ideas, is strong evidence supporting a complementary
relationship. The analysis finds that both public basic research and clinical research
investment stimulate additional private pharmaceutical R&D.
There are three other notable conclusions stemming from this research. First, to
evaluate how private investment responds to public research investment it is critically
important to take into account the character of the public research under investigation.
Depending on the information content and the degree of uncertainty characterizing the public
research, the investment behavior of firms will be different in both magnitude and timing.
Second, the pharmaceutical investment response to public basic research is over 3.5 times
larger than it is for public clinical research. This suggests that public basic research is more
important to the pharmaceutical innovative process than public clinical research. However,
looking back at Figure 1, it is clear that the NIH has dramatically increased clinical research
investment relative to basic research investment since the early 1990s. This trend will
probably reduce the future opportunities for new drug innovation stemming from public
research. Third, this analysis finds that internal cash flow is an important determinant of
pharmaceutical R&D. If price controls on pharmaceutical products are put in place, as many
policymakers favor, pharmaceutical R&D investment will fall.
While this paper improves both the data and econometric method used in previous
research, the empirical findings should be viewed as suggestive rather than definitive. The
diverse and interactive nature of public and private research in the pharmaceutical industry
makes it difficult to pinpoint individual effects and attach causal interpretations. Future
research should focus on developing empirical models of public-private interaction that
explicitly identify the channels of information exchange and relax the strict exogeneity
Further, one should be cautious about interpreting the marginal impacts too literally.
The NIH investment flows are proxies in the analysis for all of public research investment.
Clearly, there are contributions to investment from other public institutions in the U.S. and
abroad. Assuming the NIH funding flows provide a good relative picture of basic versus
clinical investment, the log-log functional form implies the elasticity estimates are valid even
without having total world public research investment figures in the study. However, the
story is not the same when one tries to calculate marginal impacts because these estimates
depend on accurate figures for total world investment in basic and clinical public research.
For instance, if the NIH represents 50% of the total world investment into public basic and
clinical research, a number that probably underestimates the NIH share, then the marginal
impacts are themselves scaled down by 50%.
It is also important to keep in mind that universities are the primary performers of
basic and clinical public research analyzed in this paper. In addition to the creation of new
knowledge, public support of university research helps to train both undergraduate and
graduate students. These students may become employed in the pharmaceutical industry and
carry with them the research knowledge and experience made possible through public support
of their training. So, it is not possible to separately identify complementarity due to
disembodied knowledge spillovers and complementarity due to the transfer of knowledge in
people. Both mechanisms are probably important and, given improvements in data, future
research should try to decompose the impact of public research into its labor and pure
Appendix A: Data Construction
Proxies for public basic and clinical research investment are created using the CRISP database (Computer Retrieval of Information on Scientific Projects) maintained by the NIH and covering the years 1972-1996. This database contains information on extramural and intramural biomedical research grant and contract awards by the NIH and other governmental agencies under the authority of the U.S. Public Health Service. (These other agencies include the FDA, the Center for Disease Control, the Agency for Health Care Policy and Research, and so on.) For each grant and contract the database contains: record ID, investigator name, title of project, narrative description of project, organization receiving the award, address, administrative organization of the NIH or other agency, award amount, type of award, fiscal year of award, city, and state. Using a second administrative NIH database, called IMPAC, CRISP records were supplemented to include the scientific review group that recommended approval. A scientific review group is a committee of peers within a scientific field that review grant applications and recommend applications for approval to the National Advisory Councils.
Identifying relevant research took place in two stages. This first stage separates all awards into three groups (mixed, clinical, and other) using the “type of award code” field. (These are codes like R01 for traditional research award or K08 for clinical investigator award.) A second step in this stage requires taking the mixed group and separating out any remaining clinical and other awards using keyword searches over the grant and contract titles. This finalizes the breakout into basic, clinical, and other. The second stage takes the basic and clinical groups and separates them into the seven therapeutic classes and a general category. This is done is five steps. First, eliminate agencies that do not fund basic or clinical research relevant to the pharmaceutical industry. This eliminates organizations like the CDC, the National Library of Medicine, the National Institute of Nursing Research, and so on. Second, match scientific review groups to their respective therapeutic areas. Third, use keyword filters to further sort those grants and contracts not matched by scientific review group. Fourth, allocate the remaining uncategorized grants and contracts to therapeutic classes using the Institute codes. For instance, the remaining National Cancer Institute grants go to the endocrine/neoplasm class; the remaining National Eye Institute goes to the central nervous system class, and so on. Fifth, for those Institutes which are too general to be classified (such as the National Institute of General Medicine), allocate these grants and contracts across the seven classes in proportion to those successfully categorized.
The process results in seven public basic research flows and seven clinical research flows for every year in the CRISP database, 1972-1996. These flows are deflated using the NIH Biomedical Research and Development Price Index (BRDPI) maintained by the Bureau of Labor Statistics (base year is 2000). Figure 1 shows the broad level breakout of the complete CRISP database into basic, clinical, and other research types in real dollars.
Notes
1. Most of this literature is focused on the impact of publicly funded research that is performed directly by the private firms receiving the money. The current paper considers the impact of public financing of research that is performed mostly by non-profit research scientists in universities and asks how this research affects private R&D investment. Guellec et al. (2000), in a recent contribution to this literature, find that government funded research performed directly by firms stimulates additional firm R&D while government funded research performed by universities reduces industry R&D investment. While this finding does not support the complementarity hypothesis, the authors point out that they are only able to allow a four year lag in the relationship between university and industry research.
2. The separation of research into medical therapeutic classes is a similar delineation of research problems and solutions by broad character.
3. Public research is scientific research that is financially supported with public funds and performed almost exclusively in hospitals, not-for-profit research institutes and universities.
4. This definition is more restrictive than the definition of clinical research put forth by the NIH Director’s Panel on Clinical Research. (NIH 1997) However, the NIH definition of clinical research has been criticized as being too broad. (Reichert et al. 2002)
5. To assess complementarity versus substitutability using investment it is also necessary to track how private R&D funding decisions respond to information from public research.
6. Maxwell et al. (1990), OTA (1993), Cockburn and Henderson (1997), NIH (2000), Reichert et al. (2002), Colyvas (2002).
7. The discussion here encompasses the idea of “absorptive capacity” which posits that private firms must be actively investing in research in order to access, evaluate, and use public scientific knowledge. (Cohen and Levinthal 1989, Arora and Gambardella 1994)
8. Maxwell and Eckhardt (1990) find that clinical research played an important role in the initiation of 23% of the 30 lines of research in their study. (page xxiii) However, they define the term clinical to mean “…the research was carried out in humans or human material
[emphasis added].” In the current paper, clinical research is defined to include only research involving actual patients. Consequently, research using “human material” is included in the basic research category to the extent that it did not involve direct contact with patients.
9. There is an active empirical literature that attempts to measure the connectedness between public and private research and relate this to productivity in the pharmaceutical industry. Cockburn and Henderson (2000) provide a good overview. This literature, however, is not directly relevant to this analysis. This analysis explores the relationship between R&D inputs and not between public research and industry productivity.
10. Scherer (2001) examines the relationship between gross profitability and pharmaceutical R&D. Vernon (2004) points out that industry sales serve two roles: an indicator of expected profitability and internal funds for investment. Since the model used here already includes controls for demand that affect expected profitability, the partial effect of gross sales is interpreted as measuring the impact of internal financing. The availability of internal funds
for financing investment is important when capital markets are imperfect. See Hubbard (1998) for a discussion.
11. A Dickey-Fuller test with trend and an augmented Dickey-Fuller test were also performed. The null hypothesis of a unit root for industry R&D could not be rejected in either test. Also, the augmented DF test did not indicate any dynamic misspecification.
12. Henderson and Cockburn (1996) also found high persistence in the R&D process in their analysis using proprietary firm data.
13. I would like to thank the editor for suggesting this formulation. An earlier draft of this research left the lag coefficients completely unrestricted. Imposing the polynomial restrictions leads to slightly larger coefficient estimates but does not change the research findings. These restrictions do facilitate interpretation, however, by eliminating fluctuations in the lag estimates that resulted from multicollinearity between the public research flows.
14. See Cohen et al. (2002) to learn about the many channels that link public and private R&D. Also, see Cockburn and Henderson (2000) for a review of recent empirical work using measures that focus on specific channels like publication co-authorships.
15. Higher order polynomial terms are not significant for either public basic research or public clinical research.
16. An anonymous referee suggested the possibility that the industry response to the newest public research ideas, as captured in lags 1 and 2, could be spurious and simply represent a simultaneous public and private investment response to some scientific breakthrough. If this is true, public and private investment should be contemporaneously correlated as both groups of decision makers respond to the breakthrough. To explore this possibility, contemporaneous public investment was included in the model but was always insignificant with a coefficient near zero. While pharmaceutical decision makers are clearly responding to the most promising research findings emerging from publicly funded research, there does not appear to be any omitted source of scientific breakthroughs that induces a simultaneous reaction by both public and private investors.
17. As noted by an anonymous referee, the pharmaceutical sales data used in the analysis include sales by non-PhRMA members in addition to PhRMA members. Theoretically, the sales data should only represent PhRMA member firms. However, since aggregate totals show that the non-PhRMA members make up a small share of total sales; this is unlikely to significantly influence the results.
References
American Association for the Advancement of Science (AAAS). (2001). Report XXVI Research and Development FY 2002, May 2001, (www.aasa.org/spp/dspp/rd/).
Arora, Ashish, Alfonso Gambardella. (1994). “Evaluating Technological Information and Utilizing It,” Journal of Economic Behavior and Organization, Vol. 24, No. 1, pp. 91-114.
Cockburn, Iain, M., Rebecca Henderson. (1997). “Public-private Interaction and the Productivity of Pharmaceutical Research,” NBER Working Paper No. 6018, Cambridge, MA, April 1997.
Cockburn, Iain M., Rebecca M. Henderson. (2000). “Publicly Funded Science and the
Productivity of the Pharmaceutical Industry,” in Innovation Policy and the Economy, Volume 1, Adam B. Jaffe, Josh Lerner, and Scott Stern (editors), Cambridge: The MIT Press.
Cohen, Wesley M., D.A. Levinthal. (1989). “Innovation and Learning: The Two Faces of R&D,” Economic Journal, Vol. 99, pp. 569-596.
Cohen, Wesley M., Richard R. Nelson and John P. Walsh. (2002). “Links and Impacts: The Influence of Public Research on Industrial R&D,” Management Science, Vol. 48, No. 1, January 2002, pp. 1-23.
Colyvas, Jeannette, Michael Crow, Annetine Gelijns, Roberto Mazzoleni, Richard R. Nelson, Nathan Rosenberg, Bhaven N. Sampat. (2002). “How do university inventions get into practice?” Management Science, Vol. 48, No. 1, January 2002, pp. 61-72.
David, Paul A., Bronwyn H. Hall, Andrew A. Toole. (2000a). “Is public R&D a complement or substitute for private R&D? A review of the econometric evidence,” Research Policy, Volume 29, No. 4-5, pp. 497-529.
David, Paul A., Bronwyn H. Hall. (2000b). “Heart of Darkness: modeling public-private funding interactions inside the R&D black box,” Research Policy, Vol. 29, No. 9, December 2000.
Dixit, A. (1992). “Investment and Hysteresis,” Journal of Economic Perspectives, Vol. 6, No. 1, pp. 107-132
Flowers, Christopher R., Kenneth L. Melmon. (1997). “Clinical investigators as critical determinants in pharmaceutical innovation, Commentary, Nature Medicine, Vol. 3, No. 2, February 1997.
Gambardella, Alfonso. (1995). Science and Innovation: the US Pharmaceutical Industry in the 1980s, Cambridge: Cambridge University Press.
Gelijns, Annetine C., Nathan Rosenberg, Alan J. Moskowitz. (1998). “Capturing the
Unexpected Benefits of Medical Research,” The New England Journal of Medicine, Volume 339, No. 10, September, 1998, pp. 693-698.
Gelijns, Annetine, Nathan Rosenberg. (1994). “The Dynamics of Technological Change in Medicine,” Health Affairs, Summer 1994, pp. 28-56.
Giaccotto, Carmelo, Rexford E. Santerre, John A. Vernon. (2004). “Drug Prices and R&D Investment Behavior in the Pharmaceutical Industry,” forthcoming in the Journal of Law and Economics.
Grabowski, Henry G., John Vernon. (1980). “The Determinants of Research and
Development Expenditures in the Pharmaceutical Industry,” in Drugs and Health, R. B. Helms (editor), Washington: AEI Press, 1980.
Grabowski, Henry, G., John Vernon. (2000). “The Determinants of Pharmaceutical Research and Development Expenditures,” Journal of Evolutionary Economics, Vol 10, Issue 1/2, pp. 201-215.
Guellec, Dominique, Bruno van Pottelsberghe. (2003). “The Impact of Public R&D Expenditure on Business R&D,” Economics of Innovation and New Technology,
12(3), pp. 225-244.
Hall, Bronwyn H., Zvi Griliches, Jerry A. Hausman. (1986). “Patents and R&D: Is there a lag?” International Economic Review, Vol. 27, No. 2, June 1986, pp. 265-283.
Henderson, Rebecca, Iain M. Cockburn. (1996). “The Determinants of Research Productivity in Ethical Drug Discovery,” in Competitive Strategies in the Pharmaceutical Industry, Robert B. Helms (editor), Washington: The AEI Press, 1996, pp. 167-193.
Hubbard, G. (1998). “Capital Market Imperfections and Investment,” Journal of Economic Literature, Vol. 36, pp. 193-225.
Jaffe, Adam B. (1989). “The Real Effects of Academic Research,” American Economic Review, Volume 79, pp. 957-970.
Maxwell, Robert, A., Shohreh Eckhardt. (1990). Drug Discovery: A Case Book and Analysis, Clifton, NJ: Humana Press.
Narin, F., K. Hamilton, D. Olivastro. (1997). “The increasing linkage between US technology and public science, Research Policy, vol. 26, pp. 317-330.
NIH Office of Director. (1997). Executive Summary: Director’s Panel on Clinical Research Report, http://www.nih.gov/news/crp/97report/execsum.htm.
NIH Office of Science Policy. (2000). “NIH Contributions to Pharmaceutical Development: Case Study Analysis of the Top-Selling Drugs,” in Rx R&D Myths: The Case Against Drug Industry’s R&D “Scare Card,” Public Citizen, Congress Watch, July 2000.
OECD. (2002). Benchmarking Industry-Science Relationships, Organization for Economic Co-operation and Development.
Pharmaceutical Research and Manufacturers Association, “Annual Survey Report,” Washington D.C.: PhRMA, various years.
Pindyck, R.S. (1991). “Irreversibility, Uncertainty, and Investment,” Journal of economic Literature, Vol. 29, No. 3, pp. 1110-1148.
Reichert, Janice M., Christopher-Paul Milne. (2002). Public and Private Sector Contributions to the Discovery and Development of ‘Impact’ Drugs, Tufts Center for the Study of Drug Development White Paper, May 2002.
Scherer, Frederic, M. (1996). “Commentary on Part Three,” in Competitive Strategies in the Pharmaceutical Industry, Robert B. Helms (editor), Washington: The AEI Press, 1996, pp. 269-273.
Scherer, F. M. (2001). “The Link Between Gross Profitability and Pharmaceutical R&D Spending,” Health Affairs, Vol. 20, Issue 5, pp. 216-220.
Scolnick, Edward M. (1990). “Basic research and its impact on industrial R&D,” The IRI Medalist’s Address, Industrial Research Institute, May 1990.
The Pfizer Journal, “Clinical Trials: A cornerstone of biomedical research and innovation,” Impact Communications, Global Edition, Vol. 3, No. 1, 2002.
U.S. Congress, Office of Technology Assessment. (1993). Pharmaceutical R&D: Costs, Risks, and Rewards, OTA-H-522, (www.wws.princeton.edu/~ota/)
Vernon, John A. (2004). “Examining the link between price regulation and pharmaceutical R&D investment,” forthcoming in Health Economics, 2004.
Ward, Michael R., David Dranove. (1995). “The Vertical Chain of Research and Development in the Pharmaceutical Industry,” Economic Inquiry, Volume 33, January 1995, pp. 70-87.
Wiggins, Steven, N. (1983). “The Impact of Regulation on Pharmaceutical Research Expenditures: A Dynamic Approach,” Economic Inquiry, Volume 21, January 1983, pp. 115-128.
Wooldridge, Jeffrey, M. (1995). “Score Diagnostics for Linear Models Estimated by Two Stage Least Squares,” in Advances in Econometrics and Quantitative Economics, G. S. Maddala, Peter C. B. Phillips, T. N. Srinivasan (editors), Cambridge: Blackwell Publishers Inc., 1995, pp. 66-87.
Wooldridge, Jeffrey, M. (2002) Econometric Analysis of Cross Section and Panel Data, Cambridge: The MIT Press.
Figure 1: Public Biomedical Research by Type: Basic, Clinical, Other -500.00 1,000.00 1,500.00 2,000.00 2,500.00 3,000.00 3,500.00 4,000.00 4,500.00 5,000.00 1980 1981 1982 1983 1984 1985 1986 1987 1988 1989 1990 1991 1992 1993 1994 1995 1996 Years
NIH Investment (millions of real $
)
Basic Clinical Other
Figure 2: Anti-infective Therapeutic Class 0 100 200 300 400 500 600 700 800 900 1980 1981 1982 1983 1984 1985 1986 1987 1988 1989 1990 1991 1992 1993 1994 1995 1996 Year N IH ( M il. R
eal base yr=2000)
0 500 1000 1500 2000 2500 3000 3500
Industry (Mil. Real base yr=2000)
BasicANT ClinicalANT IndustryANT
Figure 3. Gastro-intestinal/Genito-urinary Therapeutic Class 0 50 100 150 200 250 300 350 400 450 1980 1981 1982 1983 1984 1985 1986 1987 1988 1989 1990 1991 1992 1993 1994 1995 1996 Year
NIH (Mil. Real base yr=2000)
0 100 200 300 400 500 600 700 800 900 1000
Industry (Mil. Real base yr=2000)
BasicGI/GU ClinicalGI/GU IndustryGI/GU
Figure 4. Endocrine/neoplasm(cancer) Therapeutic Class 0 200 400 600 800 1000 1200 1400 1980 1981 1982 1983 1984 1985 1986 1987 1988 1989 1990 1991 1992 1993 1994 1995 1996 Year N IH ( M il. R
eal base yr=2000)
0 500 1000 1500 2000 2500 3000 3500 4000 4500 5000
Industry (Mil. Real base yr=2000)
BasicEND ClinicalEND IndustryEND
TABLE I. Summary Statistics
Therapeutic Classes
Endocrine/ Central Nervous Cardiovascular Anti-infective Gastro-Intestinal/ Dermatologic Respiratory
Variable Neoplasm System Genito-urinary
Industry R&D (real mil. $)
Mean 2,645.36 2,290.40 2,692.80 2,918.47 729.75 837.79 268.97
Standard deviation 1,457.95 771.51 1,179.88 534.89 128.57 298.77 87.11
Avg. growth 1981-97 9.7% 6.4% 8.0% 4.6% 4.0% 7.1% 0.9%
Industry Sales (real mil. $)
Mean 20,891.1 18,268.0 14,594.5 19,555.0 11,578.9 6,408.2 2,726.9
Standard deviation 2,976.9 1,797.4 4,467.0 4,682.5 3,801.1 1,621.4 636.1
Avg. growth 1981-97 2.1% 1.4% 4.5% 4.4% 5.4% 4.0% 3.4%
NIH Public Basic (real mil. $)
Mean 1,393.99 818.52 593.71 644.62 355.97 23.62 154.65
Standard deviation 109.63 149.96 58.10 171.83 21.29 4.47 26.07
Avg. growth 1981-96 1.5% 3.5% 1.4% 4.9% -0.2% 1.6% 3.1%
NIH Public Clinical (real mil. $)
Mean 1,123.26 769.87 337.20 277.71 109.57 4.90 65.47
Standard deviation 199.47 358.15 65.34 186.55 20.92 3.13 13.52
Avg. growth 1981-96 2.0% 7.6% 3.1% 15.0% 1.4% 14.6% 3.1%
Hosp. Admission Rates (all ages)
Mean 102.14 122.43 199.20 54.04 122.35 7.54 54.64
Standard deviation 18.89 31.61 10.22 5.62 23.05 3.44 6.34
Avg. growth 1981-97 -3.2% -3.7% -0.4% 1.9% -3.4% -8.0% -1.2%
Mortality Rates (all ages)
Mean 19.29 2.25 33.00 3.68 3.68 0.09 3.68
Standard deviation 0.50 0.57 3.07 0.66 0.11 0.01 0.41
Avg. growth 1981-97 0.4% 5.1% -1.7% 2.7% -0.3% -1.8% 2.4%
FDA Reg. Delay (months)
Mean 31.41 36.90 38.27 24.11 25.91 22.49 51.13
Standard deviation 22.60 12.53 9.78 8.50 12.68 7.57 23.78
32
TABLE II
Estimates of the Elasticity of Publicly Funded Research on Pharmaceutical Investment
(1) - OLS (2) - OLS (3) - OLS Dependent Variable: ∆ ln Research(t) ∆ ln Research(t) ∆ ln Research(t)
∆ ln Sales(t-1) 0.198 (0.158) 0.059 (0.030)** 0.073 (0.030)***
PubBasic Poly term 1 0.341 (0.134)*** 0.343 (0.115)*** 0.347 (0.112)***
PubBasic Poly term 2 -0.320 (0.081)*** -0.276 (0.073)*** -0.271 (0.075)***
PubBasic Poly term 3 0.045 (0.011)*** 0.039 (0.010)*** 0.038 (0.010)***
PubClinic Poly term 1 0.109 (0.049)** 0.077 (0.047)* 0.093 (0.046)**
PubClinic Poly term 2 -0.042 (0.029) -0.031 (0.026) -0.036 (0.026) PubClinic Poly term 3 0.005 (0.004) 0.003 (0.003) 0.003 (0.003)
∆ ln FDA Delay(t-1) 0.018 (0.017) 0.008 (0.017)
∆ ln Hosp Admis. (age<35) -0.254 (0.193) -0.280 (0.179)
∆ ln Hosp Admis. (age 35-44) -0.032 (0.149) -0.071 (0.141)
∆ ln Hosp Admis. (age 45-54) 0.081 (0.129) 0.138 (0.125)
∆ ln Hosp Admis. (age 55-64) 0.558 (0.176)*** 0.586 (0.173)*** 0.571 (0.153)*** ∆ ln Hosp Admis. (age>64) -0.589 (0.207)*** -0.319 (0.186)* -0.410 (0.182)** ∆ ln Mortality (age<35) 0.132 (0.102) 0.124 (0.103) ∆ ln Mortality (age 35-44) -0.212 (0.114)* -0.220 (0.111)** -0.216 (0.080)*** ∆ ln Mortality (age 45-54) -0.061 (0.148) -0.032 (0.132) ∆ ln Mortality (age 55-64) 0.632 (0.296)** 0.669 (0.283)** 0.692 (0.237)*** ∆ ln Mortality (age>64) -0.107 (0.299) -0.285 (0.276) Time Trend 0.063 (0.021)*** 0.060 (0.019)***
Yearly Time dummies Yes. None Sig. No No
R-squared .4066 .3134 .2619
Adjusted R-squared .1664 .1898 .1860
Number of Observations 119 119 119
Durbin-Waston Statistic DW = 1.96 DW = 1.87 DW = 1.94 Pooled OLS Regressions, Years 1981-1997, Seven Therapeutic Classes
Standard Errors are in Parentheses. All tests are two-sided. *** indicates significance at a 1% level
** indicates significance at a 5% level
33