Three-Phase Induction Generator Feeding a
Single-Phase Electrical Distribution System
- Time Domain Mathematical Model
R.G. de Mendonça, MSc.
L. Martins Neto, Dr.
J.R. Camacho, PhD.
CEFET- GO – Jataí Decentralized Unity Universidade Federal de Uberlândia
Electrotechnical Coordination School of Electrical Engineering
Jataí – GO – Brazil – 76300 – 000 Electrical Machines Lab.
P.O. Box: 593 - Campus Santa Mônica Uberlândia – MG – Brazil – 38400-902 e.mail: [email protected]
ABSTRACT
This paper presents a time domain mathematical model of a three phase induction generator feeding a single-phase electrical distribution system. The objective in this work is to analyze the three-phase induction generator when working in the conditions above described. From such model it is possible to make a more precise analysis, since some problems should be easily observed using the time domain technique, such as unbalancing of magnetomotive forces (mmf) at the machine inner magnetic circuit. This is impossible to be visualized when using frequency domain modeling. A 2 HP three-phase induction generator model is used on digital simulation. Through the results it is easy to show that the proposed model is very efficient.
Keywords: induction generator, single-phase, distribution system
1 INTRODUCTION
Countries with a large territorial extension, where electrical energy consumers are characterized by:
- small monthly kWh expenditure;
- small number of consumers per km of distribution
network;
- small maximum simultaneous demands;
- and also a small amount of financial resources to be spent
in rural electrification programs.
Having the Brazilian scenery as our example, the electrical energy authorities turned to single-phase (one wire with earth return) as a less expensive option to electrical distribution systems in rural areas. In the production side, due to a constant pressure of the technology to become more efficient and to increase the maximum demand, the rural consumer becomes locked to the limitations of the single-phase system
However, in some regions where small hydroelectric potentials are available, there's a possibility to generate energy with the use of three-phase induction machines, with squirrel cage rotor connected to a single-phase distribution system in order to supply typical rural three-phase loads.
Some studies have already been done about the three-phase induction generator connected to a single-phase energy system. These studies were of great importance but developed through
frequency domain mathematical models[1]. The use of frequency domain techniques doesn't allow the analysis for the behavior of the three-phase induction generator concerning the electromagnetic unbalances inside the machine. So, aware of this matter this paper presents a time domain mathematical model [2][3][4], who allows such studies to be made. These studies show the electromagnetic behavior in the three-phase induction generator inner electromagnetic circuit.
2 INDUCTION GENERATOR
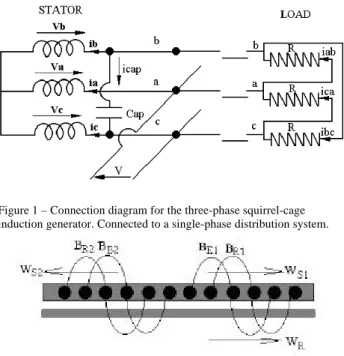
The proposed three-phase induction generator is connected to a single phase electrical distribution system. It is an ordinary induction machine with a squirrel cage rotor and stator phases
displaced spatially by 120o and same number turns/phase. An
adequate capacitance Cap is coupled between phases B and C,
as in Figure 1. The objective is to obtain a reliable operating point for this unbalanced configuration, where the generator is delivering nominal power under nominal voltage. As described in reference [1], a balanced situation between generator phases can be obtained, and this balance is of fundamental importance concerning the connection of a three-phase induction generator in parallel with a single-phase voltage source. Through the frequency domain mathematical modeling proposed in [1], it is clear the good behavior for the proposed generator, in terms of "rms" values, where the voltage unbalance is not so accentuated. However, an interesting point not brought in picture in [1] is the behavior of electromagnetic torque inside the generator, for small voltage unbalancing the internal electromagnetic torque shows a swinging behavior. Those swings are related to the current unbalance in the generator phases as part of a unbalanced three-phase system. As a consequence this generator has different magnetomotive forces (mmf) in each phase. This unbalancing allows the decomposition of the mmf distribution in such a way to obtain static and rotary magnetic field distribution, where the latter are of positive and negative sequence. The positive sequence
magnetic field, BR1, under the three-phase symmetrical
induction machine working principles, create indirectly a
rotating magnetic field, BS1, of same sequence, in the machine's
rotor. The same happens to the negative sequence magnetic
field, BR2, creating another BS2. The above is illustrated in
Figure 2, and can be seen clearly that:
- The magnetic fields (BS1, BR1) and (BS2, BR2) show a
constant angular displacement between them, therefore the resulting aligning electromagnetic torque is constant;
- The angular position between magnetic fields (BS1, BR1)
and (BS2, BR2) changes periodically, therefore the
electromagnetic torque is an oscillating value.
Figure 1 – Connection diagram for the three-phase squirrel-cage induction generator. Connected to a single-phase distribution system.
Figure 2 – Demonstration of the internal rotating magnetic fields inside a three-phase induction generator connected to a single-phase system.
Frequency domain mathematical models doesn't allow instantaneous analysis, therefore an induction generator time domain mathematical model was built in order to do this research.
3 MATHEMATICAL MODEL
Figure 1 shows the connection diagram for the three-phase induction generator connected to a single-phase distribution system.
From Figure 1 we have:
(
)
1 . b c Cap d V V i dt Cap − = (1)(
a b)
ci
i
i
=
−
+
(2) c aV
V
V
=
−
(3) ab b aV
R
i
V
−
=
.
(4) bc c bV
R
i
V
−
=
.
(5) ca a cV
R
i
V
−
=
.
(6)The induction generator voltage and current relationship is presented by the generic equation:
. i i i i d v r i dt λ = + (7) where:
vi , ii , ri , λi – are respectively voltage, current, resistance and
coupled magnetic flux for one of the generator’s phase called. i index – represents one of the generator’s phase (stator abc –
rotor ABC).
The magnetic flux coupling are given by the following general equation:
(
)
∑
≠+
+
=
j i i ij ii i iL
L
.
i
L
.
i
λ
(8) where:Li + Lii – generator’s phase i self inductance,
Lij – generator’s mutual inductance between phases i and j,
ii , ij – instantaneous currents of phases i and j , respectively.
For the three-phase generator pictured in Figure 1, self and mutual inductances are given by [L] matrix as follows:
[ ]
=
33 25 15 33 24 14 33 23 13 25 24 23 22 12 15 14 13 12 110
0
0
0
0
0
.
A
A
A
A
A
A
A
A
A
A
A
A
A
A
A
A
A
A
A
k
L
(9)
The [L] matrix terms are given by:
11 112.
13 33A
=
L
−
L
+
L
12 12 23 13 33A
=
L
−
L
−
L
+
L
13 14 34A
=
L
−
L
14 15 35A
=
L
−
L
15 16 36A
=
L
−
L
22 222.
23 33A
=
L
−
L
+
L
23 24 34A
=
L
−
L
24 25 35A
=
L
−
L
25 26 36A
=
L
−
L
33 44A
=
L
the Lij values are given below.
11 22 33 L
L
=
L
=
L
=
K
442
1 cos
3
LL
= −
π
+
K
12 13 232
cos
3
L
=
L
=
L
=
π
( )
14 25 36cos .
L
=
L
=
L
=
θ
15 26 342
cos
3
L
=
L
=
L
=
θ
+
π
16 24 352
cos
3
L
=
L
=
L
=
θ
−
π
K
L– is the machine magnetic cisrcuit constant.
Introducing the three-phase induction generator mechanical equations, they are given by:
(
)
1
.
R b mdW
T
T
dt
=
J
−
(10) R Rd
W
dt
θ
=
(11)
.
2
Rd
p
W
dt
θ
=
(12)[ ]
[ ]
. . . 4 T m p L T I I θ ∂ = ∂ (13) where:WR – rotor angular mechanical speed;
θ - rotor electrical angular displacement;
p – pole number;
Tm – generator electromagnetic torque;
Tb - turbine torque.
From the union of electrical (1) to (9) and mechanical (10) to (13) equations, can be obtained an equation system which represents the three-phase induction generator connected to a single-phase distribution system. The resulting matrix equation system is shown below:
[ ] [ ] [ ] [ ] [ ] [ ]
' 1 ' ' . ' ' . ' d I d L L V R I dt dt − = − + where:[I’] - represents the current matrix (stator, rotor and load); [L’] - represents the inductance matrix (stator, rotor and load); [V’] - represents the voltage matrix (stator, rotor and load); [R’] – represents the resistance matrix (stator, rotor and load).
Table 1. Three-phase induction machine equivalent circuit parameters. Stator Resistance 3,80±0,03Ω
Rotor Resistance (referred to the
stator) 3,01±0,03Ω Locked Rotor Reactance ( referred to
the stator) 3,10±0,03Ω
Phase Magnetization Reactance 75,15±0,7Ω
4 DIGITAL SIMULATION
Once having all the induction generator equations, digital simulations have been done in order to confirm the electromagnetic torque oscillations. Therefore, the benchmark was the three-phase induction motor used in [1], a three-phase induction machine with similar characteristics was taken, a 2 HP, 4 poles, 380/220 Volts, squirrel cage rotor, with equivalent circuit parameters given by Table 1.
The following simulations are obtained with respectively
capacitors of 50 µF, 70 µF, 90 µF and 110 µF in order to have
an idea of its effect on the electromagnetic torque behavior inside the generator.
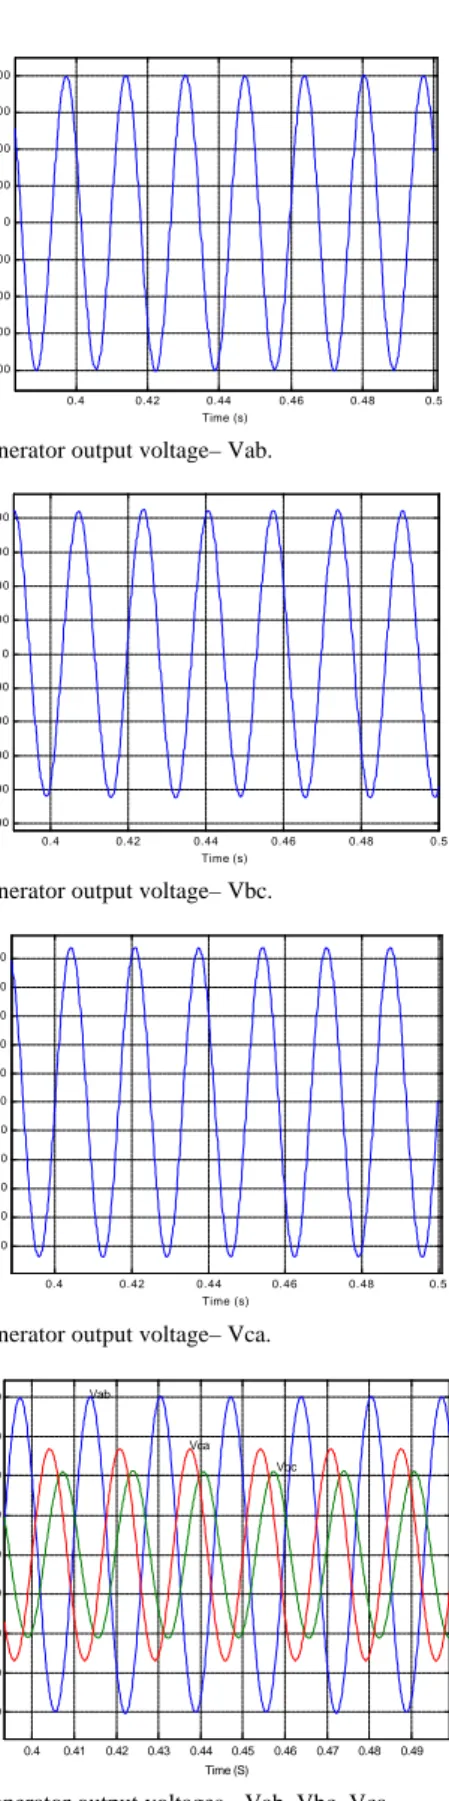
4.1 Using a 50µF capacitor. 0.4 0.42 0.44 0.46 0.48 0.5 -800 -600 -400 -200 0 200 400 600 800 Time (s) V o lta g e V a b
Figure3 – Generator output voltage– Vab.
0.4 0.42 0.44 0.46 0.48 0.5 -500 -400 -300 -200 -100 0 100 200 300 400 Time (s) V o lt a g e V b c
Figure4 – Generator output voltage– Vbc.
0.4 0.42 0.44 0.46 0.48 0.5 -500 -400 -300 -200 -100 0 100 200 300 400 500 Time (s) V o lt a g e V c a
Figure5 – Generator output voltage– Vca.
0.4 0.41 0.42 0.43 0.44 0.45 0.46 0.47 0.48 0.49 -800 -600 -400 -200 0 200 400 600 800 Time (S) V o lta g e ( V ) Vab Vca Vbc
0.4 0.41 0.42 0.43 0.44 0.45 0.46 0.47 0.48 0.49 -25 -20 -15 -10 -5 0 5 Time (s) T or q ue ( N .m )
Figure 7 – Eletromagnetic Torque.
4.2 Using a 70µF capacitor. 0.4 0.42 0.44 0.46 0.48 -800 -600 -400 -200 0 200 400 600 800 Time (s) V o lt a g e V a b ( V )
Figure8 – Generator output voltage – Vab.
0.4 0.42 0.44 0.46 0.48 0.5 -500 -400 -300 -200 -100 0 100 200 300 400 500 Time (s) V o lt a g e V b c ( V )
Figure 9 – Generator output voltage – Vbc.
0.4 0.42 0.44 0.46 0.48 0.5 -500 -400 -300 -200 -100 0 100 200 300 400 500 Time (s) V o lt a g e V c a ( V )
Figure 10 – Generator output voltage - Vca
0.4 0.42 0.44 0.46 0.48 0.5 -800 -600 -400 -200 0 200 400 600 800 Time (s) V o lt a g e ( V ) V a b Vca Vbc
Figure 11 –Generator output voltages - Vab, Vbc, Vca.
0.4 0.42 0.44 0.46 0.48 0.5 -25 -20 -15 -10 -5 0 5 1 0 Time (s) T o rq u e ( N .m )
Figure 12 – Electromagnetic torque.
4.3 Using a 90µF capacitor. 0.4 0.41 0.42 0.43 0.44 0.45 0.46 0.47 0.48 0.49 -800 -600 -400 -200 0 200 400 600 800 Time (s) V o lt a g e V a b ( V )
Figure 13 – Generator output voltage – Vab
0 . 4 0 . 4 1 0 . 4 2 0 . 4 3 0 . 4 4 0 . 4 5 0 . 4 6 0 . 4 7 0 . 4 8 0 . 4 9 - 5 0 0 - 4 0 0 - 3 0 0 - 2 0 0 - 1 0 0 0 1 0 0 2 0 0 3 0 0 4 0 0 5 0 0 Time (s) V o lt a g e V b c ( V )
0.4 0.42 0.44 0.46 0.48 0.5 - 5 0 0 - 4 0 0 - 3 0 0 - 2 0 0 - 1 0 0 0 1 0 0 2 0 0 3 0 0 4 0 0 5 0 0 Time (s) V o lt a g e V c a ( V )
Figure 15 – Generator output voltage – Vac.
0 . 4 0 . 4 1 0 . 4 2 0 . 4 3 0 . 4 4 0 . 4 5 0 . 4 6 0 . 4 7 0 . 4 8 0 . 4 9 - 8 0 0 - 6 0 0 - 4 0 0 - 2 0 0 0 2 0 0 4 0 0 6 0 0 8 0 0 T i m e ( s ) V o lt a g e (V ) V a b V c a V b c
Figure 16 – Generator output voltages - Vab, Vbc, Vca.
0.4 0.42 0.44 0.46 0.48 0.5 -30 -25 -20 -15 -10 -5 0 5 10 15 Time (s) T o rq u e ( N .m )
Figure 17 – Electromagnetic torque.
From figures 3 to 17 can be seen that available voltages at the generator’s terminals are unbalanced and this unbalance is damped or highlighted as capacitors of different values are connected to the system. The electromagnetic torque curves show clearly that the unbalance from the voltages promote electromagnetic torque oscillations inside the generator.
Through figures 7, 12, and 17 can be clearly observed the presence of such oscillating electromagnetic torque, where the oscillations are always around the turbine nominal torque (7.5 N.m).
5 CONCLUSIONS
From the figures previously presented can be clearly observed the existence of heavy electromagnetic torque oscillations inside the generator; oscillations mainly due to the internal electromagnetic unbalance in the machine. This unbalance can be very damaging, in the mechanical point of view, to the generator performance, since they are the cause of highly oscillating rotational speed.
With the use of frequency domain modeling it is not possible to see clearly these effects. Therefore, it is evident that the mathematical model presented here, for a three-phase induction generator connected to a single-phase system, give us conditions and resources for the instantaneous analysis for the electromagnetic unbalance present inside the generator. In another words it is possible to make the analysis of generated voltage at the machine’s terminals. This model still give us conditions to evaluate a more adequate capacitor for the generator operating under such restrictions. So the mathematical model become a valuable tool for the design of such capacitor.
6 REFERENCES
[1] T.F. CHAN, Performance Analysis of a Three-Phase Induction Generator Connected to a Single-phase Power System, IEEE – Transactions on Energy Conversion, September 1998, Vol 13 No. 3, pp 205-213.
[2] R.G. MENDONÇA, & L. MARTINS NETO, Comparative Performance Analysis: Symmetrical Three-Phase Induction Motor Against Asymmetrical ThreePhase Induction Motor -Oscillating Torque, Proceedings of XII Brazilian Automatic Control Conference – XII CBA, Vol.I, pp.243-247-September 14-18,1988 - Uberlândia, MG, Brazil (In Portuguese).
[3] L. MARTINS NETO, L.; R.G. MENDONÇA, J.R. CAMACHO, AND C.H. SALERNO, The Asymmetrical Three-Phase Induction Motor Fed by Single Three-Phase Source: Comparative Performance Analysis, IEEEIEMDC -International Electrical Machines and Drives Conference, Milwaukee, Wisconsin, May 1997.]
[4] L. MARTINS NETO, J.R. CAMACHO, C.H. SALERNO,. & B.P. ALVARENGA, Analysis of Three-Phase Induction Machine Inclunding Time and Space Harmonic Effects: The A,B,C Reference Frame, PES-IEEE Transactions on Energy Conversion, Volume 14, Nr.1, March 1999. Article no.: PE-154-EC-0-10-1997.