MERRA Analytic Services: Meeting the Big Data challenges of climate
science through cloud-enabled Climate Analytics-as-a-Service
John L. Schnase
a,⇑, Daniel Q. Duffy
b, Glenn S. Tamkin
a, Denis Nadeau
a, John H. Thompson
b,
Cristina M. Grieg
c, Mark A. McInerney
a, William P. Webster
aa
Office of Computational and Information Sciences and Technology, NASA Goddard Space Flight Center, Greenbelt, MD 20771, United States b
NASA Center for Climate Simulation, NASA Goddard Space Flight Center, Greenbelt, MD 20771, United States cDepartment of Computational Data Sciences, George Mason University, Fairfax, VA 22030, United States
a r t i c l e i n f o
Article history: Available online xxxx Keywords: MapReduce Hadoop Data analytics Data services Cloud Computing Generativity iRODS MERRA ESGF BAERa b s t r a c t
Climate science is a Big Data domain that is experiencing unprecedented growth. In our efforts to address the Big Data challenges of climate science, we are moving toward a notion of Climate Analytics-as-a-Ser-vice (CAaaS). We focus on analytics, because it is the knowledge gained from our interactions with Big Data that ultimately produce societal benefits. We focus on CAaaS because we believe it provides a useful way of thinking about the problem: a specialization of the concept of business process-as-a-service, which is an evolving extension of IaaS, PaaS, and SaaS enabled by Cloud Computing. Within this framework, Cloud Computing plays an important role; however, we see it as only one element in a constellation of capabil-ities that are essential to delivering climate analytics as a service. These elements are essential because in the aggregate they lead to generativity, a capacity for self-assembly that we feel is the key to solving many of the Big Data challenges in this domain. MERRA Analytic Services (MERRA/AS) is an example of cloud-enabled CAaaS built on this principle. MERRA/AS enables MapReduce analytics over NASA’s Modern-Era Retrospective Analysis for Research and Applications (MERRA) data collection. The MERRA reanalysis inte-grates observational data with numerical models to produce a global temporally and spatially consistent synthesis of 26 key climate variables. It represents a type of data product that is of growing importance to scientists doing climate change research and a wide range of decision support applications. MERRA/AS brings together the following generative elements in a full, end-to-end demonstration of CAaaS capabili-ties: (1) high-performance, data proximal analytics, (2) scalable data management, (3) software appliance virtualization, (4) adaptive analytics, and (5) a domain-harmonized API. The effectiveness of MERRA/AS has been demonstrated in several applications. In our experience, Cloud Computing lowers the barriers and risk to organizational change, fosters innovation and experimentation, facilitates technology transfer, and provides the agility required to meet our customers’ increasing and changing needs. Cloud Computing is providing a new tier in the data services stack that helps connect earthbound, enterprise-level data and computational resources to new customers and new mobility-driven applications and modes of work. For climate science, Cloud Computing’s capacity to engage communities in the construction of new capabili-ties is perhaps the most important link between Cloud Computing and Big Data.
Published by Elsevier Ltd.
1. Introduction
The term ‘‘Big Data’’ is used to describe data sets that are too large and complex to be worked with using commonly-available tools (Snijders, Matzat, & Reips, 2012). Climate science represents a Big Data domain that is experiencing unprecedented growth (Edwards, 2010). NASA’s climate change repositories alone are pro-jected to grow to 350 petabytes by 2013 (Skytland, 2012). Some of the major Big Data challenges facing climate science are easy to understand: large repositories mean that the data sets themselves
cannot be moved: instead, analytical operations need to migrate to where the data reside; complex analyses over large repositories re-quires high-performance computing; large amounts of information increases the importance of metadata, provenance management, and discovery; migrating codes and analytic products within a growing network of storage and computational resources creates a need for fast networks, intermediation, and resource balancing; and, importantly, the ability to respond quickly to customer demands for new and often unanticipated uses for climate data re-quires greater agility in building and deploying applications. It is useful to situate the Big Data challenges of the climate domain in this larger context, because doing so helps us understand where innovation can yield improvements.
0198-9715/$ - see front matter Published by Elsevier Ltd.
http://dx.doi.org/10.1016/j.compenvurbsys.2013.12.003
⇑Corresponding author. Tel.: +1 301 286 4351. E-mail address:[email protected](J.L. Schnase).
Computers, Environment and Urban Systems xxx (2014) xxx–xxx
Contents lists available atScienceDirect
Computers, Environment and Urban Systems
j o u r n a l h o m e p a g e : w w w . e l s e v i e r . c o m / l o c a t e / c o m p e n v u r b s y sPlease cite this article in press as: Schnase, J. L., et al. MERRA Analytic Services: Meeting the Big Data challenges of climate science through cloud-enabled https://ntrs.nasa.gov/search.jsp?R=20140013036 2019-08-31T16:58:04+00:00Z
Cloud Computing is one of several technologies often invoked as a solution to Big Data challenges. However, the technical definition of ‘‘Cloud Computing’’ is so variously interpreted that the term has become jargonized (Mell & Grace, 2011). That Cloud Computing is both ubiquitous and ambiguous points to the need to examine carefully how Cloud Computing enables.
1.1. Climate Analytics-as-a-Service (CAaaS)
In our efforts to address the Big Data challenges of climate sci-ence, we are moving toward a notion of Climate Analytics-as-a-Service (CAaaS). We focus on analytics, because it is the knowledge gained from our interactions with Big Data that ultimately produce societal benefits. We focus on CAaaS because we believe it provides a useful way of thinking about the problem: a specialization of the concept of business process-as-a-service, which is an evolving extension of IaaS, PaaS, and SaaS enabled by Cloud Computing. Within this framework, Cloud Computing plays an important role; however, we see it as only one element in a constellation of capa-bilities that are essential to delivering climate analytics as a ser-vice. These elements are essential because in the aggregate they lead togenerativity– a capacity for self-assembly that we feel is the key to solving many of the Big Data challenges in this domain. 1.2. Generative technologies
Generativity refers to a system’s capacity to produce unantici-pated change through unfiltered contributions from broad and var-ied audiences (Zittrain, 2008). The concept highlights aspects of an innovation or process that enable an autocatalytic feeding-forward that can help make growth, further innovation, and success possi-ble. Generativity connects inputs from diverse people and groups, who may or may not be working in concert, with emergent and unanticipated outputs. How much the system facilitates partici-pant contribution is a function of bothtechnological designand so-cial behavior (Baker & Bowker, 2007). A system’s generativity describes not only its objective characteristics, but also the ways the system relates to its users and the ways users relate to one an-other. In turn, these relationships reflect how much the users iden-tify as contributors or participants, rather than as mere consumers. The Internet itself, modern operating systems, Apple’s iTunes, Twitter, Facebook, and the emerging infrastructure for mobile application development are examples of generative systems. In both cases, the design elements contributing to their generative potential are easy to see. The Internet’s framers madesimplicitya core value, defining in the process the classic end-to-end argument that most features in a network should be implemented at its com-puter endpoints rather than by the network itself, which appropri-ately implements only those functions that are universally useful (Saltzer, Reed, & Clark, 1984). To do otherwise might have tilted the generic network toward specific uses and limited its potential for growth. (Consider, for example, the proprietary, non-genera-tive, and now defunct CompuServe network.).
Zittrain (2008)identifies five properties of generative systems: (1)How extensively a system or technology leverages a set of pos-sible tasks:Leverage makes a difficult job easier, and, in gen-eral, the more a system can do, the more capable it is of producing change.
(2)How well it can be adapted to a range of tasks:Adaptability enables new, unintended, and innovative uses of a technol-ogy. It broadens the technology’s use.
(3)How easily new contributors can master it: Ease of Mastery reflects how easy it is for broad audiences to understand how to adopt and adapt it. The more useful a technology is both to the neophyte and the expert, the more generative it is.
(4) How accessible it is to those ready and able to build on it: Accessibility makes it easier to obtain the technology and the information necessary to achieve mastery. The more accessible, the more generative.
(5) How transferable any changes are to others, including non-experts: Transferability reflects how easily changes in the technology can be conveyed to others.
A major deficiency in any one factor greatly reduces overall gen-erativity. Conversely, the more these five qualities are maximized, the easier it is for a system to welcome contributions from outsid-ers as well as insidoutsid-ers. In general, generative tools are more basic and less specialized for accomplishing a particular purpose.
In the remainder of this paper, we illustrate how we are trans-lating these concepts into reality: we describe the context in which we are working; the technology foundations important to us, including our definition and rationale for the generative elements we feel are crucial; a specific project, MERRA Analytic Services, and applications that demonstrate these capabilities in action; ways that Cloud Computing are contributing to the effort; and, fi-nally, our plans for the future.
2. Background – The NASA Center for Climate Simulation and climate science as a Big Data domain
Our understanding of the Earth’s processes is based on a combi-nation of observational data records and mathematical models. The size of NASA’s space-based observational data sets is growing dra-matically as new missions come online. However, a potentially big-ger data challenge is posed by the work of climate scientists, whose models are regularly producing data sets of hundreds of terabytes or more (Edwards, 2010; Webster, 2013).
The NASA Center for Climate Simulation (NCCS) provides state-of-the-art supercomputing and data services specifically designed for weather and climate research (NCCS, 2013). The NCCS main-tains advanced data capabilities and facilities that allow research-ers within and beyond NASA to create and access the enormous volume of data generated by weather and climate models. Tackling the problems of data intensive science is an inherent part of the NCCS mission.
There are two major challenges posed by the data intensive nat-ure of climate science. There is the need to provide complete life-cycle management of large-scale scientific repositories. This capability is the foundation upon which a variety of data services can be provided, from supporting active research to large-scale data federation, data publication and distribution, and archival storage (Berman, 2008). We think of this aspect of our mission as climate data services.
The other data intensive challenge has to do with how these large datasets are used: data analytics – the capacity to perform useful scientific analyses over enormous quantities of data in rea-sonable amounts of time. In many respects this is the biggest chal-lenge; without effective means for transforming large scientific data collections into meaningful scientific knowledge, our mission fails. It is against this backdrop that the NCCS began looking at CAaaS as a potential element in our technological and organiza-tional response to changing demands.
3. Technology foundations – Toward a generative ecology for Climate Analytics-as-a-Service
We believe there are five essential technology elements that contribute to building a generative context for Climate Analytics-as-a-Service: high-performance, data-proximal analytics; integra-tive data management; software appliance virtualization; adapintegra-tive Please cite this article in press as: Schnase, J. L., et al. MERRA Analytic Services: Meeting the Big Data challenges of climate science through cloud-enabled
analytics; and domain-harmonized APIs. In this section, we de-scribe what we mean by these terms and demonstrate how we are implementing the concept.
3.1. High-performance, data-proximal analytics (MapReduce) Clearly, at its core, CAaaS must bring together data storage and high-performance computing in order to perform analyses over data where the data reside. MapReduce is of particular interest to us, because it provides an approach to high-performance analyt-ics that is proving to be useful to many data intensive problems in climate research (Dean & Ghemawat, 2008; Duffy et al., 2011, 2012; Tamkin, 2013). As typically implemented, MapReduce en-ables distributed computing on large data sets using high-end computers. It is an analysis paradigm that combines distributed storage and retrieval with distributed, parallel computation, allo-cating to the data repository analytical operations that yield re-duced outputs to applications and interfaces that may reside elsewhere. Since MapReduce implements repositories as storage clusters, data set size and system scalability are limited only by the number of nodes in the clusters. While MapReduce has proven effective for large repositories of textual data, its use in data inten-sive science applications has been limited (Buck et al., 2011), be-cause many scientific data sets are inherently complex, have high dimensionality, and use binary formats.
MapReduce distributes computations across large data sets using a large number of computers (nodes). In a ‘‘map’’ operation a head node takes the input, partitions it into smaller sub-prob-lems, and distributes them to data nodes. A data node may do this again in turn, leading to a multi-level tree structure. The data node processes the smaller problem, and passes the answer back to a re-ducer node to perform the reduction operation. In a ‘‘reduce’’ step, the reducer node then collects the answers to all the sub-problems and combines them in some way to form the output – the answer to the problem it was originally trying to solve. Borrowing from the LISP family of functional programming languages, the map and re-duce functions of MapRere-duce are both defined as data structured in <key, value> pairs (HDFS, 2013).
3.2. Scalable data management (iRODS)
The core data management infrastructure for CAaaS must en-able collections scalability, rich metadata management, and feder-ated discovery and access (Agrawal, Das, & Abbadi, 2011). For us, iRODS plays a central role. The Integrated Rule-Oriented Data Sys-tems, or iRODS, is an open source data grid software system being developed by the Data Intensive Cyber Environments (DICE) group and the Renaissance Computing Institute (RENCI) at the University of North Carolina at Chapel Hill (iRODS, 2013). It is described by its creators as peer-to-peer data grid middleware that provides a facil-ity for collection-building, managing, querying, accessing, and pre-serving data in a distributed data grid framework. A key feature of iRODS is its capacity to apply policy-based control when perform-ing these functions.
iRODS appeals to us for several reasons. It targets large reposi-tories, large data objects, digital preservation, and integrated com-plex processing, making it one of the more promising technologies for grid-centric data services for scientific applications. We also like the fact that its development culture has historic roots in dig-ital libraries, persistent archives, and real-time data systems re-search, having received support from the National Science Foundation (NSF) and National Archives and Records Administra-tion (NARA).
The iRODS data grid system consists of several components. It has a metadata catalog server, called the iCAT, which provides metadata and abstraction services. There can be multiple resource
servers that provide access to storage resources. A resource server (iRES) can provide access to more than one storage resource, and the system can support any number of clients at a time. A client can connect to any server on the grid and request access to digital objects from the system. The request is parsed using the contextual and system information stored in the iCAT catalog, and a physical object is identified and transferred to the client. The request can be in terms of logical object names, or a conditional query based on descriptive and system metadata attributes. iRODS is a peer-to-peer server system; hence, requests can be made to any server, which in turn acts on behalf of the client for transferring the file. The final file transfer takes the shortest network path in terms of number of hops.
An important aspect of iRODS is its built-in rule framework. As part of each resource server, a distributed rule engine is imple-mented that provides extensibility and customizability by encod-ing server-side operations (includencod-ing the main access APIs) into sequences of microservices. The sequence of microservices is con-trolled by user- or administrator-definedEvent:Condition: Action-set:Recovery-set rules similar to those found in active databases. The rules can be viewed as defining pipelines or workflows. An ingestion or access process can be encoded as a rule to provide cus-tomized functionality. Rules also can be defined by users and exe-cuted interactively. Hence, changes to a particular process or policy can easily be constructed by the user, then tested and deployed without the aid of system administrators or application develop-ers. The user also can define conditions when a rule gets triggered thus controlling the application of different rules (or processing pipelines) based on current events and operating conditions.
The building blocks for the iRODS rules are microservices – small, well-defined procedures or functions that perform a certain task. For example, one can use a rule that stipulates that when accessing a data object from a particular collection, additional authorization checks need to be made. These authorization checks can be encoded as a set of microservices with different triggers that can fire based on current operating conditions. In this way, one can control access to sensitive data based on rules and can escalate or reduce authorization levels dynamically as the situation warrants. Apart from iRES servers and an iCAT server, iRODS also has two other servers: iSEC for scheduling and executing queued rules, and iXMS for providing a message-passing framework between microservices.
3.3. Software appliance virtualization (vCDS)
Virtualization is central to Cloud Computing and important to us in the way it enables agile development and deployment. We have attempted to make virtualization even more convenient by taking a software appliance approach to building a core element of our technology cluster, the Virtual Climate Data Server (vCDS). A vCDS is an iRODS-based data server specialized to the needs of a particular climate data-centric application.
The basic configuration of an iRODS data server consists of a specific version of iRODS installed on a particular operating system running on particular hardware. Moving toward the vCDS virtual appliance model has been a two-step process in which we (1) encapsulate the operating system and iRODS as a virtual machine image, then (2) specialize that image with functionality required for managing climate data. Our approach to specialization has been to build general-purpose scientific ‘‘kits,’’ such as those that can externalize into the vCDS iCAT the internal metadata stored in Net-CDF, HDF, and GeoTIF files. These kits sit in the vertical stack above iRODS and below application-specific kits, such as those that might be needed to handle the special data management requirements of a particular collection (Fig. 1).
Our initial focus has been building a vCDS to manage NetCDF data. Additional details about these components are provided be-low and inSchnase, Webster, Parnell, and Duffy (2011), Schnase, Tamkin, et al. (2011), Schnase, Duffy, et al. (2011), Schnase et al. (2012), but in summary, the core elements include the following:
Application-specific microservices– Basic archive operations, par-ticularly the mechanisms required to ingest Open Archive Infor-mation System (OAIS)-compliant Submission InforInfor-mation Package (SIP) metadata for IPCC NetCDF objects (more about IPCC and OAIS below).
Application-specific metadata – OAIS-compliant constitutive (application-independent) Representation Information (RI) and Preservation Description Information (PDI) metadata for NetCDF objects.
Application-specific rules– NetCDF triggers and workflows. A specific release of iRODS– In the current version we are using iRODS 2.5 that has been augmented with what we refer to as Administrative Extensions (AE) that log object-level actions within the server.
A specific operating system– In our case, SuSE Linux Enterprise Server (SLES) 11 SP1.
Collectively, we refer to the functionality associated with vCDS as a the vCDS V1.0 ‘‘product suite.’’ Taken together, these elements enable an approach to scientific collections management in which virtualization is a driving concept. It supports access to a tiered
array of cloud services that are flexible, adaptable, scalable, and stageable to ‘‘bricks and mortar’’ facilities as needed. We can provi-sion capabilities into any resource class, migrate images from one resource class to another, and use the iRODS federation mechanism to assemble virtual collections that cross resource classes. This ap-proach provides an agile entry point for new customers with data-centric requirements and enables virtualization-as-a-service (VaaS), software-as-a-service (SaaS), and platform-as-a-service (PaaS), and, as shown below, lays the foundation for higher-order offerings, such as CAaaS (Fig 2).
3.4. Adaptive analytics (Canonical Ops)
Data intensive analysis workflows bridge between a largely unstructured mass of archived scientific data and the highly struc-tured, tailored, reduced, and refined analytic products that are used by individual scientists and form the basis of intellectual work in the domain. In general, the initial steps of an analysis, those oper-ations that first interact with a data repository, tend to be the most general, while data manipulations closer to the client tend to be the most specialized to the individual, to the domain, or to the sci-ence question under study. The amount of data being operated on also tends to be larger on the repository-side of the workflow, smaller toward the client-side end products.
This stratification can be exploited in order to optimize efficien-cies along the workflow chain. MapReduce, for example, seeks to improve efficiencies of the near-archive operations that initiate Fig. 1.Specialization of an iRODS server through appliance virtualization and the addition of domain- and application-specific ‘‘kits.’’
workflows. In our work so far, we have focused on building a small set of canonical near-archive, early-stage analytical operations that represent a common starting point in many analysis workflows in many domains. For example, average, variance, max, min, sum, and count operations of the general form:
result avgðvar;ðt0;t1Þ;ððx0;y0;z0Þ;ðx1;y1;z1ÞÞÞ;
that return, in this example, the average value of a variable when given its name, a temporal extent, and a spatial extent. Because of their widespread use, we refer to these simple operations as ‘‘canonical ops’’ with which more complex analytic expressions can be built. They provide a template for users as they begin their exploration of MapReduce analytics and are useful in their own right as steps in larger analyses. We tend to think of them as a type of assembly language instruction for climate data analysis.
The goal is to deploy the canonical ops within a framework that is able to capture their patterns of use and enable more complex analyses to be assembled and incorporated back into the system. The notion of engaging the broader community to deal with Big Data challenges has been used successfully in other settings, per-haps most notably with GalazyZoo, where a large user community
is helping search the Sloan Digital Sky Survey for patterns and observations of potential scientific value (Christian, Lintott, Smith, Fortson, & Bamford, 2012; Szalay et al., 2000; Young, 2010). We be-lieve that this type of social networking can play an important role in the future of climate analytics. The approach we are taking sets the stage for the community construction of new capabilities that are adapted to the socially expressed requirements of those who use the system.
3.5. Domain-harmonized APIs (CDS API)
In order to knit these capabilities together and deliver them into practical use, we are building the Climate Data Services (CDS) application programming interface (API). APIs specify how soft-ware components interact with each other; they can take many forms, but the goal for all APIs is to make it easier to implement the abstract capabilities of a system. In building the CDS API, we are trying to provide for climate science a uniform semantic treat-ment of the combined functionalities of large-scale data manage-ment and data-proximal analytics. In doing so, we are combining concepts from the Open Archive Information Systems (OAIS) Fig. 2.vCDS cloud provisioning and migration paths.
reference model, object-oriented programming APIs, and Web 2.0 resource-oriented APIs.
The Open Archive Information System (OAIS) reference model, defined by the Consultative Committee on Space Data Systems, ad-dresses a full range of archival information preservation functions including ingest, archival storage, data management, access, and dissemination – full information lifecycle management. It also ad-dresses the migration of digital information to new media and forms, the data models used to represent the information, the role of software in information preservation, and the exchange of digi-tal information among archives. OAIS provides examples and some ‘‘best practice’’ recommendations and defines a minimal set of responsibilities for an archive to be called an OAIS (OAIS, 2013). OAIS identifies both internal and external interfaces to the archive functions, and it identifies a number of high-level services at these interfaces (Fig. 3). These high-level services provide a vocabulary that we have adopted for the Climate Data Services Reference Mod-el and associated Library and API.
The CDS Reference Model is a logical specification that presents a single abstract data and analytic services model to calling appli-cations. As shown below, the CDS Reference Model can be imple-mented using various technologies; in all cases, however, actions are based on the following six primitives:
Ingest – Submit/register a Submission Information Package. Query – Retrieve data from a pre-determined service request (synchronous).
Order – Request data from a pre-determined service request (asynchronous).
Download – Retrieve a Dissemination Information Package. Status – Track progress of service activity.
Execute – Initiate a service-definable extension.
Within this OAIS-inspired framework, we are creating a Python-based CDS Library that contains methods that support the basic primitives (ingest, query, order, etc.) as well as extended utilities that combine these primitives into automated multi-step canonical ops (avg, max, min, etc.). The Library sits atop a RESTful Web Ser-vices Client that encapsulates inbound and outbound interactions with various climate data services. These provide the foundation
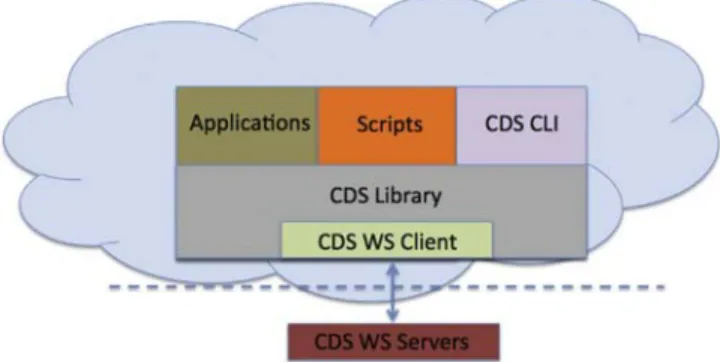
upon which we have built a CDS Command Line Interpreter (CLI) that supports interactive sessions. In addition, Python scripts and full Python applications also can use methods imported from the API. The resulting client stack can be distributed as a software package or used to build a cloud service (SaaS) or distributable cloud image (PaaS) (Fig. 4).
This approach to API design focuses on the specific analytic requirements of climate science and marries the language and abstractions of collections management with those of high-perfor-mance analytics. Doing so reflects at the application level the con-fluence of storage and computation that is driving Big Data architectures of the future. It is too early to tell, but we hope that this ‘‘harmonization’’ will make CAaaS more accessible to our users.
4. MERRA Analytic Services – A case study in cloud-enabled Climate Analytics-as-a-Service
MERRA Analytic Services (MERRA/AS) pull these elements to-gether in an end-to-end demonstration of CAaaS capabilities. MER-RA/AS enables MapReduce analytics over NASA’s Modern-Era Retrospective Analysis for Research and Applications (MERRA)
Fig. 3.Basic OAIS interactions that form the basis of the Climate Data Services Reference Model, Library, and API.
Fig. 4.Climate Data Services client stack built on the capabilities enabled by the CDS Reference Model, Web ServicesClient, Library, and API.
data. As we describe below, the MERRA collection is a reanalysis dataset that is of particular interest to a broad community of users. In simple terms, our vision for MERRA/AS is that it allows MER-RA data to be stored in a Hadoop Distributed File System (HDFS) on a MERRA/AS cluster. Functionality is exposed through the CDS API. The API exposures enable a basic set of operations that can be used to build arbitrarily complex workflows and assembled into more complex operations (which can be folded back into the API and MERRA/AS service as further extensions). The complexities of the underlying (Java) mapper and reducer codes for the basic opera-tions are encapsulated and abstracted away from the user, making these common ops easier to use.
An important adjunct to the MERRA/AS service is a persistence service, also exposed through the CDS API, that allows users to store, download, annotate, and otherwise manage Java codes or CDS scripts that implement the map and reduce functions of their analyses. The persistence service has the capacity to execute these codes on the MERRA cluster, capture the resulting output, and manage the output as the user wishes under control of the persis-tence service. The code sets essentially become realizable objects – their logical representations are used in server-side processes that cause their analytical results to be realized upon request.
In this section we describe these components in greater detail, demonstrate the use of MERRA/AS in example applications, and show the role that Cloud Computing is playing in these efforts. We begin with background information about the MERRA collection.
4.1. Reanalyses and the Modern Era Retrospective-Analysis for Research and Applications (MERRA)
The MERRA reanalysis integrates observational data with numerical models to produce a global temporally and spatially consistent synthesis of 26 key climate variables (Rienecker et al., 2011). Spatial resolution is 1/2°latitude2/3°longitude72 ver-tical levels extending through the stratosphere. Temporal resolu-tion is 6-h for three-dimensional, full spatial resolution, extending from 1979 to present, nearly the entire satellite era. MERRA data are typically made available to the general public through the NASA Earth Observing System Distributed Information System (EOSDIS, 2013). A subset of the data is made available to the climate research community through the Earth System Grid Federation (ESGF), the research community’s data publication infrastructure (ESGF, 2013).
We are focusing on the MERRA collection because there is an increasing demand for reanalysis data products by an expanding community of consumers, including local governments, federal agencies, and private-sector customers. Reanalysis data are used in models and decision support systems relating to disasters, eco-logical forecasting, health and air quality, water resources, agricul-ture, climate energy, oceans, and weather. Currently, MERRA data are generally moved to client applications for analysis and use. Convenient access to storage-side analytics could significantly im-prove the usefulness of this important collection.
4.2. The MERRA/AS HDFS repository
The Apache Hadoop software library is the classic framework for MapReduce distributed analytics (HDFS, 2013). We are using Cloudera, the 100% open source, enterprise-ready distribution of Apache Hadoop. Cloudera is integrated with configuration and administration tools and related open source packages, such as Hue, Oozi, Zookeeper, and Impala (Cloudera, 2013). There are many ways to configure a Hadoop cluster, but its basic architecture con-sists of an HDFS file system and a MapReduce engine, which is
responsible for executing mapper and reducer codes in parallel over the nodes that compose the HDFS.
MERRA data files are created from the Goddard Earth Observing System version 5 (GEOS-5) model and are stored in HDF-EOS and NetCDF formats (MERRA, 2013). Each file contains a single grid with multiple 2D and 3D variables. All data are stored on a longi-tude–latitude grid with a vertical dimension applicable for all 3D variables. The GEOS-5 MERRA products are divided into 25 collec-tions: 18 standard products, 7 chemistry products. The collections comprise monthly means files and daily files at 6-h intervals run-ning from 1979 to 2012. MERRA data are typically packaged as multi-dimensional binary data within a self-describing NetCDF file format. Hierarchical metadata in the NetCDF header contain the representation information that allows NetCDF software to work with the data. It also contains arbitrary preservation description and policy information that can be used to bring the data into use-specific compliance.
Total size of the native, compressed NetCDF MERRA collection in a standard filesystem is approximately 80 TB. Native MERRA files are sequenced and ingested into the Hadoop cluster in tripli-cated 640 MB blocks. Total size of the MERRA/AS HDFS repository is approximately 480 TB. The MERRA/AS HDFS is running on a 36-node Dell cluster that has 576 Intel 2.6 GHz SandyBridge cores, 1300 TB of raw storage, 1250 GB of RAM, and a 11.7 TF theoretical peak compute capacity. Nodes communicate through a Fourteen Data Rate (FDR) Infiniband network having peak TCP/IP speeds in excess of 20 Gbps.
4.3. The MERRA/AS server
The functional requirements of the MERRA/AS server derive from the basic organization of a Hadoop MapReduce system. As introduced above, a MapReduce Program has two components: one that implements a mapper, and another that implements a re-ducer. The mapper transforms each element of an input list to an output element; the reducer aggregates these output elements into a single result, which has the effect of turning a large volume of data into a smaller summary of itself. A third component, called the Driver, initializes the Program on the Job Tracker node, in-structs the Hadoop engine to execute the mapping and reducing codes on a set of input files, and controls where the output files are placed.
In MapReduce, every value has a key associated with it. Keys identify related values. The mapping and reducing functions re-ceive not just values, but <key, value> pairs. The output of each of these functions is the same: both a key and a value must be emitted to the next list in the data flow. These filtering and com-bining functions, executed in parallel over distributed data, collec-tively accomplish analytical operations of varying complexity within the MapReduce paradigm.
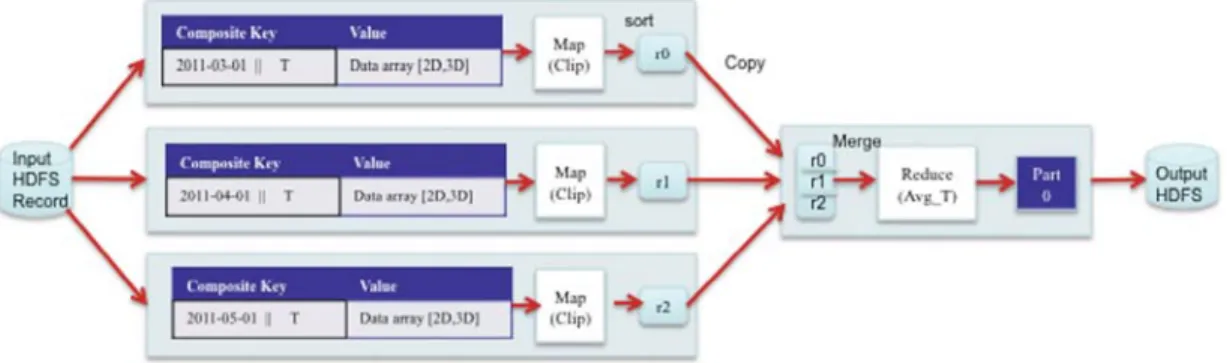
Most of the work of building the MERRA/AS server involves cre-ating utilities to move MERRA data into and out of the HDFS and writing the MapReduce programs that implement MERRA/AS’s canonical ops. Each file of native NetCDF binary data is converted into separate sequence files – flat files consisting of binary <key, value> pairs that can be operated on by mapper and reducer func-tions. These sequence files are block-compressed in HDFS and pro-vide direct serialization of several arbitrary binary data types. During sequencing, the data is partitioned by time, so that each re-cord in the sequence file contains the timestamp and name of the parameter (e.g. temperature) as the composite key and the value of the parameter (which could have 1–3 spatial dimensions).
In operation, map processes filter each sequence file to cap-ture <key, value> pairs that match the variable and time span of interest; reduce processes perform calculations based on input parameters (time, extents, etc.) and create new subset sequence Please cite this article in press as: Schnase, J. L., et al. MERRA Analytic Services: Meeting the Big Data challenges of climate science through cloud-enabled
files. The resulting sequence files are then transformed to NetCDF format in the de-sequencing process (Fig. 5).
The canonical operations that implement MERRA/AS’s average, variance, max, min, sum, and count calculations are Java MapRe-duce programs that are ultimately exposed as simple references to CDS Library methods or as web services endpoints. There is a substantial code ecosystem behind these apparently simple opera-tions, nearly 6000 lines of Java code being offloaded from the user to the MERRA/AS service.
4.4. MERRA/AS in use – RESTful web services
Our initial exposure for client applications that wish to con-sume MERRA/AS results is the MERRA/AS Web Service. We are using a Representational State Transfer (REST)-style architecture, which is the predominant web API design model. REST provides scalability of component interactions, accommodates intermediar-ies like firewalls and proxintermediar-ies without the need to change interfaces, and allows independent deployment of components where imple-mentations can change without the need to change interfaces. A concrete implement of a REST Web Service uses HTTP methods explicitly, is stateless, exposes directly structure-like URIs, and transfers XML, JavScript Object Notation (JSON), or both.
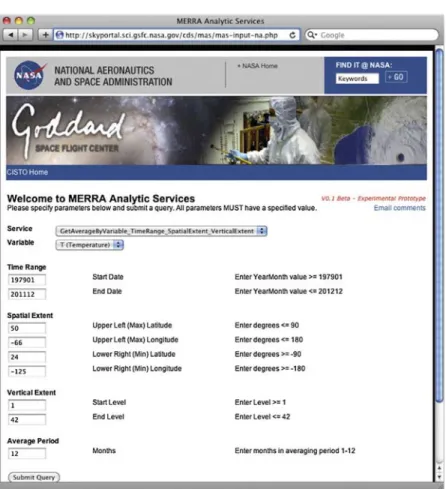
Our REST service has been built using the CDS API and makes calls to the CDS Library; its endpoint semantics adhere to the con-ventions we have established in the CDS API. A specific call to the MERRA/AS service to find the average temperature over a given period of time, geospatial extent, and span of altitudes looks some-thing like this:
http://skyportal.gsfc.nasa.gov/cds/mas/order.php?GetAverage ByVariable_TimeRange_SpatialExtent_VerticalExtent&variable_ list=T&operation=avg&start_date=201101&end_date=201112& avg_period=12&min_lon=125&min_lat=24&max_lon=-66&max _lat=50&start_level=1&end_level=42.
A simple form-based interface has been provided to enable beta testing of the MERRA/AS Web Services endpoints (Fig. 6).
4.5. MERRA/AS in use – The RECOVER wildland fire decision support system
A more interesting machine-to-machine use of MERRA/AS Web Services is demonstrated in the RECOVER project. In RECOVER, which stands for Rehabilitation Capability Convergence for Ecosys-tem Recovery, NASA is working with the Department of Interior’s Bureau of Land Management (BLM) and the National Interagency Fire Center (NIFC) to addresses two critical requirements in post-fire decision-making for savanna ecosystems: identification and
prioritization of target areas for reseeding and long-term ecosys-tem recovery monitoring.
RECOVER is a new decision support system (DSS) that will be incorporated into a long-standing post-fire decision process, the National Burned Area Emergency Response (BAER) program. After a major wildfire, law requires that the federal land management agencies certify a comprehensive plan for public safety, burned area stabilization, resource protection, and site recovery. These BAER plans are a crucial part of our national response to wildfire disasters. The plans are due within 14 days of containment of a ma-jor wildfire and become the guiding document for managing the activities and budgets for all subsequent remediation efforts. There are few instances in the federal government where plans of such wide-ranging scope are assembled on such short notice and trans-lated into action more quickly (BAER, 2013).
BAER plans are largely developed on-site by multi-agency teams of specialists that include natural resource managers and scientists with expertise in the salient disciplines. The nature and setting of their work create a need for decision support tools that allow sound decision-making and land management planning to take place quickly for a specific region of interest. Remote sensing imagery is often used to complement field-based assessments and to provide landscape or regional scale monitoring. Several indica-tors derived from satellite imagery can be used to characterize both fire severity and intensity as well as vegetation recovery fol-lowing fire. For several analyses, historical ecosystem conditions of the type captured in MERRA’s variables are of importance.
Critical site-specific information that could otherwise improve outcomes does not become part of the decision-making process unless it is immediately available to the BAER teams. RECOVER is a context-aware, site-specific DSS that brings together in a single application the information necessary for BAER team post-fire rehabilitation decision-making. In a typical scenario-of-use, a RE-COVER instance is created automatically in response to a fire detec-tion event. Using the rapid resource allocadetec-tion capabilities of Cloud Computing, Earth observational data, MERRA data, and derived decision products are automatically collected and refreshed throughout the burn so that when the fire is declared under con-trol, BAER teams have at hand a complete and ready-to-use RE-COVER dataset that is customized for the target wildfire.
The system itself comprises a RECOVER Server and RECOVER Clients. The RECOVER Server is a tailored vCDS deployed in the Amazon Elastic Compute Cloud (EC2). When provided a wildfire name and geospatial extent, the RECOVER Server aggregates data from a suite of web services, does the necessary transformations and reprojections required for the data to be used by RECOVER Cli-ents, and, in turn, exposes the tailored collection through a Web Map Service running in the Server. RECOVER calls on MERRA/AS’s Web Service, thereby providing an easy integration of this hereto-fore seldom used resource into the BAER process (Fig. 7).
Fig. 5.Sequencing/de-sequencing operations performed by MERRA/AS utilities for the MERRA HDFS repository.
RECOVER’s feasibility has been demonstrated in Idaho during the 2013 wildfire season. Over the next 3 years, RECOVER will be deployed into operational use in the Great Basin states of Idaho, Utah, and Nevada where EC2’s auto-scaling and elastic load balanc-ing capabilities will be particularly beneficial.
4.6. MERRA/AS in use – Earth System Grid Federation (ESGF) publication
NASA scientists contribute climate data, including MERRA prod-ucts, to the Intergovernmental Panel on Climate Change, which represents a team of nearly 1000 experts working throughout the world on issues of climate change (IPCC, 2013). This research com-munity uses the Earth System Grid Federation (ESGF) as the pri-mary mechanism for publishing IPCC data as well as the ancillary observational and reanalysis products used in model/model and observation/model data inter-comparison, an important aspect of climate change research (Edwards, 2010). ESGF functions like a peer-to-peer content distribution network in which geographically distributed collections can be accessed by the climate research community through a certificate authority mechanism (CA). Published ESGF data, regardless of source, conforms to the commu-nity-defined Climate Model Inter-comparison Program (CMIP5) Data Reference Syntax and Controlled Vocabularies standard (Taylor et al., 2012). The trust relationship set up by the CA mech-anism essentially creates a virtual organization of producers and consumers of ESGF products.
Institutions, such as the NCCS, that host ESGF servers have responsibility for correctly formatting and registering their data contributions. Preparing MERRA data for ESGF publication requires reformatting in order to make it comply with the CMIP5 standard.
This ontological alignment – moving from the semantic frame of reference defined by the producers of the MERRA data to that used by ESGF – is often a mixed process of automatic and manual con-version and contributes significantly to the data preparation over-head of supporting the IPCC project.
To facilitate this process, we have deployed vCDS in the Amazon cloud and have used the system to deliver a subset of NASA’s MER-RA products to the ESGF server, also running in the Amazon cloud. vCDS-managed objects are exposed to ESGF through FUSE (Filesys-tem in User Space), which presents a POSIX-compliant filesys(Filesys-tem abstraction to applications such as the ESGF server that require such an interface (Fig. 8). vCDS will ultimately provide a persis-tence service that hosts the MapReduce codes that extract ESGF products from MERRA/AS. vCDS will also provide a place in the stack for other utilities, such as those required for ontology align-ment and metadata managealign-ment.
4.7. MERRA/AS in use – The Wei method for programmed data assembly and capability enhancement
Wei, Dirmeyer, Wisser, Bosilovich, and Mocko (2013), in a hydrological study that focuses on the contribution of irrigation to precipitation, provides an excellent example of the way MERRA data are used in investigations of this type. We are using the Wei experiment, and others like it, to develop the MERRA/AS API, Com-mand Interpreter, scripting, and programming capabilities. The goal at this early stage is to demonstrate and evaluate the ability of CAaaS and the CDS Client Stack to simplify the work of data assembly and the community construction of enhanced CAaaS functionality.
Fig. 6.MERRA/AS’s canonical MapReduce operations are exposed through RESTful web services and a simple forms interface.
Simply put, the Wei team used MERRA data to study four inten-sively irrigated regions – northern India/Pakistan, the North China Plain, the California Central Valley, and the Nile Valley. The study
used a quasi-isentropic back-trajectory (QIBT) method to track water vapor for precipitation events backward in time assuming precipitated water is drawn from the atmospheric column along Fig. 7.RECOVER Server (a) and Client (b) interfaces.
a distribution that follows the vertical profile of atmospheric spe-cific humidity. Seasonal rates of evapotranspiration with and with-out irrigation over the studied areas were then compared to assess the impact of irrigation.
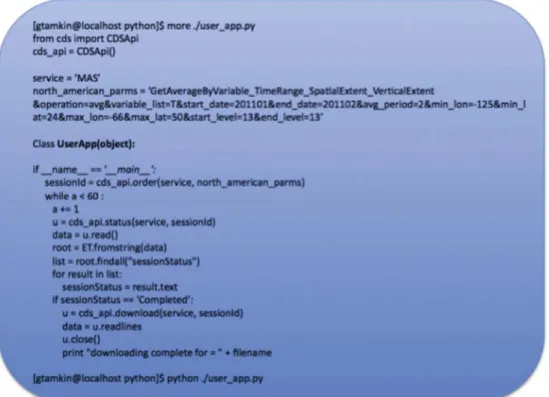
The data required for these calculations include precipitation, evapotranspiration, temperature, humidity, and wind at different tropospheric levels at six-hourly time steps from 1979 to 2002. This early-stage data reduction – average values for environmental variables over specific spatiotemporal extents – is the type of data assembly that historically has been performed on the scientist’s workstation after wholesale transfers from public archives of large blocks of data. The experiment provides a useful example of how MERRA/AS pushes these first analytic steps onto the storage server. The Python script shown in Fig. 9 demonstrates the ease with which this work can be done through CAaaS as implemented by the CDS API and MERRA/AS. As a further refinement, as QIBT anal-ysis is perfected for this experiment, one can imagine developing the analysis into an extended utility for subsequent inclusion in the CDS Library for use by others.
5. Results and discussion
This CEUS special issue focuses on how Cloud Computing en-ables Big Data processing. It also explores how Big Data challenges, in turn, can foster the advancement of Cloud Computing. From our perspective, Cloud Computing’s most import effects on Big Data are a direct and indirect result of its contributions to generativity and what that means for our ability to engage the community in solv-ing some of the Big Data challenges of climate science. Cloud Com-puting also is influencing the way we connect earthbound data centers to an expanding array of customers and applications. We discuss this in greater detail in this section, beginning with Cloud Computing’s most immediate influence, which is on the way soft-ware is developed and deployed.
5.1. Agile development and deployment
We use Cloud Computing extensively in our software engineer-ing activities, workengineer-ing with a large collection of specialized images. Doing so conveys the classic advantages almost universally recog-nized as benefits of the technology (Ernst & Young, 2011). It gives us the ability to manage risk by ‘‘trialing’’ hardware and software solutions, its elasticity allows IT infrastructure to be increased at will, and it advances the green agenda by allowing fuller use of shared resources and lowering our carbon footprint.
Perhaps most important, however, Cloud Computing lowers the barriers and risks to organizational change. Small groups can experiment with sophisticated applications that they ordinarily could not afford. This enables ‘‘skunkworks’’ experimentation, encourages innovation, and, important to our work, provides the flexibility we need to respond to an ever-increasing demand to support new customers and new applications.
The economic appeal of Cloud Computing is often described as converting capital expenses (CapEx) to operating expenses (OpEx), this pay-as-you-go stance more directly capturing the cost benefit to the buyer and enabling an agility beyond what is possible through capital expansion. In the work we do, this consideration has an interesting twist. As illustrated in the RECOVER project de-scribed above, much of the work that NASA does is in partnership with operational agencies that ultimately take ownership of jointly developed new capabilities. Cloud-centered development greatly simplifies these types of interagency transfers: capabilities devel-oped in the Amazon cloud, for example, can be conveyed through Fig. 8.MERRA/AS ESGF publication stack.
accounting actions, avoiding altogether the complexities of tradi-tional hardware procurement in either agency. This is proving to be a substantial benefit.
Finally, Cloud Computing enables higher order services that heretofore have been impossible. Almost any slice of the software stack, including IaaS, PaaS, SaaS – and importantly, new composi-tions of services – can be bought or built as a service. New services can ride atop multiple cloud services and engage an organization’s internal staff, leading to the evolution of higher value business pro-cesses, innovative offerings, and, ultimately, the ability to offer specialized business processes-as-a-service. That is what we are striving for with Climate Analytics-as-a-Service: connecting our specialized science processes and knowledge to cloud-enabled Big Data offerings for customers who need the knowledge gener-ated by research in climate science.
5.2. Scalable, tailorable intermediation
The U.S. Federal Government spends nearly $80 billion each year on information technology (VanRoekel, 2013). The Brookings Institution estimates that government agencies can save 25–50% by moving to the cloud (West, 2010). It is not surprising, then, that Cloud Computing is receiving enormous attention at all levels of government (Kundra, 2011). And, as one might expect, the nature of those discussions depends on the type of work done by the var-ious agencies.
The diversity of NASA’s engineering and scientific work poten-tially enabled by Cloud Computing is quite broad (Little & Petraska, 2013). The focus of our interest and this paper is climate modeling, which is a world dominated by high-performance computing and the petabyte-scale storage of climate model outputs. The extent to which aspects of high-performance climate modeling can effec-tively be moved to the cloud is an open question. With regard to large-scale storage, transfer rates and costs are an issue. In time, these issues are likely to be sorted out. At this point, however, it is safe to say that much of the core work we do remains
earth-bound – and one of the major advantages of Cloud Computing is its flexible capacity to connect enterprise capabilities with diversi-fying customer needs.
In the examples we have shown here, Cloud Computing is pro-viding for us a new tier in the data services stack – a cloud-based layer where agile customization occurs and enterprise-level prod-ucts are transformed to meet the specialized requirements of applications and consumers. It helps us close the gap between the world of traditional, high-performance computing, which, at least for now, resides in a finely-tuned climate modeling environ-ment at the enterprise level and our new customers, whose expec-tations and manner of work are increasingly influenced by the smart mobility megatrend. That is not easy to do if the gap must be bridged by accommodations at the enterprise level.
At a foundational level, this strategy of cloud-enabled interme-diation resonates with contemporary trends. Smartphones are said to be spreading faster than any technology in human history (DeGusta, 2012). Most modern smartphones, tablets, etc. actually consist of just the display and user interface components of sophis-ticated applications that run in cloud data centers. This is a mode of work that CAaaS is intended to accommodate, and Cloud Comput-ing is crucial to our ability to participate in that world.
5.3. Cloud Computing’s contributions to generativity
We began this paper by introducing the idea that generativity – the capacity for autocatalytic feeding forward of capability – is ulti-mately the key to dealing with the Big Data challenges of climate sci-ence. It represents our attempt to articulate what we believe is Cloud Computing’s most important influence. For us, the transformational link between Big Data and Cloud Computing is that Cloud Comput-ing is a critical potentiator in a constellation of technologies that sat-isfyZittrain’s (2008)necessary requirements for generativity.
Table 1summarizes what we believe are the major effects of the core technologies behind Climate Analytics-as-a-Service. MapReduce and iRODS fundamentally make analytics and data Fig. 9.Python script using the CDS API to assemble MERRA/AS data required for the Wei experiment.
aggregation easier; the approach to software appliance virtualiza-tion in vCDS makes it easier to transfer capabilities to new users and simplifies their ability to build new applications; the social construction of extended capabilities facilitated by the notion of canonical operations enable adaptability; and the CDS API enables ease of mastery.
What is important to note about this is Cloud Computing is co-evolving with and driving the development of three key elements in this generative assemblage: virtualization, Web APIs, and cloud-based analytics, including a burgeoning array of MapReduce offerings. Granted, satisfying the requirements for generativity does not guarantee a generative outcome. But we are hopeful that we are beginning to develop the right framework for that. 5.4. Cloud Computing detractions
We have not been immune to the classic inhibitors of Cloud Computing adoption. Organizational culture shock has been an is-sue: it has at times been difficult for a traditional high-perfor-mance computing center, skilled and comfortable with technical implementation, to focus on differentiating Cloud Computing’s va-lue-add for the organization. There have been control issues and is-sues relating to data locality – it is still comforting for many scientists to know the physical location of their data. Issues of security, privacy, regulatory compliance, etc. have been a signifi-cant early concern in all matters relating to Cloud Computing.
What is interesting to note is that we, like other organizations transitioning to the cloud, are beginning to see many of these inhibitors being transformed into accelerants (Ernst & Young, 2011). Clearly, a tipping point has been reached, where the poten-tial adverse impact of inhibitory factors on the market potenpoten-tial of the cloud industry is prompting a response. Cloud service provid-ers are investing far more to develop their security infrastructure and bring their services into regulatory compliance than any typi-cal enterprise is able to do. As a result, consumers of cloud services are beginning to turn to Cloud Computing as a means of simplify-ing their lives and thus acceleratsimplify-ing the adoption of the technology. The shift in attitude about Cloud Computing in our organization over the past 2 years has been dramatic.
5.5. Research directions
We still have much to learn about how to use Cloud Computing, and the Big Data challenges of climate science are far from being solved. In the near term, we intend to focus on hardening the CDS API and its underlying data services architecture, since these are the critical elements of our CAaaS approach. Administration of the cloud intermediation tier is another crucial area requiring attention: we need to identify and develop the tools, policies, pro-tocols, and experience required to operationalize the cloud-en-abled enterprise/customer bridge described above. Finally, perhaps most interesting and valuable of all, we need to deploy Cli-mate Analytics-as-a-Service at sufficient scale and in such a way that we can definitely evaluate its potential for generativity and capacity to address the Big Data challenges of climate science.
Acknowledgements
We thank Scott Sinno, Ben Bledsoe, Ed Luczak, Mike Little, and Tsengdar Lee for their many contributions to this effort. Roger Gill, Keith Weber, Mark Carroll, George Haskett, and Tess Gardiner were instrumental in making the RECOVER project possible. Thanks also to the iRODS development team at the University of North Carolina at Chapel Hill’s Renaissance Computing Institute (RENCI) for their indispensable technical advice on the work we do with iRODS. Readers who wish to access the applications described in this pa-per are invited to contact the authors to make arrangements. This work has been funded in part by grants from NASA’s High-End Computing Program and NASA’s Applied Sciences Program. References
Agrawal, D., Das, S., & Abbadi, A. E. (2011). Big data and cloud computing: current state and future opportunities. InElectronic proceedings of the 14th international conference on extending database technology (EBDT 2011) (4 pp.). <http:// www.edbt.org/Proceedings/2011-Uppsala/papers/edbt/a50-agrawal.pdf>.
Baker, K. S., & Bowker, G. C. (2007). Information ecology: Open system environment for data, memories, and knowing.Journal of Intelligent Information Systems: Integrating Artificial Intelligence and Database Technologies, 29(1), 127–144.
Berman, F. (2008). Got data? A guide to data preservation in the information age.
Communications of the ACM, 51(12), 50–56.
Buck, J. B., Watkins, N., LeFevre, J., Ioannidou, K., Maltzahn, C., Polyzotis, N., et al. (2011). SciHadoop: Array-based query processing in Hadoop. InProceedings of 2011 international conference for high performance computing, networking, storage and analysis (SC ‘11) (pp. 1–11). <http://users.soe.ucsc.edu/~alkis/ papers/sc11_scihadoop.pdf>.
Burned Area Emergency Response (BAER) (2013). <http://www.nifc.gov/BAER>. Christian, C., Lintott, C., Smith, A., Fortson, L., & Bamford, S. (2012).Citizen science:
Contributions to astronomy research(12 pp.). Cornell University Library open access archive e-Print arXiv:1202.2577. <http://arxiv.org/abs/ arXiv:1202.2577>.
Cloudera (2013). <http://cloudera.com>.
Dean, J., & Ghemawat, S. (2008). MapReduce: Simplified data processing on large clusters.Communications of the ACM, 51, 107–113.
DeGusta, M. (2012). Are smart phones spreading faster than any technology in human history?MIT Technology Review. <http://www.technologyreview.com/ news/427787/are-smart-phones-spreading-faster-than-any-technology-in-human-history/>.
Duffy, D. Q., Schnase, J. L., Clune, T. L., Kim, E. J., Freeman, S. M., Thompson, J. H., et al. (2011). Preliminary Evaluation of MapReduce for high-performance climate data analysis.AGU fall meeting abstracts,2011 AGU fall meeting, San Francisco, December. <http://adsabs.harvard.edu/abs/2011AGUFMIN44A.08>.
Duffy, D. Q., Schnase, J. L., Clune, T. L., Kim, E. J., Freeman, S. M., Thompson, J. H., et al. (2012). Preliminary evaluation of MapReduce for high-performance climate data analysis. NASA new technology report white paper (6 pp.). <http:// ntrs.nasa.gov/archive/nasa/casi.ntrs.nasa.gov/20120009187_2012009164.pdf>. Earth Observing System Distributed Information System (EOSDIS) (2013). <https://
earthdata.nasa.gov>.
Edwards, P. N. (2010).A vast machine: Computer models, climate data, and the politics of global warming (518 pp.). Cambridge, Mass: MIT Press.
Ernst & Young (2011). Cloud computing issues and impacts.Publication in the Ernst & Young global technology industry discussion series. <http://www.ey.com/ Publication/vwLUAssets/Cloud_computing_issues,_impacts_and_insights/$File/ Cloud%20computing%20issues%20and%20impacts_14Apr11.pdf>.
Earth Systm Grid Federation (ESGF) (2013). <http://esgf.org>.
Hadoop Distributed File System (HDFS) (2013). <http://hadoop.apache.org>. Intergovernmental Panel on Climate Change (IPCC) (2013). <http://www.ipcc.ch>. Integrated Rule-Oriented Data System (iRODS) (2013). <http://www.irods.org>. Kundra, V. (2011). Federal cloud computing strategy.White House publication of the
U.S. Chief Information Officer (43 pp.). <http://www.whitehouse.gov/sites/ default/files/omb/assets/egov_docs/federal-cloud-computing-strategy.pdf>. Little, M. & Petraska, K. (2013). NASA science and cloud computing capabilities. In
Presentation at the 2013 summer meeting of the federation of earth science Table 1
Contributions of core Climate Analytics-as-a-Service (CAaaS) technologies to generativity. Elements marked by an asterisk are influenced directly or indirectly by Cloud Computing.
Element Leverage Adaptability Ease of mastery Accessibility Transferability
MapReduce* p
iRODS p
vCDS* p p
Canonical Ops p
CDS API* p p p
information partners (ESIP 2013), July 9–12, 2013, Chapel Hill, NC. <http:// esipfed.org/data-and-informatics>.
Mell, P. & Grace, T. (2011). The NIST definition of cloud computing.National Institutes of Standards (NIST) special publication 800-145. <http://csrc.nist.gov/ publications/nistpubs/800-145/SP800-145.pdf>.
Modern-Era Retrospective Analysis for Research and Applications (MERRA) (2013). <http://gmao.gsfc.nasa.gov/merra/>.
NASA Center for Climate Simulation (NCCS) (2013). <http://www.nccs.nasa>. Open Archive Information System (OAIS) Reference Model. <http://public.ccsds.org/
sites/cwe/rids/Lists/CCSDS%206500P11/Attachments/650x0p11.pdf>. Rienecker, M.M., Suarez, M.J., Gelaro, R., Todling, R., Bacmeister, J., Liu, E., et al.
MERRA: NASA’s modern-era retrospective analysis for research and applications, Journal of Climate, 2011, 24(14), 3624-3648. <http://dx.doi.org/ 10.1175/JCLI-D-11-00015.1>.
Saltzer, J. H., Reed, D. P., & Clark, D. D. (1984). End-to-end arguments in system design.ACM Transactions on Computer Systems, 2(4), 277–288.
Schnase, J. L., Webster, W. P., Parnell, L. A., & Duffy, D. Q. (2011). The NASA Center for Climate Simulation data management system: Toward an iRODS-based approach to scientific data services. InIEEE Xplore digital library proceedings of the 27th IEEE symposium on massive storage systems and technologies (MSST 2011),May 26–27, 2011, Denver, CO (6 pp.).
Schnase, J. L., Tamkin, G., Fladung, D., Sinno, S., & Gill, R. (2011). Federated observational and simulation data in the NASA Center for Climate Simulation data management system project. InProceedings of the iRODS user group meeting 2011: Sustainable policy-based data management, sharing, and preservation, February 17–18, 2011, University of North Carolina, Chapel Hill, NC (14 pp.). <http://iren-web.renci.org/irods-meeting/nasa.pdf>.
Schnase, J. L., Duffy, D. Q., Tamkin, G. S., Strong, S., Ripley, D., Gill, R., et al. (2011). iRODS-based climate data services and virtualization-as-a-service in the NASA Center for Climate Simulation.American Geophysical Union (AGU) fall meeting poster, December 5–9, 2011, San Francisco, CA.
Schnase, J. L., Tamkin, G. S., Ripley, W. D., III, Strong, S., Gill, R., & Duffy, D. Q. (2012). The Virtual Climate Data Server (vCDS): An iRODS-based data management software appliance supporting climate data services and
virtualization-as-a-service in the NASA Center for Climate Simulation. InProceedings of the iRODS user group meeting 2012: Policy-based data management for managing community-driven collection life cycles,March 1–2, 2012, University of Arizona, Tempe, AZ (10 pp.).
Skytland, N. (2012). Big Data: What is NASA doing with Big Data today?Open.Gov open access article. < http://open.nasa.gov/blog/2012/10/04/what-is-nasa-doing-with-big-data-today/>.
Snijders, C., Matzat, U., & Reips, U. D. (2012). Big data: Big gaps of knowledge in the field of Internet science.International Journal of Internet Science, 7, 1–5.
Szalay, A. S., Kunszt, P. Z., Ani Thakar, A., Gray, J., Slutz, D., & Brunner, R. J. (2000). Designing and mining multi-terabyte astronomy archives: The Sloan digital sky survey. InProceedings of the 2000 ACM SIGMOD international conference on Management of data (SIGMOD ‘00)(pp. 451–462). New York, NY, USA: ACM. Tamkin, G. S. (2013). Hadoop for high-performance climate analytics. Hadoop
summit, Palo Alto, July. <http://www.youtube.com/watch?v=1UMBiVlsPp0>. Taylor, K. E., Balaji, V., Hankin, S., Juckes, M., Lawrence, B., & Pascoe, S. (2012).CMIP5
Data Reference Syntax (DRS) and controlled vocabularies(16 pp.). < http://cmip-pcmdi.llnl.gov/cmip5/docs/cmip5_data_reference_syntax.pdf>.
VanRoekel, S. (2013). Federal information technology FY 2013 budget priorities. Publication of the White House U.S. Chief Information Officer(16 pp.). <https:// cio.gov/wp-content/uploads/2012/09/FY2013-IT1.pdf>.
Webster, P. (2013). Supercomputing the climate: NASA Big data mission.CSC World. Computer Sciences Corporation. <http://www.csc.com/cscworld/publications/ 81769/81773-supercomputing_the_climate_nasa_s_big_data_mission>.
Wei, J., Dirmeyer, P. A., Wisser, D., Bosilovich, M. G., & Mocko, D. M. (2013). Where does irrigation water go? An estimate of the contribution of irrigation to precipitation using MERRA.Journal of Hydrometeorology, 14(2), 271–289. West, D. M. (2010).Saving money through cloud computing. A governance studies at
Brookings Publication, Brookings Institution (14 pp.). <http:// www.brookings.edu/research/papers/2010/04/07-cloud-computing-west>. Young, J. R. (2010). Crowd science reaches new heights. Chronicle of Higher
Education. <http://chronicle.com/article/The-Rise-of-Crowd-Science/65707/>.
Zittrain, J. (2008).The future of the Internet—And how to stop it (342 pp.). New Haven: Yale University Press.