Managing
Snort Alerts
Scripts and Samples in this Chapter
â–
Gathering Snort Logs
â–
Building an Alerts Detail Report
â–
Building an Alerts Overview Report
â–
Managing Snort Rules
Chapter 5
In This Toolbox
Snort is an open source intrusion detection system (IDS) used in a wide variety of network
environments. Snort is a lightweight, but extremely powerful tool for detecting malicious traffic
on your network. With a flexible and robust rules definition language, Snort is capable of
detecting nearly any threat that crosses your network.
However, if you use Snort, you already know that reporting is not its strength. On a busy
network you might find that it records tens or hundreds of thousands of suspicious events every
day. Fortunately, Log Parser is a perfect match for Snort for managing intrusion detection logs.
Building Snort IDS Reports
An intrusion detection system is only valuable if you review and act on the data it produces.
Unfortunately, sometimes an IDS will produce overwhelming amounts of data that make it
diffi-cult to process.To aid in our interpretation of the data, we can use Log Parser to take snapshots
of our IDS logs and present them in different easy-to-read reports. In this chapter, we will build
an example IDS report using nothing more than the power of Log Parser.
Gathering Snort Logs
To process the alert data, we first need a consistent method for gathering the data. Log Parser is
an excellent method for managing Snort logs because you can query the file while Snort still has
the log open. Many administrators schedule scripts to regularly cycle the Snort logs, but this
requires stopping the service to release the file so a script can move it. Using Log Parser, we can
use checkpoints to read the most recent data from the file.
Although Snort supports several output formats that Log Parser could use, I have found the
CSV format most flexible and consistent.To configure Snort to use the CSV output format,
simply add the following line in the
snort.conf
file:
output alert_csv: alert.csv default
This configures Snort to create a CSV log file named alert.csv in the configured logs
direc-tory using the default output fields. By default the CSV output processor includes these fields:
â–
timestamp
â–sig_generator
â–sig_id
â–sig_rev
â–msg
â–proto
â–src
â–srcport
â–dst
â–dstport
â–ethsrc
â–ethdst
â–ethlen
â–tcpfags
Snort CSV logs do not include a header row, so we need a separate file to name each
column. In the file download for this chapter, I have included the file AlertHeader.csv to use for
this purpose.To read CSV Snort alerts, you would use a command like this:
logparser.exe file:alert.sql i:csv headerRow:off iHeaderFile:AlertHeader.csv -iTsFormat:mm/dd/yy-hh:mm:ss
Note that we specify the CSV input format, but instead of using the header row, we specify
a header file using the
iHeaderFile
option. We also specify the timestamp format so Log Parser
can interpret that field as an actual time stamp rather than a string.
NOTE
All of the queries in this chapter use the year in the timestamp date, which Snort
does not log by default. To configure Snort to log the year, use the –y
option when
starting Snort. If your timestamps do not include the year, the queries in this
chapter will return the error, “Semantic Error: argument of function TO_TIME must
be a TIMESTAMP.â€
Building an Alerts Detail Report
In our IDS report we likely want to view summaries of the alert data such as:
â–
Most common alerts
â–
Most common source IP (Internet Protocol) addresses
â–
Most common target IP addresses
Using Log Parser’s multiplex feature and template output format we can very easily create
interactive HTML (Hypertext Markup Language) reports directly from the Snort logs.
â–
tcpseq
â–tcpack
â–tcplen
â–tcpwindow
â–ttl
â–tos
â–id
â–dgmlen
â–iplen
â–icmptype
â–icmpcode
â–icmpid
â–icmpseq
Most Common Alerts
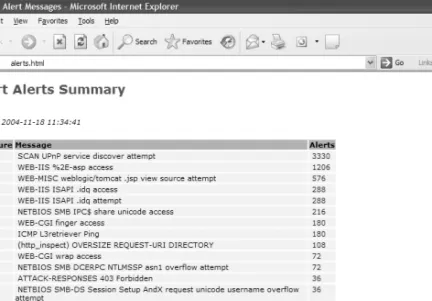
To begin our report, we will create HTML pages for the most common alerts. We will start with
an index page showing the most common alert messages. Each line will have a link to a more
detailed HTML page listing individual alerts with that message.The query for the index page is
simple:
---Ch05Alerts-Index.sql---SELECT DISTINCT sig_id, msg, Count(msg) as Alerts INTO report\alerts.html FROM alert.csv GROUP BY msg, sig_id ORDER BY Alerts DESC---Ch05Alerts-Index.sql---The key component here is the so much the query but the output template:
---Ch05Alerts-Index.tpl---<LPHEADER> <html> <head>
<meta http-equiv="Content-Type" content="text/html; charset=windows-1252"> <link rel="stylesheet" type="text/css" href="snort.css">
<title>Snort Alert Messages</title> </head>
<body>
<p><h1>Snort Alerts Summary</h1><br/> <i>Created %SYSTEM_TIMESTAMP% </i></p>
<table border="0" width="75%" cellspacing="2"> <tr> <th><b>Signature</b></th> <th><b>Message</b></th> <th><b>Alerts</b></th> </tr> </LPHEADER> <LPBODY> <tr> <td><a href=http://www.snort.org/snort-db/sid.html?sid=%sig_id%> %sig_id%</a></td> <td> %msg%</td> <td><a href=alert\%sig_id%.html> %Alerts%</a></td> </tr> </LPBODY> <LPFOOTER> </table>
</p> </body> </html> </LPFOOTER>
---Ch05Alerts-Index.tpl---You can run the query using the output template using this command:
logparser.exe file:Ch05AlertsIndex.sql i:csv iHeaderFile:AlertHeader.csv -iTsFormat:mm/dd/yy-hh:mm:ss -headerRow:off -o:tpl -tpl:Ch05Alerts-Index.tplRun this command and in a matter of seconds you should have a file named alerts.html that
looks like the one shown in Figure 5.1. Note that the report lists the alerts in order, starting with
the most common messages. If you click on the signature ID, it will jump to the reference page
at www.snort.org. Note that the alert total is also a hyperlink, but we have not created that page
yet. We now need to run another query to generate log details for each alert message.
Creating a detail page for every individual message is surprisingly simple:
---Ch05Alerts-Detail.sql---SELECT sig_id, TO_TIME(timestamp) AS Time, msg, proto, src, srcport,dst, dstport, ethsrc, ethdst, ethlen, tcpflags, tcpseq, tcpack, tcplen, tcpwindow, ttl, tos, id, dgmlen, iplen, icmptype, icmpcode, icmpid, icmpseq INTO report\alert\*.html FROM alert.csv
---Ch05Alerts-Detail.sql---This query takes advantage of Log Parser’s multiplex feature and creates a unique output file
for each unique value of
sig_id
, the first field in the query. It uses this value in place of the
asterisk (
*
) in the filename specified on the INTO clause. Since we use the signature ID in the
output filename, it is easy for us to link to those files from the main alert.html page.
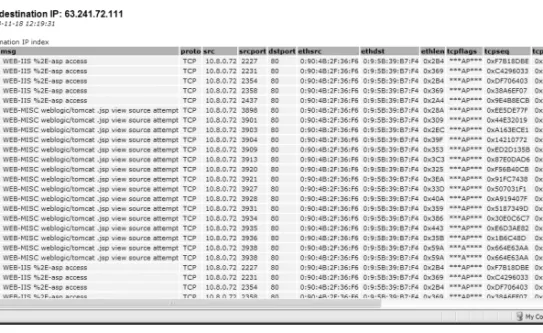
For the alert detail pages, I wanted use a title at the top of the page showing the particular
alert message, as shown in Figure 5.2. However, you cannot use field placeholders in the
LPHEADER portion of the template file. For example, if I placed
%msg%
in the
LPHEADER, each page would simply have %msg% as the title.
Nevertheless, sometimes a little creativity can make up for Log Parser’s limitations.To write
the individual titles, I actually run the query twice, once to write the headers and again to write
the detail information. For the first pass I use this query and template file:
---Ch05Alerts-DetailHeader.sql---SELECT DISTINCT sig_id, msg INTO report\alert\*.html FROM alert.csv ---Ch05Alerts-DetailHeader.sql--- ---Ch05Alerts-DetailHeader.tlp---<LPBODY> <html> <head>
<meta http-equiv="Content-Type" content="text/html; charset=windows-1252"> <link rel="stylesheet" type="text/css" href="..\snort.css">
<title>%msg%</title> </head>
<body>
<p><b><font face="Arial" size="3">Alert: %msg%</font></b><br/> <i>Created %SYSTEM_TIMESTAMP% </i></p>
<a href=..\alerts.html>Back to alerts index</a> </LPBODY>
---Ch05Alerts-DetailHeader.tlp---Run the query with this command:
logparser.exe file:Ch05AlertsDetailHeader.sql i:csv iHeaderFile:AlertHeader.csv -iTsFormat:mm/dd/yy-hh:mm:ss -headerRow:off -o:tpl -tpl:Ch05Alerts-DetailHeader.tpl
The query first pulls the
sig_id
and
msg
and creates a unique file for each
sig_id
and
writes a header using
msg
in the LPBODY. At this point we have a set of files with nothing but
a header. Next, we run another set of queries using Ch05Alerts-Detail.sql and this template:
---Ch05Alerts-Detail.tpl---<LPHEADER>
<table border="0" width="100%" cellspacing="2"> <tr> <th><b>timestamp</b></th> <th><b>proto</b></th> <th><b>src</b></th> <th><b>srcport</b></th> <th><b>dst</b></th> <th><b>dstport</b></th> <th><b>ethsrc</b></th> <th><b>ethdst</b></th> <th><b>ethlen</b></th> <th><b>tcpflags</b></th> <th><b>tcpseq</b></th> <th><b>tcpack</b></th> <th><b>tcplen</b></th> <th><b>tcpwindow</b></th> <th><b>ttl</b></th> <th><b>tos</b></th> <th><b>id</b></th> <th><b>dgmlen</b></th> <th><b>iplen</b></th> <th><b>icmptype</b></th> <th><b>icmpcode</b></th> <th><b>icmpid</b></th> <th><b>icmpseq</b></th> </tr> </LPHEADER> <LPBODY> <tr> <td> %time%</td> <td> %proto%</td> <td> <a href=..\src\%src%.html>%src%</a></td> <td> %srcport%</td> <td> <a href=..\dst\%dst%.html>%dst%</a></td>
<td> %dstport%</td> <td> %ethsrc%</td> <td> %ethdst%</td> <td> %ethlen%</td> <td> %tcpflags%</td> <td> %tcpseq%</td> <td> %tcpack%</td> <td> %tcplen%</td> <td> %tcpwindow%</td> <td> %ttl%</td> <td> %tos%</td> <td> %id%</td> <td> %dgmlen%</td> <td> %iplen%</td> <td> %icmptype%</td> <td> %icmpcode%</td> <td> %icmpid%</td> <td> %icmpseq%</td> </tr> </LPBODY> <LPFOOTER> </table> </p> </body> </html> </LPFOOTER>
---Ch05Alerts-Detail.tp---This time when we run the query, we use this command:
logparser.exe file:Ch05AlertsDetail.sql i:csv iHeaderFile:AlertHeader.csv
-iTsFormat:mm/dd/yy-hh:mm:ss -headerRow:off -o:tpl -tpl:Ch05Alerts-Detail.tpl -fileMode:0
Note that I used
–fileMode:0
in the command to instruct Log Parser to append to the files
rather than overwrite them. In this pass, Log Parser will take the files already containing titles
and append the alert details as shown earlier in Figure 5.2.The two-pass approach will obviously
slow down report creation time with very large alert files, but it is still surprisingly effective for
most purposes.
TIP
If you find that the two-pass approach is too slow, another option is to use Log
Parser as a COM component in a script and process each output record individually.
Alerts by IP Address
Each IP address in the alerts report shown in Figure 5.2 is a clickable hyperlink that leads to a
detail page showing all alerts for that IP address. Using a process similar to that used previously
for the alert messages, I created a summary page (Figure 5.3), and detail pages (Figure 5.4) using
a two-pass approach. I repeated this process for both source and destination IP addresses to
pro-duce a fully interactive HTML IDS report. At this point, you can run the entire report with
these Log Parser commands:
logparser.exe file:Ch05AlertsIndex.sql i:csv iHeaderFile:AlertHeader.csv -iTsFormat:mm/dd/yy-hh:mm:ss -headerRow:off -o:tpl -tpl:Ch05Alerts-Index.tpl
logparser.exe file:Ch05AlertsDetailHeader.sql i:csv iHeaderFile:AlertHeader.csv -iTsFormat:mm/dd/yy-hh:mm:ss -headerRow:off -o:tpl -tpl:Ch05Alerts-DetailHeader.tpl logparser.exe file:Ch05AlertsDetail.sql i:csv iHeaderFile:AlertHeader.csv
-iTsFormat:mm/dd/yy-hh:mm:ss -headerRow:off -o:tpl -tpl:Ch05Alerts-Detail.tpl -fileMode:0 logparser.exe file:Ch05SrcIPIndex.sql i:csv iHeaderFile:AlertHeader.csv
-iTsFormat:mm/dd/yy-hh:mm:ss -headerRow:off -o:tpl -tpl:Ch05SrcIP-Index.tpl
logparser.exe file:Ch05SrcIPDetailHeader.sql i:csv iHeaderFile:AlertHeader.csv -iTsFormat:mm/dd/yy-hh:mm:ss -headerRow:off -o:tpl -tpl:Ch05SrcIP-DetailHeader.tpl logparser.exe file:Ch05SrcIPDetail.sql i:csv iHeaderFile:AlertHeader.csv
-iTsFormat:mm/dd/yy-hh:mm:ss -headerRow:off -o:tpl -tpl:Ch05SrcIP-Detail.tpl -fileMode:0 logparser.exe file:Ch05DstIPIndex.sql i:csv iHeaderFile:AlertHeader.csv
-iTsFormat:mm/dd/yy-hh:mm:ss -headerRow:off -o:tpl -tpl:Ch05DstIP-Index.tpl
logparser.exe file:Ch05DstIPDetailHeader.sql i:csv iHeaderFile:AlertHeader.csv -iTsFormat:mm/dd/yy-hh:mm:ss -headerRow:off -o:tpl -tpl:Ch05DstIP-DetailHeader.tpl logparser.exe file:Ch05DstIPDetail.sql i:csv iHeaderFile:AlertHeader.csv
-iTsFormat:mm/dd/yy-hh:mm:ss -headerRow:off -o:tpl -tpl:Ch05DstIP-Detail.tpl -fileMode:0
Building an Alerts Overview Report
Now that we have a detailed alerts report, we might want to build a summary index page.This
page should include links to the detailed reports and also display graphs and short summaries of
the data to get a quick overview of the network. Figure 5.5 shows the final report.
Figure 5.4 IP Address Details
Since the summary report includes only one table of data with multiple graphs, I placed the
entire HTML markup in a single template file, Ch05Summary-Index.tpl.This template creates
the HTML for the report that includes references to the individual graphs.The query for the top
alerts is similar to that used for the alerts index page, but only includes the top 10 records:
---Ch05Summary-Index.sql---SELECT TOP 10 sig_id, msg, Count(msg) as Alerts INTO report\index.html FROM alert.csv GROUP BY msg, sig_id ORDER BY Alerts DESC---Ch05Summary-Index.sql---The query for the pie graph is similar, but does not include the actual message and this time
processes all records:
---Ch05Summary-GraphTopAlerts.sql---SELECT sig_id, Count(msg) as Alerts INTO report\AlertsTopAlerts.gif FROM alert.csv GROUP BY sig_id ORDER BY Alerts DESC
---Ch05Summary-GraphTopAlerts.sql---Finally, there are three queries for the remaining graphs:
---Ch05Summary-GraphTopSrcIPs.sql---SELECT src, Count(msg) as Alerts INTO report\AlertsTopSrcIPs.gif FROM alert.csv GROUP BY srcORDER BY Alerts DESC
---Ch05Summary-GraphTopSrcIPs.sql--- ---Ch05Summary-GraphAlertsPerHour.sql---SELECt
Count(*) as Alerts
USING QUANTIZE(timestamp,360) as Hour INTO report\AlertsByHour.gif
GROUP BY Hour
---Ch05Summary-GraphAlertsPerHour.sql--- ---Ch05Summary-GraphTopDstPorts.sql---SELECT TOP 5
STRCAT(STRCAT(TO_STRING(dstport),' - '), proto) AS Destination, Count(*) as Alerts
USING dst as DestinationPort INTO report\AlertsTopDstPorts.gif FROM alert.csv
GROUP BY Destination ORDER BY Alerts DESC
---Ch05Summary-GraphTopDstPorts.sql---Finally, we can generate the entire index page with these commands:
logparser.exe file:Ch05SummaryIndex.sql i:csv iHeaderFile:AlertHeader.csv -iTsFormat:mm/dd/yy-hh:mm:ss -headerRow:off -o:tpl -tpl:Ch05Summary-Index.tpl
logparser.exe file:Ch05SummaryGraphTopAlerts.sql i:csv iHeaderFile:AlertHeader.csv iTsFormat:mm/dd/yyhh:mm:ss headerRow:off o:chart chartType:Pie3D groupSize:350x190 -values:OFF -chartTitle:"" -categories:OFF
logparser.exe file:Ch05SummaryGraphTopSrcIPs.sql i:csv iHeaderFile:AlertHeader.csv iTsFormat:mm/dd/yyhh:mm:ss headerRow:off o:chart chartType:Pie groupSize:300x150 -values:OFF -chartTitle:"" -categories:OFF
logparser.exe file:Ch05Summary-GraphAlertsPerHour.sql -i:csv -iHeaderFile:AlertHeader.csv iTsFormat:mm/dd/yyhh:mm:ss headerRow:off o:chart chartType:smoothline
-groupSize:300x150 -values:OFF -chartTitle:"" -categories:OFF
logparser.exe file:Ch05SummaryGraphTopDstPorts.sql i:csv iHeaderFile:AlertHeader.csv iTsFormat:mm/dd/yyhh:mm:ss headerRow:off o:chart chartType:BarStacked
-groupSize:300x150 -values:OFF -chartTitle:""
The final result is a fully interactive IDS report using nothing more than Log Parser.
NOTE
You can create the entire report shown here using the CreateReport.cmd batch file
included with the file download for this chapter.
Managing Snort Rules
Log Parser complements Snort with more than just reporting. Log Parser’s powerful parsing
fea-tures make it an ideal tool for managing and updating Snort rule definitions.
Snort’s intrusion detection engine is nothing more than a network sniffer.The rule
defini-tions are what give it the ability to identify attack patterns. For Snort to be most effective, you
should customize the rules for your particular environment.You should also keep it up to date
with the most recent rule definitions.
Snort uses dozens of rule files, each categorized by attack category.You might find it useful
to combine these rules into a single file for easier management. Because Log Parser can easily
read and parse all files in a directory, rule management is simple.
The following query reads all rule files in a directory and sorts them by the signature ID,
removing any duplicate rules you might have:
---Ch05RulesBySID.sql---SELECT DISTINCT
TO_INT(EXTRACT_VALUE(Params, 'sid')) AS SID, Rule USING Field1 AS Rule, REPLACE_STR(REPLACE_CHR(SUBSTR(Rule,ADD(INDEX_OF(Rule,'('),1),LAST_INDEX_OF(Rule,')')),':' ,'='),'; ','&') AS Params, INTO all.rules FROM *.rules ORDER BY SID ---Ch05RulesBySID.sql--- ---Ch05RulesBySID.tpl---<LPHEADER> #---# Snort Rules sorted by SID
# Generated %SYSTEM_TIMESTAMP% # by %USERDOMAIN%\%USERNAME% #---</LPHEADER> <LPBODY>%Rule% </LPBODY>
---Ch05RulesBySID.tpl---Run this query with the following command:
logparser file:Ch05Rulesbysid.sql i:tsv headerRow:off lineFilter:# o:tpl -tpl:Ch05RulesBySID.tpl
Note in the query that I did not use SUBSTR and INDEX_OF to extract the
sid
value,
but rather used the replace functions to make the parameters look like a URL (Uniform
Resource Locator) query string.This allows me to use the EXTRCT_VALUE functions to
easily grab any value I want from the rule. Note also that I used a template file rather than
out-putting directly to a file.This is so I can include a comment header but also because I want to
sort by SID, but not include the value in the output.You cannot sort by a field specified in the
USING clause.
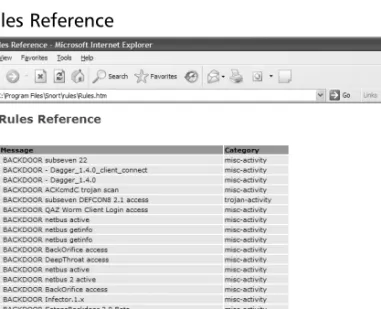
Using this same technique, you might find it useful to create a rules reference page.This
query reads all rule definitions and generates the HTML reference page shown in Figure 5.6:
---Ch05RulesRef.sql---SELECT DISTINCT
TO_INT(EXTRACT_VALUE(Params, 'sid')) AS SID,
EXTRACT_VALUE(Params, 'classtype') AS Category,
REPLACE_CHR(EXTRACT_VALUE(Params, 'msg'),'"','') AS Message, Rule USING Field1 AS Rule, REPLACE_STR(REPLACE_CHR(SUBSTR(Rule,ADD(INDEX_OF(Rule,'('),1),LAST_INDEX_OF(Rule,')')),':' ,'='),'; ','&') AS Params INTO Rules.htm FROM *.rules ORDER BY SID ---Ch05RulesRef.sql--- ---Ch05RulesRef.tpl---<LPHEADER> <html> <head>
<meta http-equiv="Content-Type" content="text/html; charset=windows-1252">
<title>Snort Rules Reference</title> <style>
<!--H1 {
font : bold 14pt Verdana, Geneva, Arial, Helvetica, sans-serif; color : #4A4322;
} TD {
COLOR: Black; FONT: 11px Verdana, arial, geneva, helvetica, sans-serif; border : 0px solid #EBE7D3;
vertical-align : top; background-color : #EBE7D3; }
TH {
COLOR: Black; FONT: 11px Verdana, arial, geneva, helvetica, sans-serif; background-color : #9F9B64; text-align : left; } --> </style> </head> <body>
<table border="0" width="75%" cellspacing="2"> <tr> <th><b>Signature</b></th> <th><b>Message</b></th> <th><b>Category</b></th> </tr> </LPHEADER> <LPBODY> <tr> <td><a href=http://www.snort.org/snort-db/sid.html?sid=%SID%> %SID%</a></td> <td> %Message%</td> <td>%Category%</td> </tr> </LPBODY> <LPFOOTER> </table> </p> </body> </html> </LPFOOTER>
---Ch05RulesRef.tpl---Run this query with the following command:
logparser file:ch05RulesRef.sql i:tsv headerRow:off lineFilter:# o:tpl -tpl:Ch05RulesRef.tpl
Log Parser has a powerful feature that allows you to parse files directly from a URL.You can
use this feature to download new Snort rule definitions.The following command downloads the
newest Bleeding Snort rules from www.bleedingsnort.com.
logparser "SELECT Field1 INTO bleeding.rules FROM http://www.bleedingsnort.com/bleeding-all.rules" -i:tsv -headerRow:off -o:tsv -headers:off
Of course, once you download the rules, you can merge and sort them as shown previously
in this chapter.
Final Touches
As you can see, Log Parser is a powerful addition to Snort, both for reporting and for rules
man-agement. In very little time and using nothing more than Log Parser itself, you can create
elabo-rate interactive HTML reports to view and drill down through thousands of IDS alerts. With
Log Parser’s charting features, you can view the data from different angles to help identify high
priority alerts.