UNIVERSITY OF READING
Department of Geography & Environmental Science
Extending the predictability of flood
hazard at the global scale
Rebecca Elizabeth Emerton
A thesis submitted for the degree of Doctor of Philosophy
November 2018
i
I confirm that this is my own work and the use of all material from other sources has been properly and fully acknowledged.
ii
Flooding has the highest frequency of occurrence of all types of disaster arising from natural hazards across the globe. The anticipation and forecasting of floods is a key component in managing, preparing for and mitigating the effects of severe events, from local to international scales. This research aims to explore ways to extend the predictability of flood hazard at the global scale and provide earlier indications of potential flood events.
Two approaches for predicting river flow extremes on seasonal timescales are developed and tested; statistical forecasts based on the known influence of El Niño and La Niña on river flow and flooding at the global scale, and dynamical forecasts using numerical weather prediction systems. The statistical forecast development has shown that the likelihood of increased or decreased flood hazard during El Niño and La Niña events is much more complex than is often perceived and reported. The dynamical forecasts are shown to be more skilful than a long-term average climatology in many rivers worldwide, up to four months in advance in some cases. These approaches both have the potential to provide early warning information, and to support El Niño preparedness activities. As such, a comparison of the ability of the two forecasts to predict hydrological extremes during El Niño is undertaken, highlighting regions of the globe where each forecast is (or is not) skilful compared to a forecast of climatology, and the advantages and disadvantages of each approach.
Both of these new seasonal hydro-meteorological forecasts are openly available, with the dynamical forecasts produced operationally as part of the Global Flood Awareness System (GloFAS-Seasonal), supported by the Copernicus Emergency Management Service. This research has provided a step change in moving from forecasts that were previously only available for precipitation, to global-scale forecasts of hydrological variables at extended lead-times.
iii
I would first and foremost like to thank my supervisors, Hannah Cloke and Liz Stephens. I could not have wished for better mentors, and will be forever grateful for their advice, support, guidance and encouragement throughout my PhD. Thank you for the knowledge you’ve shared
with me, for encouraging me to “be brave”, and for all the fantastic opportunities (including letting me attend conferences often and in incredible places!) I’ve had these past four years. Further thanks go to Florian Pappenberger, to whom I am grateful for many inspiring discussions of hydro-meteorology, and for his role in my collaboration with ECMWF, including the opportunity to suspend my studies and work in the Forecast Department for several months. Without the provision of data and computing facilities by ECMWF and the support of various colleagues, much of this research would not have been possible. In particular, I would like to thank Ervin Zsoter for his time and patience in teaching me how to use GloFAS and the ECMWF computing systems, and for providing me with more data than I often knew what to do with.
I would also like to thank my friends and colleagues in the Water@Reading research group and the Environmental Forecasts team at ECMWF, for providing equal amounts of support and fun over the past four years, and the HEPEX community, for making me feel welcome no matter where in the world I was. Thanks also go to Andrew Wade, for ensuring I was always on track and thinking about the bigger picture, to Steve Woolnough, for his advice on the meteorological aspects of this thesis, and to my examiners, Guy Schumann and Andy Turner, for the enjoyable discussions during my viva.
I am incredibly grateful to my parents, Joanne and Simon, for always encouraging me to pursue my passion for all things related to severe weather, and for supporting me throughout my studies. I am also grateful to all the friends and family who have listened to me talk about natural hazards and forecasts for years without complaint (well, for the most part!), and in particular to Louise and my sister Hannah, whose help in various forms, be it fixing code or calming nerves or laughing over a bottle of wine, has helped make my PhD an enjoyable endeavour. Finally, a huge thank you goes to my other half, Toby, for his unwavering support and encouragement, for exploring the world with me one conference at a time, and for successfully ensuring that my work-life balance never suffered during my studies.
iv 5 5 6 7 9 10 12 12 13 16 19 24 28 29 31 34 34 35 36 36 37 Declaration Abstract Acknowledgements Contents 1 Introduction
1.1 Motivation and Aims 1.2 Structure of the Thesis
2 The Current State of Large Scale Flood Forecasting
Abstract
2.1 Introduction
2.2 Advances in the Science and Techniques of Global Forecasting
2.2.1 The Increasing Skill of Precipitation Forecasts
2.2.2 Ensemble Flood Forecasting – Representing Uncertainty
2.2.3 Operational Large Scale Flood Forecasting
2.3 Continental Scale Flood Forecasting Systems
2.3.1 The European Flood Awareness System
2.3.2 The European Hydrological Predictions for the Environment Model
2.3.3 The Australian Flood Forecasting and Warning Service
2.3.4 The U.S. Hydrologic Ensemble Forecast Service
2.4 Global Scale Flood Forecasting Systems
2.4.1 The Global Flood Awareness System
2.4.2 The Global Flood Forecasting Information System
2.5 The Grand Challenges of Global Scale Flood Forecasting
2.5.1 Current Capabilities
2.5.2 Improving Data Availability
2.5.3 Model Paramaterisation
2.5.4 Improving Precipitation and Evaporation Forecasts
2.5.5 Incorporating Anthropogenic Influences
i ii iii iv 1 1 3
v 39 40 40 41 41 42 43 43 44 45 45 46 47 49 52 52 55 55 56 58 58 60 60 61 63 63 65 65 65
2.5.8 Forecast Evaluation and Intercomparison
2.6 The Future of Global Scale Flood Forecasting
2.6.1 Adaptive Modelling Strategies
2.6.2 Extended-Range Forecasting
2.6.3 Flash Flood Forecasting
2.6.4 Grand Ensemble Techniques
2.6.5 New Data Possibilities
2.7 Conclusions
Acknowledgements
3 El Niño Southern Oscillation 3.1 Introduction
3.2 ENSO Dynamics 3.3 ENSO Diversity
3.4 Influence on Weather and Climate 3.5 Influence on River Flow and Flooding
3.6 Predictability of River Flow and Flood Hazard
4 Complex Picture for Likelihood of ENSO-Driven Flood Hazard
Abstract
4.1 Introduction 4.2 Results
4.2.1 Historical Probabilities During El Niño
4.2.2 Evaluating the Uncertainty
4.2.3 Importance of the Hydrology
4.2.4 Historical Probabilities During La Niña
4.2.5 Maximum Probabilities During El Niño / La Niña
4.2.6 Comparison with Observations
4.3 Conclusions 4.4 Methods
vi 68 68 68 70 70 70 81 81 82 84 84 85 85 86 87 87 89 92 92 93 93 94 94 95 96 98 100 104 107
4.4.4 Difference Between River Flow and Precipitation
4.4.5 Comparison with Observations – Precipitation
4.4.6 Comparison with Observations – River Discharge
Data Availability Acknowledgements
4.5 Supplementary Figures
5 Developing a Global Operational Seasonal Hydro-Meteorological Forecasting System
Abstract
5.1 Introduction 5.2 Implementation
5.2.1 ECMWF High Performance Computing Facility
5.2.2 Hydro-Meteorological Components
5.2.2.1 Meteorological Forcing
5.2.2.2 Land Surface Component
5.2.2.3 River Routing Model
5.2.2.4 Generation of Reforecasts and Reference Climatology
5.2.3 GloFAS-Seasonal Computational Framework
5.2.4 GloFAS Web Interface
5.2.4.1 MapServer
5.2.4.2 GloFAS Web Map Service Time
5.2.4.3 Forecast Viewer
5.3 Forecast Products
5.3.1 Basin Overview Layer
5.3.2 River Network Layer
5.3.3 Reporting Points Layer
5.4 Forecast Evaluation
5.4.1 Potential Usefulness
5.4.2 Reliability
vii 111 111 112 123 123 124 125 125 127 127 129 129 130 130 132 133 134 138 139 140 145 146 146 147 148 149 151 154 Data Availability Acknowledgements 5.6 Supplementary Figures
6 What is the Most Useful Approach for Forecasting Hydrological Extremes During El Niño?
Abstract
6.1 Introduction
6.2 Forecasting Approaches
6.2.1 Dynamical Approach: GloFAS-Seasonal
6.2.2 Statistical Approach: Historical Probabilities
6.3 Evaluation Data and Methods
6.3.1 Observed Data
6.3.2 Calculating Potential Usefulness of GloFAS-Seasonal
6.3.3 Calculating Potential Usefulness of the Historical Probabilities
6.4 Results
6.4.1 Probability of High Flow
6.4.2 Probability of Low Flow
6.4.3 Discussion 6.5 Conclusions Acknowledgements 6.6 Supplementary Figures 7 Conclusions 7.1 Key Conclusions
7.1.1 Objective 1: Historical Probabilities of ENSO-Driven Flood Hazard
7.1.2 Objective 2: Seasonal Hydro-Meteorological Forecasts Using GloFAS
7.1.3 Objective 3: Which Approach is More Useful?
7.2 Scientific Advances
7.3 Reflections and Next Steps 7.4 Closing Remarks
viii 175 177 207 219 241 261 287 Appendix
A1: Continental and global scale flood forecasting systems
A2: Complex picture for likelihood of ENSO-driven flood hazard A3: Developing a global operational seasonal hydro-meteorological forecasting system: GloFAS-Seasonal v1.0
A4: Building a multi-model flood prediction system with the TIGGE archive A5: Can seasonal hydrological forecasts inform local decisions and actions? An “in-the-moment” decision-making activity
Chapter 1. Introduction
Chapter 1
Introduction
1.1
Motivation and Aims
Flooding has the highest frequency of occurrence of all types of disaster arising from natural hazards across the globe, accounting for 39% of all “natural disasters” since the year 2000 (Guha-Sapir et al., 2018). Floods can be caused by a variety of natural processes, and affect millions of people every year through displacement from homes, unsafe drinking water (sometimes leading to disease), destruction of infrastructure, and injury and loss of life. In 2017 alone, >57 million people were affected worldwide by the >120 disasters resulting from floods (Guha-Sapir et al., 2018). With an increasing global population and increasing populations living in flood-prone areas, the anticipation and forecasting of floods is a key component in managing, preparing for and mitigating the effects of severe events, from local to international scales. Global overviews of upcoming flood events provide valuable information for organisations working at the global scale, across a range of water-related sectors from agriculture to humanitarian aid. Producing forecasts at the global scale has only become possible in recent years, due to the integration of meteorological and hydrological modelling capabilities, improvements in data, satellite observations and land-surface hydrology modelling, and increased resources and computer power (Alfieri et al., 2012, 2013; Bierkens, 2015; Brown et al., 2012; ECMWF, 2018a). While several forecasting centres produce operational forecasts1 of
floods in the medium-range, that is, up to ~2 weeks ahead, earlier indications of potential flood events, many weeks or even months in advance, could provide crucial information for flood preparedness and disaster risk reduction. Indeed, the World Meteorological Organization (WMO, 2017) states that economic losses due to severe hydrometeorological events have increased, over the past fifty years, nearly 50 times, but that loss of life has decreased by a factor of 103. This significant decrease in loss of life is attributed to improved monitoring and
forecasting of floods alongside more effective preparation and planning.
The aim of this research is to explore ways to extend the predictability of flood hazard at the global scale and provide earlier indications of potential flood events. Predictability is defined as
1 The term operational here refers to real-time forecasts produced by a forecasting centre, that are a 24/7 supported service ensuring timely dissemination and ongoing provision of forecasts.
Chapter 1. Introduction
“the extent to which future states of a system may be predicted based on knowledge of current and past states of the system”; in other words, predictability is the degree to which a prediction can be made, qualitatively or quantitatively, or the longest achievable lead time for a forecast. (AMS, 2012). Broadly speaking, there are two key ways in which the inherent predictability of the atmosphere and land surface can be used to provide early warning information:
• Statistical analysis based on large-scale climate variability and teleconnections • Seasonal forecasting using coupled ocean-atmosphere general circulation models2
While both of these have been studied and/or implemented for meteorological variables, forecasts of hydrological variables are often not considered or provided, particularly for large or global scales. For example, information on the likelihood of extreme precipitation driven by large-scale modes of climate variability is readily available, and is often used as a proxy for flooding due to the absence of the equivalent information for river flow. Additionally, while seasonal forecasts of meteorological variables including precipitation are produced at many operational forecasting centres, no such forecasts are available for river flow at the global scale. However, recent research has shown that the link between precipitation and flood magnitude is nonlinear (Stephens et al., 2015), and as such, precipitation may not be the best indicator of potential flood hazard (Coughlan de Perez et al., 2017). This thesis aims to combine both meteorological and hydrological aspects of flood predictability and forecasting, in order to explore both of the aforementioned avenues for extending flood predictability. This is done through the following specific objectives:
1. Analyse the link between El Niño Southern Oscillation (ENSO), the most dominant mode of large-scale climate variability, and river flow across the globe, using historical events to answer the question “what is the likelihood of flooding during El Niño?”. 2. Develop and test seasonal forecasts of flood hazard for the global river network, by
driving the hydrological component of the Global Flood Awareness System (GloFAS) with seasonal meteorological forecasts from the European Centre for Medium-Range Weather Forecasts’ (ECMWF) coupled ocean-atmosphere general circulation model.
2 It is noted that coupled ocean-atmosphere GCMs here refer to the dynamical models used to produce seasonal forecasts. In hydrology, this is often also referred to as numerical weather prediction (NWP), however NWP traditionally refers to atmosphere-only models used to produce short-range (up to 5 days ahead) weather forecasts that are not suitable for forecasting on seasonal timescales.
Chapter 1. Introduction
3. Assess the potential usefulness of both the statistical (1) and dynamical (2) approaches to extending flood predictability and providing early indications of flood hazard at the global scale, for decision-making purposes.
The results presented in this thesis will provide a hydrologically relevant, global scale analysis of flood hazard predictability, alongside providing the equivalent information for hydrological variables that exists for meteorology. This information has the potential to be used to inform decision-making across a range of water-related sectors, and aid flood preparedness and disaster risk reduction efforts.
1.2
Structure of the Thesis
This thesis is structured around four papers. To begin with, Chapter 2, the first paper presented in this thesis, provides a detailed overview of the current state of large-scale flood forecasting. Six operational large-scale flood forecasting systems are reviewed, and the challenges and future advances in global scale flood forecasting are discussed, including the possibility of extended-range forecasting out to seasonal timescales. Chapter 3 provides further background material relating to ENSO and its influence on weather and climate, including river flow, to support the introductory literature presented in Chapter 4.
Chapter 4 is the second of the papers presented in this thesis, addressing the first objective by using a new 110-year model reconstruction of river flow to evaluate the link between ENSO and river flow, and map the likelihood of increased or decreased flood hazard during El Niño and La Niña events.
The second objective of this thesis is addressed in Chapter 5, which presents the third paper. Chapter 5 introduces GloFAS-Seasonal, the first global scale seasonal hydro-meteorological forecasting system designed to provide early indications of high and low river flow for the global river network. GloFAS-Seasonal was developed and implemented operationally as part of this research. The paper provides technical detail regarding the development of the system, information on the forecast products available, and an initial evaluation of the skill of the forecasting system.
Chapter 6 works towards the third objective of this thesis, evaluating the potential usefulness of both the statistically-based historical probabilities of ENSO-driven flood hazard presented in Chapter 4, and the resource-intensive GloFAS-Seasonal forecasting system presented in
Chapter 1. Introduction
Chapter 5. This fourth paper uses river flow observations to assess and compare the ability of the two forecasts to predict high and low river flow during El Niño.
Chapter 7 summarises the findings and wider contribution of this thesis and outlines scope for further work.
The four papers presented in this thesis have been reformatted as chapters, and have not been modified. The published versions of Chapters 2, 4 and 5 are provided in the Appendix, alongside further co-authored publications related to this work. Chapter 6 was still in press at the time of completing this thesis. Author contribution statements are provided at the beginning of each relevant chapter.
Chapter 2. The current state of large scale flood forecasting
Chapter 2
The Current State of Large Scale
Flood Forecasting
This chapter has been published as a review paper in Wiley Interdisciplinary Reviews (WIREs) Water with the following reference:
Emerton, R. E., E. M. Stephens, F. Pappenberger, T. C. Pagano, A. H. Weerts, A. W. Wood, P. Salamon, J. D. Brown, N. Hjerdt, C. Donnelly, C. A. Baugh and H. L. Cloke, 2016: Continental and Global Scale Flood Forecasting Systems, WIREs Water, 3 (3), 391-418, doi:10.1002/wat2.1137*
The contributions of the authors of this paper are as follows: R.E.E. conducted the literature review and wrote the paper with guidance from H.L.C., E.M.S. and F.P., with the exception of parts of section 2.3.4, written by A.W.W., and section 2.6.3, written by C.A.B. Section 2.5 was written in collaboration with F.P. Further information beyond that which was documented in the literature was provided by P.S. (EFAS & GloFAS), T.C.P. (BoM FFWS), A.H.W. (GLOFFIS), A.W.W. and J.D.B. (U.S. HEFS), N.H. and C.D. (E-HYPE). All authors commented on the manuscript. Overall, 80% of the writing was undertaken by R.E.E.
Abstract. Floods are the most frequent of natural disasters, affecting millions of people across the globe every year. The anticipation and forecasting of floods at the global scale is crucial to preparing for severe events and providing early awareness where local flood models and warning services may not exist. As numerical weather prediction models continue to improve, operational centres are increasingly using the meteorological output from these to drive hydrological models, creating hydro-meteorological systems capable of forecasting river flow and flood events at much longer lead times than has previously been possible. Furthermore, developments in, for example, modelling capabilities, data and resources in recent years have made it possible to produce global scale flood forecasting systems. In this paper, the current state of operational large scale flood forecasting is discussed, including probabilistic forecasting of floods using ensemble prediction systems. Six state-of-the-art operational large scale flood
* ©2016. The Authors. WIREs Water published by John Wiley & Sons. This is an open access article under the
terms of the Creative Commons Attribution License, which permits use, distribution and reproduction in any medium, provided that the original work is properly cited.
Chapter 2. The current state of large scale flood forecasting
forecasting systems are reviewed, describing similarities and differences in their approaches to forecasting floods at the global and continental scale. Currently, operational systems have the capability to produce coarse-scale discharge forecasts in the medium-range and disseminate forecasts and, in some cases, early warning products, in real time across the globe, in support of national forecasting capabilities. With improvements in seasonal weather forecasting, future advances may include more seamless hydrological forecasting at the global scale, alongside a move towards multi-model forecasts and grand ensemble techniques, responding to the requirement of developing multi-hazard early warning systems for disaster risk reduction.
2.1 Introduction
Flooding has the highest frequency of occurrence of all types of natural disaster across the globe, accounting for 39% of all natural disasters since 2000, with >94 million people affected by floods each year worldwide (Guha-Sapir et al., 2018) through displacement from homes, unsafe drinking water, destruction of infrastructure, injury and loss of life. With an increasing population living in flood-prone areas, the forecasting of floods is key to managing and preparing for imminent disaster.
Investment in building resilience is prioritised in the Sendai Framework for Disaster Risk Reduction (DRR) 2015-2030 (UNISDR, 2015), with one component of this being the development and use of multi-hazard early warning systems (WMO, 2017).The World Meteorological Organization (WMO) states that economic losses due to severe hydro-meteorological events have increased, over the past fifty years, nearly 50 times. However, the loss of life globally has decreased by a factor of 103.This significant decrease in loss of life
is attributed to improved monitoring and forecasting of hydro-meteorological events alongside more effective preparation and planning. Four components are suggested by the WMO (WMO, 2017) for effective early warning systems; detection, monitoring and forecasting hazards, analyses of risks involved, dissemination of timely warnings and activation of emergency plans to prepare and respond.
The development of forecasting systems producing forecasts and warnings of severe hazards such as floods, droughts, storms, fires and tropical cyclones on a global scale are critical for disaster risk reduction and further decreases in loss of life. The Sendai Framework for Disaster Risk Reduction 2015-2030 (UNISDR, 2015)states that at global and regional levels it is important to “promote co-operation between academic, scientific and research entities and networks and the private sector to develop new products and services to help reduce
Chapter 2. The current state of large scale flood forecasting
disaster risk, in particular those that would assist developing countries and their specific challenges”,and forecasting systems such as those discussed here are essential in achieving this, particularly in providing forecasts for countries and regions where no other forecasts and early warnings are available.
The need for large scale flood forecasting systems can be broken down into three key factors:
i) To provide information on floodiness (Stephens et al., 2015) across areas larger than a catchment, for example to indicate where flooding during the rainy season will be worse than normal; information that is of high importance to humanitarian organisations (Braman et al., 2013).
ii) To provide forecasts in basins across the globe where currently there are no forecasts available, which is not a massive scale-up of resources. Large-scale forecasting is therefore cost-effective compared to focussing on developing and providing hydro-meteorological forecasts for single catchments, and greatly aids disaster risk reduction and flood early warning efforts globally.
iii) To support existing capabilities, for example by using ensemble forecasting techniques to enable probabilistic flood forecasts, or at longer lead-times for earlier warnings. Probabilistic and extended-range forecasting is computationally expensive, and in addition, many countries do not currently pay for access to these distributed meteorological forecast products and therefore are unable to produce any form of hydro-meteorological forecast.
This review outlines the developments which have led to forecasting floods on the global scale, the current state-of-the-art in operational large-scale (continental and global) flood forecasting, and future developments in global scale flood forecasting and early warning.
2.2 Advances in the Science and Techniques of Global Forecasting
Producing forecasts at the global scale has only become possible in recent years, due to the integration of meteorological and hydrological modelling capabilities, improvements in data, satellite observations and land-surface hydrology modelling, and increased resources and computer power (Alfieri et al., 2012, 2013; Bierkens, 2015; Brown et al., 2012; ECMWF, 2018a). While several meteorological and hydrological forecasting centres now run operational flood forecasting models, many of these are for specific locations, river basins or countries (Alfieri etChapter 2. The current state of large scale flood forecasting
al., 2012).
Table 1: Technical details of quantitative precipitation forecasts used in large-scale flood forecasting (adapted from Alfieri et al., 2012).
Global hydrological modelling is complex due to the geographical variation of rainfall-runoff processes and river regimes (Pappenberger et al., 2010), but large scale flood forecasting systems are now emerging with recent scientific and technological advances and increasing integration of hydrological and meteorological communities, allowing for uncertainty to be cascaded from the meteorological input to the river flow forecasts (Ramos et al., 2010).
Product Type Spatial Extent Spatial Resolution Temporal Resolution Forecast Range Ocean-Atmosphere Coupling Uncertainty Radar Nowcasting ~10,000 - 50,000km2 1-4km 5-60min 1-6h No Low High Ensemble Radar Nowcasting ~10,000 - 50,000km2 1-4km 5-60min 1-6h No Radar-NWP
Blending Regional ~2km 15-60min ~6h No
Limited-Area NWP
Regional -
Continental 2-25km 1-6h 1-3 days Varies
Ensemble Limited-Area
NWP
Regional -
Continental 2-25km 3-6h ~5-30 days Varies
Global NWP Global ~15-100km ~3-6h ~5-30 days Varies
Sub-seasonal to Seasonal Forecasts
Continental -
Global ~25-100km ~3-24h ~15-60 days Yes
Seasonal
Chapter 2. The current state of large scale flood forecasting
In this section we analyse the key advances that have enabled the forecasting of floods at the global scale.
2.2.1 The Increasing Skill of Precipitation Forecasts
The skill of precipitation forecasts in global NWP models has increased significantly in recent years (Liu et al., 2013; Mittermaier et al., 2013; Novak et al., 2014) (e.g., gaining ~2days precipitation skill since 2000 (Richardson et al., 2012)). With skilful medium-range quantitative precipitation forecasts (QPFs) being produced by NWP models across the globe, it has become possible to produce skilful forecasts of river flow and flooding at large scales for the purpose of early warning (Bartholmes and Todini, 2005). While there exist many different definitions of a skilful forecast, this typically refers to correlation of the forecast with observations out to a certain lead time. Table 1 outlines the resolutions and forecast ranges of some of the main QPF products used in operational large-scale flood forecasting systems (Alfieri et al., 2012). Precipitation is challenging to forecast due to the chaotic nature of the atmosphere (Lorenz, 1969); whereby a small change in the initial conditions of the system can result in an unpredictable outcome. The underlying physical processes of precipitation generation are complex to model, and modelling deficiencies can lead to forecast inaccuracies, particularly at longer lead times (Cuo et al., 2011). In general, due to lack of observations, precipitation predictions are less skilful in the southern hemisphere, although the difference in the skill of forecasts between the hemispheres has reduced significantly since the introduction of satellite observations and data assimilation (Cuo et al., 2011; Simmons and Hollingsworth, 2002). Limited data are also an issue in much of the tropics, alongside difficulties associated with the simulation of convective precipitation (Krishnamurti et al., 1999). While QPF skill depends heavily on the region, season, intensity and storm type (Cuo et al., 2011), precipitation skill is generally good for rainfall generated by synoptic scale frontal weather systems (Olson et al., 1995). The intensity of precipitation tends to be one of the major problems in QPFs, with convective (Krishnamurti et al., 1999) and orographic enhancement (Arduino et al., 2005) processes tending to result in an under-prediction of intensity, alongside the tendency of most global models to over-predict the intensity of light precipitation (Haiden et al., 2014). Many NWP models struggle with displacement (Cuo et al., 2011; Ebert and McBride, 2000); while the areal extent, timing and intensity of precipitation may be correct, precipitation displacement can be extremely detrimental to forecasts of river flow and flooding.
With ongoing improvements to NWP models (resolution increases, new methods of simulating the physical processes and increasing computer power), (Mittermaier et al., 2013; Novak et al.,
Chapter 2. The current state of large scale flood forecasting
2014; Richardson et al., 2012; Tang et al., 2013), alongside developments in model interoperability services, cloud services, and open data and models, precipitation forecasts have become more useful to hydrological applications.
2.2.2 Ensemble Flood Forecasting – Representing Uncertainty
Over the past two decades, NWP has moved from single-solution forecasts of the future state of the atmosphere, to probabilistic forecasts using ensemble prediction systems (EPS; Cloke and Pappenberger, 2009). Probabilistic forecasts allow the inherent uncertainties in NWP to be represented (Demeritt et al., 2007; Liu et al., 2013). In hydrological modelling, the four main sources of uncertainty are input data, evaluation data, model structure and model parameters (Kauffeldt, 2014; Pagano et al., 2013; Shaw et al., 2011; Wood and Lettenmaier, 2008). The relative importance of these uncertainties tends to vary according to catchment characteristics, event magnitude and lead time of the forecast (Cloke and Pappenberger, 2009; Ramos et al., 2010), but it is generally accepted that the greatest uncertainty in flood forecasting beyond 2-3 days lead time stems from the meteorological input (Cloke and Pappenberger, 2009; Kauffeldt, 2014).
The standard approach in NWP is to produce a single (deterministic) forecast from the initial state, whereas EPS recognise and represent the uncertainty in the initial conditions by perturbing them to produce several initial states (Buizza et al., 2005; Leutbecher and Palmer, 2008). The forecast model is run from each of the perturbed initial states, producing many varying, but valid and equally probable, forecast scenarios. In addition to sampling the error in the initial state, many centres also incorporate stochastic physics, which involves applying random perturbations of the parameterised physical processes (Buizza et al., 2007).
Predictions of river discharge are usually produced by providing the EPS as input to a hydrological model (Clark and Hay, 2004; Cloke et al., 2013b; Cloke and Pappenberger, 2009; Pagano et al., 2013). Prior to this, some pre-processing may be required (Cloke et al., 2013b; Pagano et al., 2013); scale corrections (downscaling or disaggregating) are made, as due to the irregular shape of catchments, the scale (temporal and spatial) does not usually correspond between the EPS and the hydrological model (Liu et al., 2013). Bias or spread corrections may also need to be made (Cloke and Pappenberger, 2009).
The use of EPS in flood forecasting allows probabilistic forecasts of flood events at much longer lead times than has previously been possible, and is useful in producing forecasts in catchments
Chapter 2. The current state of large scale flood forecasting
Table 2: Operational large-scale flood forecasting systems.
Forecasting System EFAS (European Flood Awareness System) E-HYPE (European Hydrological Predictions for the Environment) FFWS (Flood Forecasting & Warning Service) HEFS (Hydrologic Ensemble Forecast Service) GloFAS (Global Flood Awareness System) GLOFFIS (Global Flood Forecasting Information System)
Domain Continental (Europe) Continental (Europe) Continental (Australia) Continental (USA) Global Global
No. Ensemble Members 65 1 ≤4 23 Short to Medium Range, 1 Long Range 51 73 Forecast Range
(Days) 15 10 10 Sub-Hourly to Several Years 45 15
Spatial
Resolution 5km, Regular Grid
~15km, Irregular Grid,
Varies by Basin ~10km Varies by Basin
10km, Regular
Grid 10km, 50km, Regular Grid
Forecast
Frequency 12-Hourly Daily
6-Hourly to 12-Hourly
Sub-Daily to
Daily Daily 6-Hourly
NWP Input ECMWF ENS, ECMWF Deterministic, DWD Deterministic, COSMO- LEPS ECMWF Deterministic BoM ACCESS Global, Regional, City-Scale and Relocatable Deterministic Forecasts RFC Deterministic, WPC Deterministic, GEFS, CFS, Historical Observations ECMWF ENS ECMWF ENS, GEFS, GFS, Historical Forcing Rainfall-Runoff
Model Lisflood Europe HYPE
GR4J (Daily), GR4H (Hourly),
URBS
Suite of Models
(see Figure 8) HTESSEL
PCR-GLOBWB,
W3RA
Routing Model Lisflood Europe HYPE Muskingum Channel Routing
Suite of Models
(see Figure 8) Lisflood Global Deltares wflow
River Network JRC Dataset HydroSHEDS, HYDRO1K Catchment-SIM Suite of Models (see Figure 8) HydroSHEDS, HYDRO1K
PCR-GLOBWB, SRTM90m, HydroSHEDS
Organisation JRC, ECMWF SMHI BoM National Weather
Service JRC, ECMWF Deltares
Website www.efas.eu e-hypeweb. smhi.se
www.bom.go v.au/ water/floods water.weather.g ov/ahps/foreca sts.php www.globalfloo ds.eu Corresponding Figure Number 2 5 6 8 10 12
Chapter 2. The current state of large scale flood forecasting
where no other input data is available. Cloke and Pappenberger (2009) give a detailed review of the benefits of ensemble over deterministic flood forecasts, particularly looking at advantages for issuing flood alerts and warnings. Probabilistic forecasts of upcoming events have been shown to provide greater skill than deterministic forecasts (Stephens and Cloke, 2014), and provide key information about the possibility of occurrence of an extreme event.
2.2.3 Operational Large Scale Flood Forecasting
There exist various large-scale hydrological models run by communities around the globe; Bierkens et al. (2015) give a detailed overview of the properties of 14 global scale and 4 continental scale models. Not all of these models are used operationally for the purpose of flood forecasting, and as such, a list of operational continental and global scale flood forecasting models, alongside key system information, is provided in table 2.
Figure 1 shows a simplified conceptual model for a large-scale flood forecasting system: the components required and the output generated within each component. The operational systems outlined in table 2 are the focus of this review, and each takes a different approach to the components of the conceptual model. In the following sections we benchmark the state of current science and technology in undertaking operational continental and global scale flood forecasting and early warning.
Figure 1: A conceptual large-scale hydro-meteorological flood forecasting system.
2.3 Continental Scale Flood Forecasting Systems
There are currently four operational continental scale flood forecasting systems, two for Europe; the European Flood Awareness System (EFAS) of the European Commission (EC), and the European HYdrological Predictions for the Environment (E-HYPE) model of
Chapter 2. The current state of large scale flood forecasting
the Swedish Meteorological and Hydrological Institute (SMHI). The Bureau of Meteorology (BoM) run the Flood Forecasting and Warning Service (FFWS) for Australia, and the U.S. National Weather Service (NWS) run a model covering the Continental USA; the Hydrologic Ensemble Forecasting Service (HEFS). This section outlines the components of, and the forecast products produced by, each system.
2.3.1 The European Flood Awareness System
EFAS is an EC initiative developed by the Joint Research Centre (JRC) to increase preparedness for riverine floods across Europe. It was in development from 2002, tested from 2005-2010, and has been operational since 2012. After devastating, widespread flooding on the Elbe and Danube rivers in 2002, the EC began development of EFAS, with the aim of providing transnational, harmonised early warnings of flood events and hydrological information to national agencies, complementing local services (Thielen et al., 2009). Various consortia execute different aspects (e.g. computation and dissemination) of the EFAS operational suite.
Figure 2: Components of the European Flood Awareness System (EFAS).
Model Components
Rather than using just one meteorological NWP forecast as input, EFAS uses four different forecasts; two ensemble forecasts and two deterministic. Figure 2 details the various
Chapter 2. The current state of large scale flood forecasting
components of the EFAS suite, including key information regarding the NWP models. The precipitation, temperature and evaporation from each of the four forecasts are used as input to the Lisflood hydrological model, which is used as both the rainfall-runoff and the routing components shown in figure 1, and simulates canopy, surface and sub-surface processes such as snowmelt (including accounting for accelerated snowmelt during rainfall) and preferential (macropore) flow, soil and groundwater processes (Thielen et al., 2009).
Simulated ensemble hydrographs are produced by Lisflood, however these alone do not constitute a flood forecast; a decision-making element needs to be incorporated (Thielen et al., 2009). Due to the often limited number of discharge observations in many areas of the globe, these critical thresholds cannot be derived directly from observations. As such, meteorological data are run through Lisflood to calculate a 22-year timeseries of discharge, to provide a reference threshold for minor or major flooding at each grid cell.
Figure 3: The European Flood Awareness System (EFAS) showing (a) the main interface with high (red) and medium (yellow) reporting points, flood alerts (warning triangles) and probability (% likelihood) of exceeding 50mm of precipitation (green shading) during the forecast period (10 days), (inset a) the flood alert displayed when the alert point is clicked on, (b) the return period hydrograph with return period thresholds (1.5 years green, 2 years yellow, 5 years red, 20 years purple), (c) upstream snow melt forecast, (d) upstream precipitation forecast.
Forecast Visualisation
Alongside warnings for each forecast point, the EFAS interface (e.g. figure 3) provides ensemble hydrographs, which allow interpretation of the spread of the ensemble and the uncertainty in the forecast. Persistence diagrams showing information about the previous
Chapter 2. The current state of large scale flood forecasting
four forecasts also give the user additional information on the forecast uncertainty, as NWP models should be able to pick up large scale synoptic weather systems which typically produce severe events, in advance, therefore showing a flood risk consistently in each forecast run (Thielen et al., 2009).The EFAS interface provides a map of Europe, with all points forecasting a flood event designated by a colour responding to the warning threshold; this allows an overview of forecast flood events across the continent. The information and visualisation within EFAS are designed to give clear, concise and unambiguous early warning results. Warning Dissemination
Copernicus is the European Emergency Management Service, and EFAS is the operational flood early warning system designed to disseminate warnings for Europe under the Copernicus initiative. According to the World Meteorological Organization Executive Council (EC-LVII-Annex VII; WMO, 2005), National Meteorological and Hydrological Services (NMHS) constitute the single authoritative voice on weather warnings in their respective countries. Therefore, in order to respect the single voice principle also with regard to floods, EFAS real-time information is provided only to hydro-meteorological authorities signing a “Condition of Access” document.
Box 1: Example of an operational EFAS flood alert, sent to EFAS partners and national and regional services on 25th June 2015 via the EFAS dissemination centre (the Swedish Meteorological and
Hydrological Institute, SMHI).
EFAS FLOOD ALERT REPORT
Dear Partner,
EFAS predicts a high probability of flooding for Norway - Otta and Lagen-Mjosa tributaries (Glomma basin) from Monday 29th June onwards.
According to the latest forecasts (2015-06-25 12 UTC) up to 100% EPS (VAREPS) are exceeding the high threshold (>5 year simulated return period) and up to 86% EPS (VAREPS) exceeding the severe threshold (>20 year simulated return period).
Compared to the VAREPS mean, the ECMWF deterministic forecast is comparable and the DWD deterministic forecast is lower.
The earliest flood peak is expected for Saturday 4th of July 2015.
Chapter 2. The current state of large scale flood forecasting
EFAS sends warning emails to these national authorities responsible for flood forecasting, designed to bring awareness of an upcoming flood event, with further details accessed through the interface. There are four types of warning emails provided; Flood Alerts are issued when a river basin has a probability of exceeding critical flood thresholds more than 2 days ahead,
Flood Watches are issued when there is a probability of a river basin exceeding critical
thresholds but the event does not satisfy the conditions for a Flood Alert (such as river basin size or warning lead time), and Flash Flood Watches are issued when there is a probability >60% of exceeding the flash flood high alert threshold. An example of an EFAS Flood
Alert is given in Box 1. The 2 day lead time criteria is specified as the forecasting systems used
by the national authorities have usually issued a national warning with a lead time of up to 2 days. Additionally, daily overviews are sent to the Emergency Response Coordination Centre (ERCC) of the EC, containing information on ongoing floods in Europe, as reported by the national services and EFAS warnings.
Forecast Verification
EFAS also undergoes forecast verification, with two methods used for this system.Firstly, the hits, false alarms and misses are assessed for each flood event, with events evaluated through feedback reports and news media. Secondly, skill scores are calculated and reported regularly through EFAS bulletins, available via the website (see table 2).
Operational Applications
EFAS is integrated in the daily forecasting procedures of many national hydrological services across Europe, providing operational early warnings and additional information which is used for decision making purposes at national and local scales. Additionally, EFAS is used by the ERCC to compile reports on the flood situation and outlook, and for the co-ordination of emergency response, at the continental scale.
2.3.2 The European HYdrological Predictions for the Environment Model
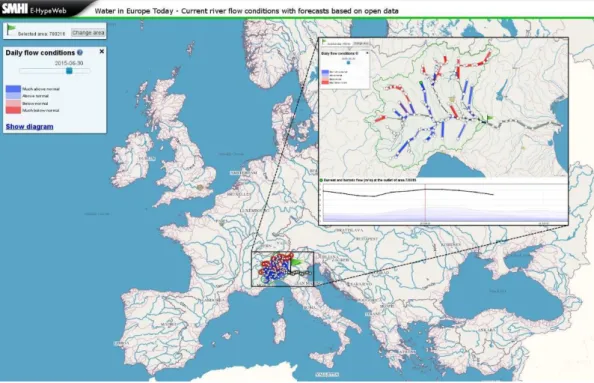
E-HYPE is a multipurpose model based on open data (table 3), which is used for various applications such as water management, research experiments and flood forecasting (Donnelly et al., 2016; SMHI, 2015). The E-HYPE Water in Europe Today (WET) tool (figure 4 ), compares the current hydrological situation with climatological data and past modelled events. The tool was originally designed to alert water managers to flow that is predicted to be outside of the normal range (based on the 75th and 25th percentiles), andChapter 2. The current state of large scale flood forecasting
has evolved to provide information to many end users. Another setup of the HYPE model, EFAS-HYPE, uses further, restricted, datasets and is currently being tested as an additional model within EFAS. This section focusses on the river flow forecasts produced by the WET tool.
Table 3: Databases used within the flood forecasting systems. Due to the alternative set-up of the BoM FFWS (including event-based modelling, nowcasting and significant forecaster input; see section 2.3.3), this information was not available.
Data Type Data Source
EFAS E-HYPE HEFS GloFAS
GLOFFIS
PCRGLOB-WB W3RA Topography/
Routing SRTM/CCM2 & HYDRO1K HydroSHEDS NHDPlus NED & HydroSHEDS & HYDRO1K
HydroSHEDS, HYDRO1K & NASA SRTM HydroSHEDS, HYDRO1K & NASA SRTM
Land Cover CORINE Globcover 2000 CORINE and MODIS, NLCD, AVHRR
CORINE and
Globcover 2000 GLCC, MIRCA MODIS
Urban Areas European Soil Data Centre (ESDAC) Euroland SoilSealing 2009 n/a Harmonized World Soil Database GLCC n/a Lake Area & Spatial Distribution GLWD (Global Lake and Wetland
Database)
GLWD (Global Lake and
Wetland Database)
NHDPlus Lake and Wetland GLWD (Global Database) GLWD, GRaND (Global Reservoir and Dams Database) n/a Lakes and Reservoirs GLWD, GRaND (Global Reservoir and Dams Database) GLWD, ERMOBST, FLAKE-Global, International Water Power &
Dam, ILEC World Lake Database, LEGOS, SMHI USGS & Federal state and local water
management authorities (e.g. USACE, Reclamation) GLWD, Global Reservoir and Dams Database GRAND GLWD, FLAKE-Global, GRaND (Global Reservoir and Dams Database) n/a
Soil Type European Soil Data Centre (ESDAC) Based on Land Use and Elevation SSURGO Harmonized World Soil
Database FAO DSW n/a
Crop Types n/a MIRCA-2000 CAPRI, n/a n/a MIRCA n/a
Irrigation EIM (European Irrigation Map), GMIA (Global Map of Irrigation Areas) EIM (European Irrigation Map), GMIA (Global Map of Irrigation Areas) NHDPlus, Local water authorities GMIA (Global map of Irrigation
Chapter 2. The current state of large scale flood forecasting Model Components
In contrast to other systems, E-HYPE currently uses only deterministic NWP input to drive the hydrological model component, though ensemble forecasting is intended for future system developments. The HYPE model (Donnelly et al., 2016; Lindström et al., 2010) is a distributed rainfall-runoff model developed at SMHI, which divides catchments into subbasins rather than a regular grid. Each subbasin is further divided into classes based on land use, soil type and elevation (SMHI, 2015). Alongside processes such as snow accumulation and melting, evapotranspiration and groundwater recharge (Lindström et al., 2010), HYPE also takes into account anthropogenic influences including irrigation and hydropower (SMHI, 2015).
Forecast Visualisation
Within the WET tool, forecasts of river flow are compared to climatology, based on the ECMWF ERA-Interim reanalysis and evaluation datasets (figure 5) in order to produce an overview of river flow that is under or above the normal range. This information is displayed on a colour-coded map of the subbasins within the E-HYPE model (figure 4).
Figure 4: The Water in Europe Today (WET) tool interface with example forecast (inset) showing above-normal (blue shading) and below-above-normal (red shading) forecast river flow. The hydrograph shows current conditions and forecast river flow (black line) compared to climatology (blue shading). Forecasts are available at hypeweb.smhi.se/europehype/forecasts
Chapter 2. The current state of large scale flood forecasting
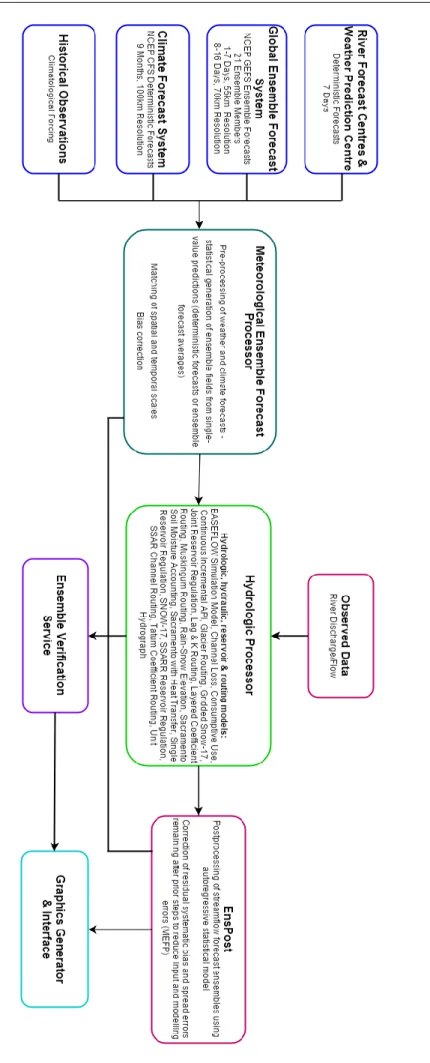
Figure 5:Components of the European Hydrological Predictions for the Environment (E-HYPE) Water in Europe Today (WET) tool.
Forecast Verification
Through the E-HYPE and WET interface, various model performance statistics are available. The model is verified against observed discharge from river gauges, and allows the user to quickly evaluate the performance of the model with regard to timing, variability and volume error for the point of interest or across a larger region. The overall model performance in terms of mean annual discharge is also presented. Donnelly et al. (2016) present a new method for evaluating the performance of a multi-basin model and results from this evaluation of the historical model indicated that the model is suitable for predictions in ungauged basins as it captures the spatial variability of flow. While the model performs well in terms of long-term means and seasonality, the performance is less effective in terms of daily variability, particularly in Mediterranean and mountainous areas, and in regions of most anthropogenic influence. Operational Applications
E-HYPE is currently being used in several applications across Europe, such as seasonal flow forecasting for the EU EUPORIAS project which aims to help societies to deal with climate variability, and providing data for use in oceanography models and as part of the SWITCH-ON EU project. The WET tool is also used by various other smaller companies around Europe to provide water forecasts, for example soil-water forecasts for gardening companies.
2.3.3 The Australian Flood Forecasting and Warning Service
The Australian BoM has been producing flood forecasts operationally for several decades, with the technology and systems used to produce these forecasts continually evolving. More recently, the BoM has introduced short-term (up to 7 days ahead) continuous streamflow forecasting using deterministic NWP models, within the Hydrological Forecasting System
Chapter 2. The current state of large scale flood forecasting
(HyFS) production environment (based on the Deltares Flood Early Warning System (FEWS) forecasting framework), alongside event-based hydrological modelling and nowcasting using radar rainfall estimates. The BoM services also rely on forecasters for the dissemination and communication of flood warnings and local information regarding river conditions. Model Components
The NWP forecasts used to force the rainfall-runoff models are produced by the BoM’s Australian Community Climate and Earth-System Simulator (ACCESS) NWP model. ACCESS has four components running at different spatial scales and resolutions (figure 6). In addition to the NWP model output, forecasters and hydrologists at the BoM can produce “What If” precipitation scenarios with which to force the hydrological models.
Alongside the semi-distributed GR (G´enie Rural a 4 Parametres) hydrological models, event- based forecasting is used extensively; for this, local models are used in support of the continental scale system. The resulting river discharge estimations from both model versions are used, alongside observed data and statistical models, to produce automated graphical products such as maps, bulletins, warnings and alerts.
Role of the Forecaster
Whilst the other systems presented in this paper are almost entirely automated and model- based, the BoM system also relies on the input of expert meteorologists and hydrologists. In addition to producing “What If” scenarios to feed into the hydrological models, the forecasters are able to manually post-process the forecasts and observed data to produce further products and visualisations and assess the quality of the data and forecasts in real time. The forecasters are also able to produce additional warnings on the fly, for example if a reservoir is seen to fill, or their experience alerts them to an alternative possible scenario to those produced by the hydrological models. The hydrologists at the BoM are also responsible for dissemination and communication of the forecasts and warnings.
A further reason for the input of forecasters is due to the challenges of producing operational flood forecasts for a large continent with an unevenly distributed population. Metropolitan areas have a dense observation network for both rainfall and river discharge, however there are large areas of Australia that have no flowing rivers, such as in the Northern Territory where there is an average of one river gauge every 13,360km2.
Chapter 2. The current state of large scale flood forecasting Com po ne nt s of th e A ustrali an F lo od F or ec astin g a nd Wa rni ng Serv ic e (F FW S).
Chapter 2. The current state of large scale flood forecasting Warning Dissemination
The final products delivered to the end users include flood watches and warnings, and information on current river levels and precipitation, which are disseminated to various users at specified stages in the evolution of a flood event, through a dedicated web interface, email, fax and telephone. These are usually text forecasts, an example of which is given in box 2 for a minor flood event, written by the hydrologists based on the output of the HyFS, but can also include automated alerts and bulletins for certain users. Figure 7 shows the corresponding publicly available graphics for this flood event, while the BoM hydrologists also have access to more sophisticated graphical products produced by the automated component of the HyFS, such as ensemble hydrographs.
Figure 7: The BoM publicly available flood warnings showing (a) warnings and river conditions across Australia, (b) warnings and river conditions for a particular region, (c) current river levels at a specific warning point where flow is above the minor flood level.
Chapter 2. The current state of large scale flood forecasting
Box 2: Example of a flood warning written by hydrologists at the Bureau of Meteorology. MINOR FLOOD WARNING FOR THE SNOWY RIVER
Issued at 9:58am EST on Wednesday 15 July 2015
River levels at Orbost are currently around the Minor Flood Level (4.2 metres) and rising. A peak of around 4.3-4.4 metres is expected during Wednesday afternoon [15/07/2015]. In the interests of community safety the SES suggests the following precautions: Don’t walk, ride or drive through floodwater,
Don’t allow children to play in floodwater,
Stay away from waterways and stormwater drains, and Keep well clear of fallen power lines
Current Emergency Information is available at http://www.ses.vic.gov.au For emergency assistance call the SES on telephone number 132 500. For life threatening emergencies, call 000 immediately.
The SES advises that rainfall run-off into waterways in recent fire affected areas may contain debris such as soil, ash, trees and rocks. People in fire affected areas should be alert to the potential for landslide and debris on roads.
Weather Forecast:
For the latest weather forecast see www.bom.gov.au/nsw/forecasts/ Next Issue:
The next warning will be issued by 10:00am Thursday [16/07/2015]. Latest River Heights:
Snowy R. at Basin Creek 4.33m falling 09:16 AM WED 15/07/15 Buchan R. at Buchan 1.65m falling 08:45 AM WED 15/07/15 Snowy R. at Jarrahmond 4.35m rising 09:00 AM WED 15/07/15 Snowy R. at Orbost 4.18m rising 09:00 AM WED 15/07/15
Chapter 2. The current state of large scale flood forecasting Forecast Verification
Currently, the BoM uses a manual verification approach, sampling 10% of the warnings issued, based on specifications set out for each forecast point such as a minimum lead time of 6 hours, or a peak forecast accuracy of ±0.5m. With updates to the FFWS, verification software will be introduced which will automatically compute statistics analysing the accuracy of the forecast river levels, peak and timing based on a comparison with observed river levels. The lead time provided for warnings will also be analysed and compared to the accuracy specifications, providing a measure of performance for a much greater sample of events, which will in turn drive further system improvement. Additionally, the HyFS continuous short-term forecasts are verified using a 15-day moving average climatology to calculate the mean absolute error skill score.
Operational Applications
At the BoM, the continuous short-term streamflow forecasts are used across Australia to provide an early indication of an upcoming flood event, in order to start making arrangements and decisions. These forecasts are then used as a “heads-up” to start running event-based models at the local scale to provide the official, public flood warnings. This is an excellent example of the use of large scale flood forecasting systems to enhance and supplement existing, local-scale forecasting capabilities.
2.3.4 The U.S. Hydrologic Ensemble Forecast Service
The HEFS is run by the NWS, and, for river basins across the U.S., provides “uncertainty- quantified forecast and verification products” (Demargne et al., 2014). From the late 1990s, NWS service assessments, alongside feedback from end users and the US National Academies (National Research Council, 2006) began to confirm the need for probabilistic river forecasts, for flood forecasting and water resources. In 2012, the HEFS began to run experimentally at several regional River Forecast Centres (RFCs), each of which forecasts streamflow for 100s of river locations, and is currently being rolled out operationally at all 13 RFCs.
The HEFS aims to produce ensemble streamflow forecasts which seamlessly span lead times from less than one hour up to several years, and which are spatially and temporally consistent, calibrated (i.e. unbiased with an accurate spread) and verified.
Chapter 2. The current state of large scale flood forecasting Model Components
The HEFS consists of five main components (Demargne et al., 2014), detailed in figure 8, and has been implemented to run as part of each RFCs configuration of the FEWS-based Community Hydrologic Prediction System (CHPS), which since 2010 has been the software platform used to run the traditional deterministic flood forecasts and long-range ESP forecasts. The system is designed to be driven with four meteorological forecast inputs, two of which (GEFS and CFSv2) are the output of NWP models; whereas the RFC forecasts and climatologies are created by meteorologists for the spatial units of the RFCs’ watershed models using predictions from the NCEP Weather Prediction Center (WPC), local NWS Weather Forecast Offices (WFOs) and other sources (NOAA, 2012).
Each RFC may use different combinations of the 19 components within the Hydrological Processor (HP) suite, but the majority of RFC operations centre on a lumped implementation of the SAC-SMA (Burnash et al., 1973)and SNOW-17 (Anderson, 2006) models. The pre-processing step within the HEFS (MEFP, figure 8) creates an ensemble of seamless, hours-to-seasons, calibrated weather and climate forcings which are fed into the HP. Notably, through use of the MEFP and EnsPost pre- and post-processing components, both the uncertainties in the meteorological input and the hydrology are taken into account.
Forecast Visualisation
The graphics generator (figure 8) uses the resulting ensemble hydrographs to produce visualisations of the forecasts which can be communicated to a range of end users for the purpose of decision-making and warning dissemination. These final forecast products include spaghetti plots, exceedance probabilities in the form of bar graphs and probability distribution plots using comparisons with historical simulations (reanalysis datasets), and an expected value chart describing the ensemble distribution.Currently, graphics from the HEFS are operational at only a handful of RFCs and are currently being rolled out at the remaining RFCs. An example of an HEFS hydrograph for one river location, alongside the public web interface, is shown in figure 9. The forecast data associated with the graphical products is typically also available from the RFCs and many users can access the data directly to drive local decision support models.
Chapter 2. The current state of large scale flood forecasting Fig ur e 8 : Co mp one nts of th e U .S. Hy dr ol og ic E ns em ble F orec ast Sys tem ( HE F S).
Chapter 2. The current state of large scale flood forecasting Warning Dissemination
NWS product requirements are codified through NWS Directives (NOAA, 2015),and the RFCs generally issue products based on hydro-meteorological analyses and long-range predictions that are not time-critical, and inform non-hazard related user activities and decisions, such as the Streamflow Guidance. The NWS Weather Forecast Offices (WFOs), in contrast, issue the primary hazard-centred alerts related to flooding, including products such as a Hydrologic Outlook(“hydro-meteorological conditions that could cause flooding or impact water supply”), Flood Watch (flooding is likely), or Flood Warning (flooding is imminent or occurring). The WFO hydrologic products are based primarily on RFC analyses and predictions; for instance, an RFC forecast exceeding a flood threshold triggers a recommendation to the WFO to release a flood warning that is reviewed by the WFO forecaster. Protocols for linking the newer HEFS ensemble forecasts to alerts are still in development.
Forecast Verification
An additional component of the HEFS shown in figure 8 is the Ensemble Verification System (EVS), which produces statistics such as the bias in the forecast probabilities, the skill relative to a ‘baseline’ forecasting system and the ability to discriminate between events. EVS runs within HEFS and is also freely available as a standalone application. The verification statistics are provided as graphical and textual products. They are used to guide research and development of the HEFS and to improve the configuration of the HEFS for operational forecasting. Studies by Brown et al. (2014a, 2014b) found that the skill of the precipitation forecasts used for the HEFS are greatest at lead times of up to one week, for moderate precipitation, and in the wet season (December to March), with limitations in the summer season due to difficulties in forecasting convection. The studies also showed that the skill of the streamflow forecasts, for both the HEFS and traditional RFC deterministic forecasts, is substantially increased through use of the EnsPost component.
Operational Applications
The HEFS is currently being implemented by all thirteen NWS RFCs, with existing or proposed applications ranging from flood forecasting to river navigation, reservoir operation, and long-term planning and management of water resources. For example, reforecasts and operational forecasts from the HEFS are being used by the New York City Department of Environmental Protection (NYCDEP) to improve the management of water supply to NYC by optimizing the
Chapter 2. The current state of large scale flood forecasting
quantity and quality of water stored in the NYC reservoirs while avoiding unnecessary infrastructure costs.
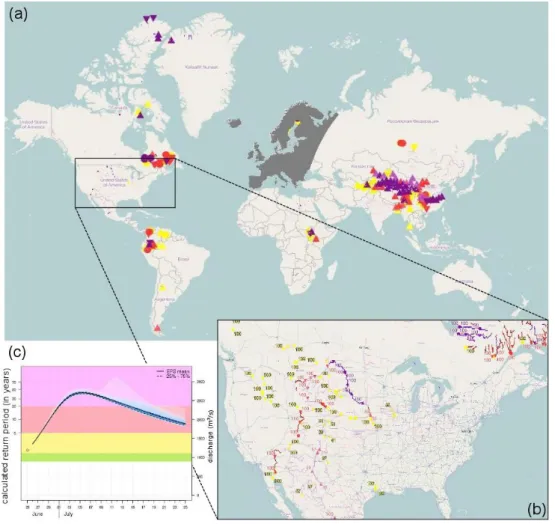
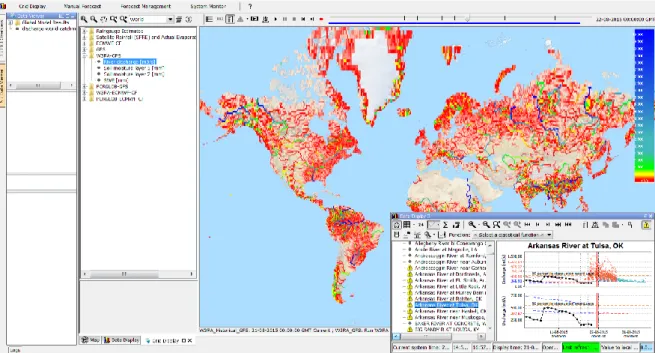
Figure 9:The U.S. Hydrologic Ensemble Forecast System (HEFS) overview map of locations forecasting floods, with colour representing flood severity. An ensemble hydrograph is shown for a flood event at one river location, including observed stage and flow (green), forecast stage and flow (purple) in terms of probabilities, and colours indicating the forecast severity based on flood stage data (minor flood – yellow, moderate flood – red, major flood – pink). Forecasts are available at water.weather.gov/ahps/forecasts.php
2.4 Global Scale Flood Forecasting Systems
At present, there are just two flood forecasting systems that are operational at the global scale: the Global Flood Awareness System (GloFAS) of the ECMWF and EC, and the Global Flood Forecasting and Information System (GLOFFIS) run by Deltares. There also exists a Global Flood Monitoring System (GFMS) developed by NASA (the National Aeronautics and Space Administration) and the University of Maryland, which uses satellite precipitation as input to a hydrological model to produce real-time global maps of flood events. Global flood monitoring is an important aspect of disaster risk reduction and has many potential applications across the globe; however the GFMS is not an operational hydro-meteorological flood forecasting system and as such is not discussed in detail in this review. The reader is referred to the GFMS website(NASA, 2015) and publications (Wu et al., 2014; Yilmaz et al., 2010) for further information on the GFMS. This section discusses the components of GloFAS and GLOFFIS, alongside the products and warnings provided to end users and verification techniques used to assess the performance of these systems.
Chapter 2. The current state of large scale flood forecasting
2.4.1 The Global Flood Awareness System
GloFAS has been producing probabilistic flood forecasts with up to two weeks lead time in a pre-operational environment since 2011 (Alfieri et al., 2013); this environment enables continuous research, development and testing in order to produce an operational tool that is independent of administrative and political boundaries. GloFAS can provide downstream countries with early warnings and information on upstream river conditions alongside global overviews of upcoming flood events in large river basins, for decision makers ranging from water authorities and hydropower companies to civil protection and international humanitarian aid organisations.
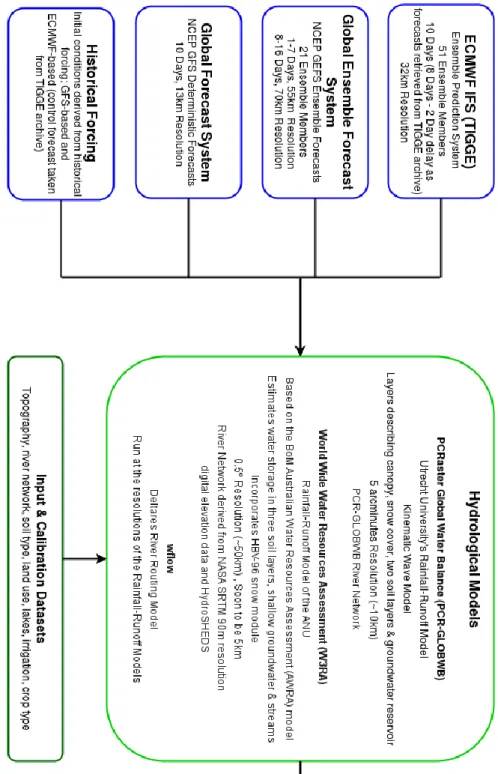
Figure 10: Components of the Global Flood Awareness System (GloFAS).
Model Components
In contrast to the other systems presented in this paper, GloFAS uses surface and sub-surface runoff forecasts produced by the NWP model rather than a separate rainfall-runoff component (figure 1). The Hydrology Tiled ECMWF Scheme for Surface Exchange over Land (HTESSEL) is contained within the IFS and is used as forcing for the Lisflood river routing model. Figure 10 details the components of GloFAS. Although Lisflood global (Van Der Knijff et al., 2010)is also a rainfall-runoff model, it is used here to simulate the routing processes and the groundwater processes, after re-sampling the runoff forecasts from the IFS to the 0.1oresolution of Lisflood. Additionally, GloFAS contains a loss function to
account for water loss within the channel reaches in arid areas, which also simulates the river-aquifer and river-floodplain interaction and the influence of evaporation from large rivers.
Chapter 2. The current state o