j ou rna l h o me pa g e:w w w . i n t l . e l s e v i e r h e a l t h . c o m / j o u r n a l s / c m p b
Machine
learning
algorithms
and
forced
oscillation
measurements
applied
to
the
automatic
identification
of
chronic
obstructive
pulmonary
disease
Jorge
L.M.
Amaral
a,
Agnaldo
J.
Lopes
b,
José
M.
Jansen
b,
Alvaro
C.D.
Faria
c,
Pedro
L.
Melo
c,∗aDepartmentofElectronicsandTelecommunicationsEngineering,StateUniversityofRiodeJaneiro,RiodeJaneiro,Brazil bPulmonaryFunctionLaboratory,PedroErnestoUniversityHospital,StateUniversityofRiodeJaneiro,RiodeJaneiro,Brazil cBiomedicalInstrumentationLaboratory,InstituteofBiologyRobertoAlcantaraGomesandLaboratoryofClinicalandExperimental ResearchinVascularBiology(BioVasc),StateUniversityofRiodeJaneiro,RiodeJaneiro,Brazil
a
r
t
i
c
l
e
i
n
f
o
Articlehistory:
Received1April2011 Receivedinrevisedform 15August2011
Accepted22September2011
Keywords:
Clinicaldecisionsupport Artificialintelligence Classification
Forcedoscillationtechnique Respiratorysystem
Chronicobstructivepulmonary disease
a
b
s
t
r
a
c
t
Thepurposeofthisstudyistodevelopaclinicaldecisionsupportsystembasedonmachine learning(ML)algorithmstohelpthediagnosticofchronicobstructivepulmonarydisease (COPD)usingforcedoscillation(FO)measurements.Tothisend,theperformancesof clas-sificationalgorithmsbasedonLinearBayesNormalClassifier,Knearestneighbor(KNN), decisiontrees,artificialneuralnetworks(ANN)andsupportvectormachines(SVM)were comparedinordertothesearchforthebestclassifier.Fourfeatureselectionmethodswere alsousedinordertoidentifyareducedsetofthemostrelevantparameters.The avail-abledatasetconsistsof7possibleinputfeatures(FOparameters)of150measurements madein50volunteers(COPD,n=25;healthy,n=25).Theperformanceoftheclassifiersand reduceddatasetswereevaluatedbythedeterminationofsensitivity(Se),specificity(Sp)and areaundertheROCcurve(AUC).Amongthestudiedclassifiers,KNN,SVMandANN classi-fierswerethemostadequate,reachingvaluesthatallowaveryaccurateclinicaldiagnosis (Se>87%,Sp>94%,andAUC>0.95).Theuseoftheanalysisofcorrelationasarankingindex oftheFOTparameters,allowedustosimplifytheanalysisoftheFOTparameters,while stillmaintainingahighdegreeofaccuracy.Inconclusion,theresultsofthisstudyindicate thattheproposedclassifiersmaycontributetoeasythediagnosticofCOPDbyusingforced oscillationmeasurements.
©2011ElsevierIrelandLtd.
1.
Introduction
Chronic obstructive pulmonary disease (COPD) is a major cause of chronic morbidity and mortality throughout the world[1].AccordingtoWHOestimates,80millionpeoplehave moderatetosevereCOPD.Morethan3millionpeoplediedof
∗ Correspondingauthor.
E-mailaddresses:[email protected],[email protected](P.L.Melo).
COPD in2005,whichcorrespondsto5%ofall deaths glob-ally[2].ThechronicairflowlimitationcharacteristicofCOPD iscausedbyamixtureofsmallairwaydisease (obstructive bronchiolitis)andparenchymaldestruction(emphysema)[1]. Thereisanagreementintheliteraturethatnewmeasurement technologiesthatareabletodetectCOPDinearlystageswould contributetodecreasingmedicalandeconomicburdens[3].
0169-2607©2011ElsevierIrelandLtd. doi:10.1016/j.cmpb.2011.09.009
Open access under the Elsevier OA license.
Submitting aphysical system toforced oscillationsis a very general approachto the investigation ofits structure and/orproperties[4].Itsapplicationtorespiratorymechanics wasfirstproposedbyDuBoisetal.[5].Thismethod,known as forced oscillation technique (FOT), consists of applying smallsinusoidalpressurevariationstostimulatethe respira-torysystematfrequencieshigherthanthenormalbreathing frequency and measuring the flow response. This method characterizestherespiratoryimpedanceanditstwo compo-nents,respiratorysystemresistance(Rrs)andreactance(Xrs).
Themethodissimpleandrequiresonlypassiveco-operation andnoforcedexpiratorymaneuvers.Recently,thistechnique hasbeensuccessfullyappliedinthedetectionofearly respi-ratorychangesinsmokers[6].
Althoughobtainingrespiratoryimpedancevaluesiseasy, theresultingvaluesaredifficulttounderstandbyclinicians astheyarebasedonanelectricalequivalentcircuitmodelof therespiratorysystem.Inthecontextofadiagnosis frame-work,theinterpretationofresistanceandreactancecurves,as wellasthederivedparametersmeasuredbytheFOT,requires trainingandexperience,andisdifficulttaskfortheuntrained pulmonologist.
Methodsbasedonmachinelearning(ML)havebeenwidely usedtodevelopclassifiers.Thesesystemscanextract infor-mation from different classes ofsignals afterhaving been trainedtoperformthisspecifictaskbylearningfrom exam-ples.Inrespiratorymechanics,MLprovedtobeusefulasa patternrecognitionmethodtooptimizealarmsofanesthesia breathingcircuits[7],detectionofupperairwayobstruction
[8],esophagealintubation[9],assessmentoflunginjury[10], staticcomplianceinanimalmodels[11]andtheevaluationof spirometricexams[12].Recently,aseverityclassificationfor idiopathicpulmonaryfibrosisbyusingfuzzylogicwas pro-posed[13].
2.
Background
Previous works [14,15] have compared groups of controls and COPD patients observing clear modifications in FOT parameters.However,categorizationofpulmonarydiseases by looking at the plotted curves of respiratory impedance or derived parameters can prove a difficult task for the untrained pulmonologist. This raises the question: an ML basedapproachtothe analysisofFOT datacan providean efficientmethodtorecognizeCOPD?Infact,onlytworecent conferencepapershaveaddressedthisquestion[16,17].
Inthe work ofBaruáet al.[16], anartificial neural net-work(ANN)wasusedtorecognizeandclassifythediseases ofthecentralandperipheralairways.TheauthorsusedIOS measurementsandafeedforwardANNthatwastrainedby thebackpropagationalgorithm.Aftersupervisedtraining,the classifierproduceda98.47%and61.53%correctclassification ratewhenthesamedataandanewsetofunseendatawere used,respectively.Itwaspointedoutthattheproposed clas-sifiercouldbefurtherimprovedwiththeinclusionofmore trainingsamplescombinedwithfuzzylogicdecisionrules.
Inalatterworkofthesamegroup[17],aclassifierbased onANNwascapableofdistinguishingbetweenrelatively con-strictedand nonconstrictedairwayconditions inasthmatic
children. The performance of the classifier was evaluated bytwomethods:(1)usingallofthepatternsduringtraining aswellasinthe feed-forwardstageand(2)usingonly60% ofthedatasetduringtrainingandwiththeremaining40% as unseen patterns. The classification accuracies obtained were95.01%and98.61%,respectively.Theauthorsconcluded that ANNs can successfully be trained with the impulse oscillation system (IOS) data, enabling them to generalize theIOSparameterrelationshipstoclassifypreviouslyunseen pulmonary patterns. The two cited studies used an IOS, whichhasdifferencesfromtheclassicalFOT,includingdata processing and the parameters used tointerpret raw data
[18,19].Inaddition,fromasystemidentificationpointofview, the impulse excitationsignalusedinIOS isamuchworse excitationsignalthanaMultisineusedinFOT.Thisdifference isassociatedwithaworsecrestfactorintheimpulsesignal.
Inthiscontext,weobservedthattherewasnodatainthe literatureconcerningtheuseofMLalgorithmsassociatedwith classicalFOTmeasurementstoaidcliniciansinthe identifi-cationofCOPD.Tocontributetoelucidatethisquestion,our grouprecentlyinvestigatedthispossibilityusingtheclassical FOTassociatedwithaclassifierbasedonANN[20].Twofeature selectionmethods(theanalysisofthelinearcorrelationand forwardsearch)wereusedinordertoidentifyareducedset ofthemostrelevantparameters.Twodifferenttraining strate-giesfortheANNswereusedandtheperformanceofresulting networkswere evaluatedbythedeterminationofaccuracy, sensitivity(Se),specificity(Sp)andAUC.TheANNclassifiers presentedhighaccuracy(Se>0.9,Sp>0.9andAUC>0.9)both inthecompleteandthereducesetsofFOTparameters.This indicates that ANNs classifiersmay contributeto easy the diagnosticofCOPDusingFOTmeasurements.Althoughthese resultswereverypromising,thisinitialworkwaslimitedto theinvestigationofanANNbasedclassifierbecausewewere interestedinadirectcomparisonwiththetwopreviouslycited works.
Thepurposeofthepresentstudy istoevaluatethe per-formance ofseveral MLalgorithms in the developmentof anautomaticclassifiertohelpthediagnosticofCOPDusing forcedoscillationmeasurements.
Thepaperisorganizedasfollows:adiscussionofthedesign principlesandimplementationgoalsispresentedinthenext section.ThehealthygroupandtheCOPDgroupare character-izedinSection4,alongwithadescriptionofthemeasurement protocol.Thissectionalsopresentstheevaluatedclassifiers anddescribesthemethodsusedforperformanceevaluation, comparisonsamongclassifiersandfeatureselection.Section
5presentstheresultsandSection6discussestheresultswith respecttothesearchforthebestclassifierandparameters. Section7summarizesthemainoutcomesofthisinvestigation andpointstofuturestepsinthisresearchtopic.
3.
Design
considerations
3.1. ClassificationsystemThebasicstructureofaclassificationsystemistheinput,the classifierandtheoutput.Inthepresentwork,theinputsare theparametersprovidedbytheFOT,theclassifierisoneofthe
patternrecognitionalgorithmschosen,andtheoutputtellsif theinputparametersindicateCOPDornot.
The design process of a classification system presents severalimportantaspectssuchas:theevaluationofthe clas-sifiers,choiceofthealgorithmstobeused,featureselection, selectionofthebestparametersandcomparisonofclassifiers performance.Inthefollowingsections,theseaspectswillbe brieflydescribed.
3.2. Thestudiedclassifiers
Inthisparticularstudy,thefollowingclassificationalgorithms wereevaluated:
• LinearBayesNormalClassifier[21,22]
• Knearestneighbor[21]
• Decisiontrees[23,24]
• Artificialneuralnetworks[25]
• Supportvectormachines[26]
Thesealgorithmswerechosenbecausetheyrepresentwide varietyofclassifieralgorithmsasseeninLippmann’slistof typesofclassifiers[21]. Theywill bebrieflydescribed. The completefulldescriptionofthealgorithmscanbefoundin thereferences.
TheLinear Bayes Normal Classifier (LBNC) presents the minimum-error,accordingtothe BayesianDecision Theory, whentheclassesarenormallydistributedwithequal covari-ancematrixes.TheLinearBayesisfastandsimpletocompute fromthetrainingdataandprovidesaverystraight interpreta-tion,sinceitisdecisionboundaryisahyperplane.Inspiteof itssimplicity,itisreasonablyrobust,i.e.,itcandeliver surpris-inglygoodresultsevenwhentheclassesdonotfollownormal distributionswithequalcovariancematrixes[21].
TheKnearestneighbor(KNN)isoneofthemostsimple andelegantclassificationmethodsinpatternrecognition[21]. Itisatypeofinstance-basedlearning,orlazylearning,which means that inthe learningstage, it simplystores a set of labeledinstances(trainingset).Whenanewqueryinstance hastobeclassified,thealgorithmfindsKnumber of train-ing instancesclosest tothe querypoint, using asimilarity functionusuallybasedontheEuclideandistance.The classifi-cationisdoneusingthemajorityvoteamongtheclassification oftheKobjects.IfK=1,thentheobjectissimplyassignedto theclassofitsnearestneighbor.
Adecisiontree(DTREE)isahierarchicalstructurethat con-sists ofnodes and branches [23]. There are threetypes of nodes:the rootthathasonlyoutgoingbranches,the inter-nalnodesthathaveoneincomingandtwoormoreoutgoing branches and terminal (leaf) nodes that have no outgoing branches.All terminalnodeshaveaclasslabelassigned to them[23].Eachnonterminalnodeinthetreerepresentsa testononeoftheattributesandeachbranchthatcomesout ofthenoderepresentsoneofthepossibleoutcomesofthe testperformed.Aqueryinstanceisclassifiedbystartingat therootnode,testingtheattributespecifiedbythisnode,and thenmovingdownthetreebranchcorrespondingtothe out-comeofthetestforthisattribute.Thisprocessisrepeated untilitgetstoaterminalnode,wheretheclasslabelisgiven tothequeryinstance.
An ANN isa massive parallel system [25]composed of manysimpleprocessingelements(neurons)whosefunctionis determinedbythenetworkarchitecture,connectionstrengths (synapticweights)andtheprocessingperformedatthe neu-rons. Neural networksare capableof acquiringknowledge throughalearningprocessandtostorethatknowledgeinthe synapticweights.Oneofthemostsuccessfulneuralnetwork architectureisthe multilayerperceptron(MLP). Ithasbeen successfullyappliedtoavarietyofpatternrecognition prob-lemsinindustry,business,science[27]andinmedical diagno-sis[27,28].Oneofthemostimportantfeaturesofaneural net-workistheabilitytogeneralizewhatithaslearnedfromthe trainingprocedure.Thisallowsthenetworktodealwithnoise intheinputdataandtoprovidethecorrectoutputstonew datapatterns,i.e.,datathatwerenotusedtotrainthenetwork. Supportvectormachines(SVM)arelearningsystemsbased on statisticallearning theory[26] and theyhavebeen suc-cessfully used in a varietyof classification and regression problems. For a two-classclassification problem, the basic form SVM is a linear classifier that performs a classifica-tionconstructingahyperplanethatoptimallyseparatesthe classes.Theoptimalhyperplaneistheonethatprovidesthe maximalmargin.(Themarginisdefinedasthedistancefrom atrainingsampleandthehyperplane.)Itcanbeproventhat this particularsolutionhasthe highestgeneralization abil-ity.Thisformulationcanbegeneralizedapplyinganon-linear mappingofthetrainingset.Thedataistransformedtoanew featurehigh-dimensionalspacewheretheclassesaremore easily separable and anoptimal hyperplanecan be found. TheradialbasisfunctionKernelisfrequentlyusingin accom-plishingthisnonlinearmappinganditisfrequentlythefirst nonlinearmappingtoconsider.Althoughthedecisionsurface (hyperplane)islinearinthehighdimensionalspace,however, whenitisseenintheoriginallow-dimensionalfeaturespace, itisnolongerlinear,meaningthatSVMcanalsobeappliedto datathatisnotlinearlyseparable[29].
3.3. Featureselection
Thepurposeoftheinputfeatureselectionistofindthe small-est number of relevant and informative features that can resultinasatisfactory performance[30].Other motivations toperformfeatureselectionare:generaldatareduction,to limitstoragerequirements,increasethealgorithmspeedand togainknowledgeabouttheprocessthatgeneratesthedata andtoallowdatavisualization(2Dor3D)[30].Itisalso impor-tantbecausealargenumberofinputsimplyintheestimation ofalargenumberofmodelparameters,whichcanbedifficult inlimitedsizedatasets[28].
Basicallytherearethreetypesoffeaturesselection meth-ods: filters, wrappers and embedded methods [30]. Filter methods provide a ranking order of the features using a relevant index such as correlation coefficients or classical statistical tests (T-test, F-test, Chi-squared, etc.). Wrappers normallyapplyanefficientsearchstrategytofindthebest fea-turesbasedonthemachinelearningalgorithmperformance, suchastheclassificationaccuracy.Embeddedmethods per-form feature selection in the process of training and are usuallyspecifictosomegivenlearningmachines,suchas deci-siontrees[30].
3.4. Performanceevaluation
Theevaluationoftheclassifiersplaysakey rolein classifi-cationsystemdesign.Itsprimarygoalistochoosethebest classifierandestimatesitsperformanceonfutureexamples (generalizationaccuracy)[31].Themaincomponentsinthis evaluationare:thechoiceofthe performancefunction,the evaluationstructureandthecomparisonofdifferent classi-fiers.Thereareseveralmeasuresthatcanbeusedtoaccess theperformanceofthe classifier,dependingonthespecific domainofapplication.Someofthecommonusedmeasures are:accuracy,sensitivity,specificity,TruePositiveRate,False PositiveRate,Recall,PrecisionandtheareaundertheReceiver OperatingCharacteristic(ROC)curve(AUC)[32].
Theevaluationstructureisanimportantpartofthedesign. In order todecide the best classifier, one hasto look into the generalizationaccuracy. Thiscan bedone using either Hold-outorK-foldcross-validationprocedures.InHoldout, theavailabledataisdividedintrainingandtestdatasets.The classifieristrainedwiththetrainingdatasetandthe perfor-manceofthetrainedclassifierisevaluatedinthetestdata settoestimatethegeneralizationaccuracy.Theproblemwith HoldoutisthatdifferentHoldoutsets(differentsplits)leads todifferentresults.Also,dependingontheavailabledata,it ispossibletoendupwithaverywideconfidenceintervalfor theaccuracy[24].InaK-foldcross-validation,all the avail-abledataispartitionedintokequal(orapproximatelyequal) datasetsorfolds[33].For eachfoldinturn,usethatfolder fortestingandtheremainingk−1foldersareusefortraining aclassifier.Theperformanceofeachlearningalgorithmon eachfoldcanbetrackedusingsomepre-determinedmeasure suchasaccuracy.Uponcompletion,ksamplesofthe perfor-mancemetricwillbeavailableanddifferentmethodologies suchasaveragingcanbeusedtoobtainanaggregatemeasure fromthesesamples,orthesesamplescanbeusedina statisti-calHypothesistesttocomparetwoormoremachinelearning algorithms.
TheuseofK-foldcross-validationallowsustoestimate performanceofthelearnedmodelfromavailabledatausing onealgorithm.Inotherwords,it ispossibletoestimateits performanceinunseenexamples (the generalization capa-bilityofthe algorithm).Itcanalsobeusedtocomparethe performanceoftwoormoredifferentalgorithmsandrealize thebestalgorithmfortheavailabledata,oralternatively,it canhelpthedesignertochoosethebestsetofparametersof aparticularmodel.
TheHypothesistestisanotherimportantelementwhen onedesiretocomparetwoormoremachine learning algo-rithms. In the Hypothesis test, we want to verify if there isnodifference inthe performanceoftwo classifiers(Null Hypothesis)undera certainconfidence level(usually 95%). Foracomparisoninonedataset,onecanusetheStudentˇıs test(t-test)oroneofitsvariations,forexamplethecorrected resample[24].Dietterich[31]pointsout thattheuseofa t-test hasa right risk ofa Type I error,i.e., a riskof find a differencewherenoneexists,recommendingthe5×2 cross-validationortheuseofMcNemarˇıstest.Inthecaseofmultiple datasetsfromdifferentdomains,Demsar[34]recommends Wilcoxon’sSignedRankstest,Friedman testsand Posthoc tests.
It is also importantto mention that sometimes classi-fiersareevaluatednotonlybytheirperformancemeasures, but alsobythe speedandscalability,robustnessand inter-pretability.Whenonelooksatspeedandscalability,he(she)is interestedtoknowhowlongittakestoconstructtheclassifier, howlongittakestouseclassifierandifitisabletodealwith datasetswithseveralthousandpoints.Ifrobustnessis impor-tant, onetries to evaluateits capability ofhandling noise, missingvaluesandirrelevantfeatures.Iftheinterpretability isimportant,onetriestofindiftheclassifiercangivesome explanationonhowitachievedtheclassificationforacertain pointofthedataset.
4.
Methods
4.1. Subjectsandspirometry
Theobjectivesofthestudywereexplainedtoallindividuals andtheirwrittenconsentwasobtainedbeforeinclusioninthe study.ThestudywasapprovedbytheMedicalResearchEthics CommitteeoftheStateUniversityofRiodeJaneiro.Thestudy involvedagroupofCOPDpatientswith25subjectsanda con-trol groupformedby25 neversmokingsubjects. Thegroup wasformedbasicallybystudentsandemployeesoftheState University ofRiode Janeiro,andwas composedbyhealthy subjectswhopresentednormalspirometryandnohistoryof pulmonaryorcardiacdisease.ThepatientswithCOPDwere comingfromtheAmbulatoryofCOPDoftheServiceof Pneu-mologyofourUniversityHospital.Thepatientswereinstable clinicalcondition.
COPDpatientspresentedmild(n=8),moderate(n=9)and severe(n=8)airflowobstruction,whichwasevaluatedusing the following parameters [6,14,35]: forced Expiratory Vol-ume inthefirst second(FEV1),ForcedVital Capacity(FVC),
FEV1/FVCratioandtheForcedExpiratoryFlow(FEF)between
25%and75%ofFVC,andFVC(FEF/FVC)ratio.These measure-mentswereobtainedforallpatientsinasittingposition,using aclosedcircuit spirometer(VitraceVT-139;Pro-médico,Riode Janeiro,Brazil),andwerepresentedasrawdataandpercentile ofthepredictedvalues(%pred).
4.2. Forcedoscillationtechnique
The instrumentation used for evaluation of respiratory impedancebyFOThasbeendescribedinotherstudies[36,37]. Briefly,apseudorandomsinusoidalsignalwith2cmH2O
peak-to-peakofamplitude,containingallharmonicof2Hzbetween 4and32Hz,wasappliedbyaloudspeaker.Thepressureinput wasmeasuredwithaHoneywell176PCpressuretransducer (Microswitch,Boston,MA, USA),and theairway flowswith ascreenpneumothacographcoupledtoasimilartransducer withamatchedfrequencyresponse.Thesignalswere digi-tizedatarateof1024Hz, forperiodsof16s,byapersonal computer,andafastFouriertransformwascomputedusing blocksof4096pointswith50%overlap.ToperformtheFOT analysisthevolunteerremainedinasittingposition,keeping theheadinanormalpositionandbreathingspontaneously throughamouthpiece. Duringthe measurements,the sub-jectsfirmlysupportedhis/hercheeksandmouthfloorusing
bothhands,whileanoseclipwasworn.Aminimal coher-encefunctionof0.9wasconsideredadequate[6,38].Anytime thecoherencecomputed,(foranyofthestudiedfrequencies) waslessthanthisthreshold,themaneuverwasnot consid-eredvalidandtheexamwasrepeated.Threemeasurements weremadeandthefinalresultofthetestwascalculatedas themeanofthesethreemeasurements.
TodescribetheresistivecomponentoftheFOTdata, an analysisoflinearregressioninthefrequencyrangebetween 4and16Hzwasusedinordertoachieveinterceptresistance (R0)andtheslopeoftheresistivecomponentoftheimpedance
(S).Usingthesamefrequencyrange,aparametercommonly relatedtoairwaysdimensions,themeanresistance(Rm)was
alsocalculated[6,12,38].Theresultsassociatedwiththe reac-tancewere interpretedusing themean reactance(Xm),the
resonancefrequency(fr)andthedynamiccomplianceofthe
respiratorysystem(Crs,dyn)[6,12,38].TheCrs,dynwasestimated
consideringrespiratoryreactanceattheoscillatoryfrequency of4Hz(Xrs4Hz)andusingtheequationXrs4Hz=−1/(2fCrs,dyn)
[6,12,38].Thesamefrequencywasusedtoevaluatethe abso-lutevalueofrespiratoryimpedance(Z4Hz),whichrepresents
thetotalmechanicalloadoftherespiratorysystem,including resistiveandelasticeffects[38].
4.3. Featureselection
Inordertofindtheappropriatesetofinputs,all three fea-ture selection methods cited in the previous section were used.Thechosenfiltermethodusedthecorrelation coeffi-cientsasarankingindex.Theanalysisofthelinearcorrelation coefficientswasdonecalculatingthematrixCofcorrelation coefficients.Eachelementofthismatrixrepresentsthe cor-relationcoefficientbetweentwofeatures,C(featurei,featurej)
orbetweenthefeaturesandtheoutput,C(featurei,Output).
Theproceduretofindthemostrelevantfeatureswasstarted bylookingforafeaturethatpossessthehighestcorrelation coefficientwiththeoutput,C(featurei,Output).Ifthisiscalled
HCCFO(HighestCorrelationCoefficientFeaturewithOutput). Thenextstepwastoeliminatefeatureswherethefollowing relationholds:
|C(HCCFO,Feature)|>|C(Output,HCCFO)
|>|C(Output,Feature)| (1)
Itwas done because if the relation (1) holds for a spe-cificfeature, the information it carries can berepresented bythefeature thathas highestcorrelationcoefficient with the output (HCCFO).Theprocess of featureselectionusing thecorrelation coefficientswasperformedusing the cross-validation method [33]. The available dataset was divided ina fixed number of folds. Eachfold had the same num-berofnormaland COPDmeasurements.Oneofthefolders isthe testset and remainingfolders used astraining set. Thefeatureselectionusingthecorrelationcoefficientswere appliedonlyonthetrainingsets.Therewasusedthreesearch strategies(forward,backward,forwardfloating)inthewrapper methods,andtheperformanceindexwas1-nearestneighbor leave-one-out classification performance. The embedded methodwasusedonlyinthetrainingofthedecisiontree.
4.4. Searchforthebestclassifierparameters
Thefiveclassifiers(LBNC,KNN,DTREE,ANNandSVM)were implementedwithapatternrecognitiontoolbox(prtools)for Matlab[39].TheLBNCwasusedwiththedefaultparameters, i.e.,withnoregularization.IntheKNN,Kwasset1,sowehave theonenearestneighborclassifier.Inalltheotherclassifiers, thesearchforthebestparameterswasdonewitha10-fold cross-validationusingtheaverageclassificationaccuracyin thetestfoldsasaperformanceindex.
In the decision process, the used parameters were the binarysplittingcriterion(informationgain,purity,fisher cri-terion)andthepruningtype(Quinlanpruning,nopruningor theuseofatuningsetforpruning)[39].
In the ANNclassifier the parameterto besearch is the numberofneuronsinthehiddenlayer.Ontheotherhand, concerningtheSVMclassifierwithradialbasisfunction ker-nelhasonlytwoparameterstobefound:theregularization parameterC,thatexpressthechoiceofhavingalarge mar-ginwithmoretrainingsampleswronglyclassifiedorhaving asmallmarginwithlessclassificationerrorsandthe param-eter,andr,thatistheradiusoftheradialbasiskernel.Since theseparametersarenotdiscretevalues,itwasuseda grid-search.Variouspairsof(C,r)valuesweretriedandtheonewith thebestcross-validationaccuracywaspicked.Sincedoinga completegridsearchmaystillbetimeconsuming,Hsu[40]
recommendedtouseacoarsegridfirsttofindthe“bestregion” andtheuseafinergridtosearchthisregion.Itisimportant tonoticethatthethisparametersearchhastobedonefor eachsetofselectedfeatures,i.e.,thereisnoguaranteethat thesameparametersettingwillworkforallsetsofselected features.Forallexperiments,thefeatureswerenormalizedto havezeromeanandunitstandarddeviation.Thisisnecessary toremovescaleeffectscausedbytheuseoffeaturesthathas differentmeasurementscales[41].
Alltheclassifiersweretrainedandevaluatedwiththesame trainingandtestsetsgeneratedbya10foldcross-validation inavailabledataset.Theaccuracy,Se,SpandtheAUCwere calculatedinthe10testssets.Also,itwasassignedtoeach testexampleinthetestsetstwopossibleoutcomes:1 mean-ingthattheclassificationprovidedbytheclassifierwascorrect and0,otherwise.ItallowedustoapplytheCochran’sQtest
[42]todeterminewhethersignificant differencesexistedin theclassificationresults.BesidestheCochran’stest,the McNe-marstest[31]wasappliedbetweeneachpairofclassifiersto findwhethersignificantdifferencesexisted[43].Thesetests wereassumedtobestatisticallysignificantatp<0.05andwere implementedinMatlab7.4.0usingtheStatisticsToolbox6.0.
5.
Results
5.1. Characteristicsofthesubjects
Thebiometricandspirometriccharacteristicsofthestudied subjectsaregiveninTable1.Thebiometriccharacteristicsof thetwostudiedgroupswerewellmatched,andtherewerenot significantdifferencesbetweenthegroups.Ascanbeseenin
Table1,patientswithCOPDpresentedsignificantreductions inthespirometricparameters(p<0.0001).
Table1–Biometricandspirometriccharacteristicsofthe studiedgroups. CG COPD p Age(years) 55.2±16.7 61.4±9.7 ns(0.38) Weight(kg) 65.4±11.8 66.0±8.4 ns(0.84) Height(cm) 162.2±8.9 163.5±7.9 ns(0.58) FEV1(L) 2.8±0.9 1.4±0.7 <0.0001 FEV1(%pred) 107.1±20.3 57.0±27.7 <0.0001 FEF/FVC(%) 100.3±32.3 28.5±18.3 <0.0001 FEV1/FVC(%) 87.9±10.0 55.0±16.7 <0.0001
Table2–selectedfeaturesusingdifferentstrategies.
Searchstrategy Selectedfeatures
Forward fr,Xm,R0,Crs,dyn,|Zrs|
Backward fr,Xm,R0,|Zrs|
Forwardfloating fr,Xm,R0,|Zrs|
5.2. Featureselection
Themostcommonselectedfeaturesusingcorrelationinthe differenttrainingsetswere:(fr,R0,Crs,dyn)and(R0,Crs,dyn).The smallnumberofselectedfeaturesshowsthatparametersare highlycorrelated.Theresultsofthefeatureselectionusing the different search strategies(forward, backward,forward floating)using1-nearestneighborleave-one-outclassification
accuracyas performanceindex are shown inTable 2. The
searchstrategieswereconfiguredtofindthenumberof fea-turesthatgivesthehighestperformance.
5.3. Performanceofthestudiedclassifiersusing differentfeatureselectionmethods
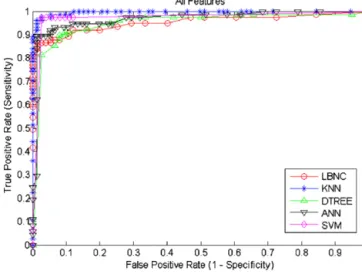
5.3.1. Experiment1—useofallfeatures(FOTparameters)
Fig.1showstheaverageROCcurveforeachclassifier,while
Table3presentstheaverageandthestandarddeviationofthe derivedparameterscalculatedinthe10testfolds,forallofthe studiedclassifiers.Theresultspresentedwereobtainedwith thebestparametersfoundforeachclassifier.
LBNCpresentedthebestaverageSp(1.00),KNNpresented thebestaverageAcc(0.97)andAUC(1.00).Ontheotherhand, SVMpresentedthebestaverageSe(0.97)andAUC(1.00).The applicationoftheCochran testhasshownstatistically sig-nificantdifferenceintheclassifiers,andtheMcNemarstest appliedtoall pairsofclassifiersindicatedthat therewas a statisticallysignificant difference between KNN and LBNC, andbetweenKNNandDTREE.
Fig.1–AverageROCcurveforexperiment1.
Fig.2–AverageROCcurveforexperiment2.
5.3.2. Experiment2—forwardselectionsearch
Thesecondexperimentwascarriedoutusingtheselected fea-tureschosenbytheforwardselectionsearchstrategy(fr,Xm, R0,Crs,dyn,|Zrs|).TheseresultsaredescribedinFig.2,which
showstheaverageROCcurveforeachclassifier,andTable4. Theseresultswereobtainedwiththebestparametersfound foreachclassifier.
Table3–Resultsoftheexperiment1.
Classifier Acc Se Sp AUC
LBNC 0.89±0.07 0.78±0.14 1.00±0.00 0.95±0.05
KNN 0.97±0.04 0.96±0.09 0.99±0.04 1.00±0.00
DTREE 0.90±0.05 0.90±0.08 0.91±0.07 0.95±0.04
ANN 0.93±0.06 0.89±0.12 0.96±0.06 0.97±0.05
SVM 0.96±0.05 0.97±0.05 0.94±0.05 1.00±0.01
LBNC,LinearBayesNormalClassifier;KNN,Knearestneighbor;DTREE,decisiontrees;ANN,artificialneuralnetworks;SVM,supportvector machines;Acc,accuracy;Se,sensitivity;Sp,specificity;AUC,areaundertheROCcurve.
Table4–Resultsoftheexperiment2.
Classifier Acc Se Sp AUC
LBNC 0.90±0.07 0.80±0.13 1.00±0.00 0.96±0.05
KNN 0.95±0.04 0.93±0.09 0.97±0.05 1.00±0.00
DTREE 0.89±0.07 0.88±0.13 0.91±0.09 0.95±0.04
ANN 0.94±0.05 0.92±0.09 0.96±0.07 0.96±0.06
SVM 0.95±0.05 0.95±0.09 0.95±0.07 0.98±0.03
Boldindicatesthebestvaluesofaccuracy,sensitivity,specificityandAUC.
Fig.3–AverageROCcurveforexperiment3.
LBNCpresentedthebestaverageSp(1.00),whileKNN pre-sentedthebestAcc(0.95)andAUC(0.99).SVMpresentedthe bestaverageAcc(0.95)andSe(0.95).Theapplicationofthe Cochrantesthasshownstatisticallysignificantdifference,in theclassifiersandtheMcNemarstestappliedtoallpairsof classifiersindicatedthattherewasastatisticallysignificant
differencebetween:KNNandDTREE.
5.3.3. Experiment3—forwardfloatingselection
The third experiment was carried out using the selected
featureschosenbytheforwardfloatingselectionandthe back-wardsearchstrategiessincebothchosethesamefeatures(fr, Xm,R0,|Zrs|).TheseresultsaredescribedinFig.3,whichshows
theaverageROCcurveforeachclassifier,andTable5. Accordingtotheresults,LBNCpresentsthebestaverage Sp(1.00),KNN presentthebest averageAcc (0.95)and AUC (0.99).Ontheotherhand,SVCpresentsthebestaverageAcc (0.95)andSe(0.94).TheapplicationoftheCochrantesthasnot shownastatisticallysignificantdifference.
Fig.4–AverageROCcurveforexperiment4.
5.3.4. Experiment4—analysisofcorrelationcoefficients
The fourth experiment was carried out using the features (fr, R0, Crs,dyn) selected by the analysis of the
correla-tion coefficients. Theses results are presented in Fig. 4, shows the average ROC curve for each classifier, and
Table6.
Usingthesefeatures,LBNCpresentedthebestaverageSp (1.00), KNN presentedthe best averageAcc (0.95), Se(0.93) andAUC(0.99).TheapplicationoftheCochrantesthasnot shownastatisticallysignificantdifferencebetweenthe clas-sifierresults.
5.3.5. Experiment5—correlationcoefficients
Thefifthexperimentwascarriedoutalsousingthefeatures (R0,Crs,dyn)selectedbytheanalysisofthecorrelation
coeffi-cients.Fig.5showstheaverageROCcurveforeachclassifier, whileTable7showstheassociatedparameters.
Intheseconditions,LBNCpresentedthebestaverageSp (1.00),KNN andANNpresentedthebest averageAcc(0.93),
Table5–Resultsoftheexperiment3.
Classifier Acc Se Sp AUC
LBNC 0.89±0.07 0.78±0.14 1.00±0.00 0.96±0.04
KNN 0.95±0.04 0.92±0.07 0.97±0.06 0.99±0.03
DTREE 0.89±0.07 0.89±0.11 0.89±0.09 0.95±0.05
ANN 0.91±0.08 0.87±0.09 0.95±0.10 0.97±0.06
SVM 0.95±0.05 0.94±0.07 0.95±0.09 0.96±0.05
Table6–Resultsoftheexperiment4.
Classifier Acc Se Sp AUC
LBNC 0.90±0.07 0.80±0.13 1.00±0.00 0.96±0.05
KNN 0.95±0.09 0.93±0.10 0.97±0.09 0.99±0.03
DTREE 0.91±0.08 0.89±0.11 0.93±0.11 0.96±0.05
ANN 0.91±0.05 0.89±0.09 0.93±0.09 0.95±0.05
SVM 0.93±0.11 0.91±0.11 0.94±0.14 0.96±0.07
Boldindicatesthebestvaluesofaccuracy,sensitivity,specificityandAUC.
Table7–Experiment5results.
Classifier Acc Se Sp AUC
LBNC 0.90±0.07 0.80±0.13 1.00±0.00 0.97±0.05
KNN 0.93±0.05 0.91±0.09 0.96±0.07 0.99±0.01
DTREE 0.90±0.07 0.91±0.09 0.89±0.15 0.95±0.05
ANN 0.93±0.05 0.91±0.09 0.94±0.07 0.97±0.04
SVM 0.91±0.07 0.82±0.14 1.00±0.00 0.97±0.04
Boldindicatesthebestvaluesofaccuracy,sensitivity,specificityandAUC.
Fig.5–AverageROCcurveforexperiment5.
KNN, DTREEand ANNpresentedthe bestaverage Se(0.91)
andKNN presentedthebest AUC(0.99).Theapplicationof
theCochrantesthasnotshownastatisticallysignificant dif-ferencebetweentheclassifierresults.
5.4. Searchforthebestclassifierparameters
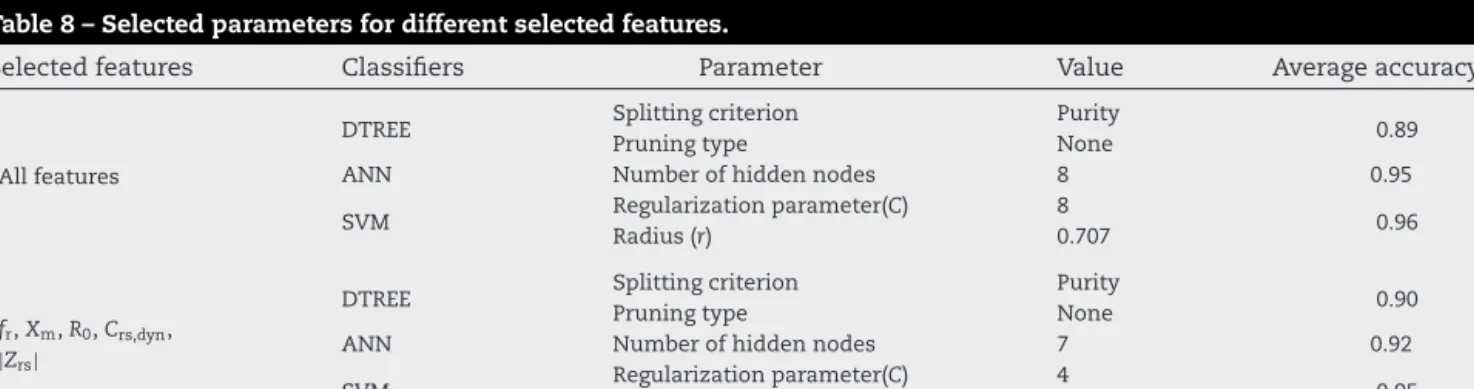
Tables8and9showthebestparametersforeachclassifierand theiraverageaccuracies.
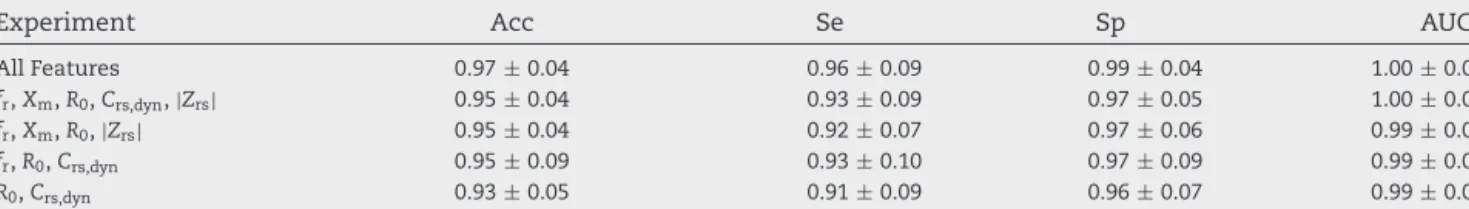
5.5. PerformanceoftheKNNclassifiersusingdifferent featureselectionmethods
Table10liststheresultsachievedbyKNNinallofthe experi-ments.
6.
Discussion
ThepurposeofthepresentstudywastodevelopanML sys-tem classifierthatmaycontributetoeasythediagnosticof COPD usingFOT measurements. Althoughprevious confer-ence papershaveinvestigatedthepotentialofANNtoeasy the diagnostic ofCOPD using IOS [16,17] and FOT [20], to the authors’knowledge,this isthefirst study dedicatedto compare the performanceof several MLalgorithms in the developmentofanautomaticclassifiertohelpthediagnostic ofCOPDusingFOTmeasurements.Morespecifically,we inves-tigatedtheperformanceoftheLBNC,KNN,DTREE,ANNand SVMalgorithms.Wealsoperformedaninputfeatureselection inorder tofind thesmallestnumberofrelevantand infor-mativefeaturesthatcanresultinasatisfactoryperformance
Table8–Selectedparametersfordifferentselectedfeatures.
Selectedfeatures Classifiers Parameter Value Averageaccuracy
Allfeatures
DTREE SplittingPruningtypecriterion PurityNone 0.89
ANN Numberofhiddennodes 8 0.95
SVM Regularizationparameter(C) 8 0.96
Radius(r) 0.707
fr,Xm,R0,Crs,dyn,
|Zrs|
DTREE Splittingcriterion Purity 0.90
Pruningtype None
ANN Numberofhiddennodes 7 0.92
Table9–selectedparametersfordifferentselectedfeatures.
Selectedfeatures Classifiers Parameter Value Averageaccuracy
fr,Xm,R0,|Zrs|
DTREE SplittingPruningtypecriterion PurityNone 0.89
ANN Numberofhiddennodes 3 0.90
SVM Regularizationparameter(C) 22.627 0.94
Radius(r) 0.42
fr,R0,Crs,dyn
DTREE Splittingcriterion Purity 0.92
Pruningtype None
ANN Numberofhiddennodes 3 0.92
SVM RegularizationRadius(r) Parameter(C) 80.5 0.95
R0,Crs,dyn
DTREE Splittingcriterion Purity 0.89
Pruningtype None
ANN Numberofhiddennodes 3 0.91
SVM Regularizationparameter(C) 0.25 0.91
Radius(r) 1
Table10–ComparisonsoftheresultsachievedbyKNNinalloftheexperiments.
Experiment Acc Se Sp AUC
AllFeatures 0.97±0.04 0.96±0.09 0.99±0.04 1.00±0.00
fr,Xm,R0,Crs,dyn,|Zrs| 0.95±0.04 0.93±0.09 0.97±0.05 1.00±0.00
fr,Xm,R0,|Zrs| 0.95±0.04 0.92±0.07 0.97±0.06 0.99±0.03
fr,R0,Crs,dyn 0.95±0.09 0.93±0.10 0.97±0.09 0.99±0.03
R0,Crs,dyn 0.93±0.05 0.91±0.09 0.96±0.07 0.99±0.01
[30].Finally, wecomparedtheperformanceofclassifiersin ordertoevaluatethemostadequatemethodtodetectCOPD.It hasbeenshownthat,ingeneral,allofthestudiedalgorithms wereabletoadequatelydetect COPD.However,it is impor-tanttopointoutthatsomeclassifierwillperformthiswork betterthanothers.Interestingly,thefeatureselectionallowed thereductionoftheusedfeatureswithoutasignificant reduc-tioninperformance.Furthermore,ROCanalysisshowedthat particularlythreeofthestudiedalgorithmspresentedagreat potentialtocontributetotheautomaticdetectionofthe res-piratoryeffectsofCOPDinaclinicalsetting.
TheanalysisofROCcurvesisperformedbyplotting sensi-tivityversus1-specificityforeachpossiblecut-offlevel.This way,thelargertheareaunderthecurve(AUC),themorevalid thediagnostictestis.Thisparameterhastheclinicallyuseful interpretationofrepresentingtheprobabilityofcorrectly dis-criminatingbetweentwosubjectsinarandomlyselectedpair ofabnormalandnormalsubjects[44,45].Accordingtothe lit-erature,ROCcurveswithAUCsbetween0.50and0.70indicate lowdiagnosticaccuracy,AUCsbetween0.70and0.90indicate moderateaccuracy,andAUCsbetween0.90and1.00indicate highaccuracy[46,47].
Takingintoconsiderationthesevalues,allofthestudied classifiersreachedhighlevelsofaccuracywhenallfeatures wereused(experiment1,Fig.1andTable2).KNNwasthemost adequate algorithmtocorrectly identify COPD(AUC=1.00), followedbySVM(AUC=1.00)andANN(AUC=0.97).Statistical comparisonsshowedthatKNNwassignificantlybetterthan LBNCandDTREE.
Theresultsobtainedusingthefiveselectedfeatures cho-senbytheforwardselectionsearchstrategy,describedinFig.2
and Table4,were coherent withthatobtained usingall of thesevenfeatures,showingthatKNNwasthemostadequate algorithmtocorrectlyidentifyCOPD(AUC=1.00),followedby
SVM(AUC=0.98)andANN(AUC=0.96).Oncegain,statistical comparisonsshowedabetterperformanceoftheKNNwhen comparedwithDTREE.
Althoughwecouldnotobservestatisticallysignificant dif-ferencesamongtheperformanceoftheclassifiers,theKNN algorithmalsopresentedthehighestvalueofAUC(0.99) con-sideringtheresultsobtainedusingthefourselectedfeatures chosenbythe forwardfloatingselectionand thebackward search strategies. Theseresults are describedin Fig.3 and
Table7.TheperformanceoftheKNNwasfollowedbyANN (AUC=0.97) and SVM and LBNC (AUC=0.96). These results were similartothat observedfurtherreducing the number ofusedfeatures(Fig. 4andTable 6), whichwasconducted usingthreefeaturesselectedbytheanalysisofthecorrelation coefficients.
Inthelastexperiment,conductedusingonlytwofeatures selectedbytheanalysisofthecorrelationcoefficients(Fig.5
andTable7),KNNwasalsotheclassifierwiththehighestAUC (0.99).However,inthisexperiment,onecannotsaythata par-ticularclassifierdominatestheothers.Differentsectionsof thecurvearedominatedbydifferentclassifiers(Fig.5).
RecommendationsforresearchinCOPD[48]includethe need for improved noninvasive mechanical tests of lung function.Thepresentstudywasconductedasaneffortto con-tributeinthisdirection,andshowedthatFOTmeasurements, integratedwithmachinelearningalgorithms,mayconstitute averypromisingsystemabletonon-invasivelyandaccurately diagnoseCOPD.WeobservedhighvaluesofAUCinallofthe classifiersandfeaturesstudied,andthattherearestatistically significantdifferencesinthefirstexperimentbetweenKNN and LBNC,KNN andDTREE,and inthesecond experiment betweenKNNandDTREE.Itmeansforallothercasesonecan use anyofthefiveclassifiers.However,ifonelooksonthe averagevaluesoftheperformancemeasures(Tables3–7),the
classifiersthatperformedbestinallexperimentswereKNN andSVM.Theywere followedbytheANNandthen bythe LBNCandDTREE.Infact,KNNwasthemostadequate clas-sifiertousetocorrectlyidentifytherespiratorymodifications inthestudiedCOPDpatients.
AlthoughtheFOTmaybeveryusefulinclinicalpractice, thistechniquehasnotbeenwidelyusedinthemedical com-munityduetothelackofspecificity,whichisassociatedwith thebiasfromtheupperairwayshunt.Itisinterestingtonote thattheuseofmachinelearningalgorithmsresultedinvery accurateresults (Tables3–7 and 10). Webelieve that these resultsmayhelptoincreasetheacceptationoftheFOTinthe medicalcommunity.
Thefiveexperimentswere madeusingdifferent feature selectionmethods.Noneofthemprovidedbetterresultsthan theexperimentthatuseallfeatures,i.e.,allFOTparameters. Thismeansthatall FOT parametersarerelevant. However, byanalyzingtheexperimentsthatselectedspecificfeatures, onecanobserve arankbetween theFOT parameters. This can beshown in Table10 which lists the results achieved byKNN in all the experiments. Thesmall decrease inthe performancemeasurementsindicates thatfr, R0,Crs,dyn are
themostimportantparameters.Thisagreeswiththeanalysis ofthecorrelationcoefficients. Theuseoffewerparameters (fr, R0, Crs,dyn or R0,Crs,dyn)simplifies theanalysis and still
keepahighdegreeofaccuracy.
Inrelationtothespeed,itknownthatKNNisverypowerful andveryfasttobuild,butitcantakealongtimetoperform aclassificationif thetrainingset islarge[21]. Sinceinthis casethedatasetissmall,theKNNdidnottakelongto per-formaclassification.TheSVMclassifierpresentsverygood results.Itisveryfasttotrainandtoperformthe classifica-tion.TheANNtakesalongtimetobuildaclassifierdueto thetrainingprocedures,butitisveryfasttoperforma clas-sification.Italsodoesnotprovideanyexplanationonhowit achievedtheclassification.Theclassifiersthatpresentmore interpretableresults(LBNCandDTREE)haveverysimilar per-formance.TheDTREEsufferedfromthefactthatthefeatures arehighlycorrelated.Intheauthor’sopinion,consideringthe trade-offamongaccuracy,thetimetobuild,totrain,andthe timetoperformaclassification,ifweusealltheFOT param-eters,theKNNisthemostappropriatechoice.Itallowsusto achieveahighdegreeofaccuracyandanintuitive interpreta-tionoftheclassification.Inthiscase,theexamundertestis classifiedasnormalorCOPDaccordingtothetrainingsetthat isclosesttoit.Thisclassifierisalsoagoodchoiceifwewant touseonlytwoparameters,asdescribedinSection5.3.5.
Itisimportanttopointoutthatthefeatureselectionand associatedresultsofthisstudyarespecificfortheCOPD.Other diseaseswillresultindifferentchangesintherespiratory sys-temand,thus,otherparametersmaybebettersuitedtothe identificationoftherespiratorychanges.Eveninpure emphy-sema,whichisadiseaseassociatedwithCOPD,theauthors recommendthatasimilarstudybeconductedandthe opti-mizedconditionsareobtainedandused.
7.
Conclusions
Inthispaper, wedesignedandevaluated severalclassifiers systemsandfeatureselectionmethodstodevelopaclinical
decisionsupportsystemtohelpthediagnosticofCOPDusing FOTmeasurements.KNN,SVMandANNclassifierswerethe mostadequate,reachingvaluesthatallowaveryaccurate clin-icaldiagnosis.Theseclassifiersallowedtheidentificationof therespiratorymodificationswithaminimumsensitivityof 87%andaminimumspecificityof94%.Theuseofthe analy-sisofcorrelationasarankingindexoftheFOTparameters, allowedustosimplify theanalysisofthe FOT parameters, whilestillmaintainingahighdegreeofaccuracy.
8.
Future
plans
Basedonthesepromisingresults,futureworkincludesthe fol-lowinggoals:(1)toaddtotheclassificationsystemtheability ofidentifyingthelevelofairflowobstructioninCOPD(mild, moderateorsevere);(2)toapplythismethodologyinthe detec-tionofearlysmoking-inducedrespiratorychanges,and(3)to contributetothediagnosisofairwayobstructioninasthma.
Conflict
of
interest
Nonedeclared.
Acknowledgements
The authors would like to thankJosiel G. Santosfor their technical assistance. The Brazilian Council for Scientific and TechnologicalDevelopment (CNPq)and Riode Janeiro StateResearchSupportingFoundation(FAPERJ)supportedthis study.
r
e
f
e
r
e
n
c
e
s
[1] Theglobalinitiativeforchronicobstructivelungdisease. Availablefrom:<http://www.goldcopd.com>(accessed March2011).
[2] WorldHealthOrganization.Availablefrom:
<http://www.who.int/respiratory/copd/burden/en/index.html> (accessedMarch2011).
[3] P.L.Enright,R.M.Crapo,Controversiesintheuseof spirometryforearlyrecognitionanddiagnosisofchronic obstructivepulmonarydiseaseincigarettesmokers,Clin. ChestMed.21(4)(2000)645–652.
[4] L.Ljung,SystemIdentification:TheoryfortheUser, Prentice-HallInc.,Londres,1987.
[5] A.B.Dubois,A.W.Brody,D.H.Lewis,B.F.BurgesJr., Oscillationmechanicsoflungsandchestinman,J.Appl. Physiol.8(1956)587–594.
[6] A.C.D.Faria,A.J.Lopes,J.M.Jansen,P.L.Melo,Evaluatingthe forcedoscillationtechniqueinthedetectionofearly smoking-inducedrespiratorychanges,Biomed.Eng.Online 25(2009)8–22.
[7] A.J.Orr,D.R.Westenskow,Abreathingcircuitalarmsystem basedonneuralnetworks,J.Clin.Monit.10(1994)101–109. [8] P.Bright,M.R.Miller,J.A.Franklyn,M.C.Sheppard,Theuseof
aneuralnetworktodetectupperairwayobstructioncaused bygoiter,Am.J.Respir.Crit.CareMed.157(1998)1885–1891. [9] M.A.Leon,J.Räsänen,D.Mangar,Neuralnetwork-based
detectionofesophagealintubation,Anesth.Analg.78(1994) 548–553.
[10] J.Räsänen,M.A.León,Detectionoflunginjurywith conventionalandneuralnetwork-basedanalysisof continuousdata,J.Clin.Monit.14(1998)433–439.
[11] G.Perchiazzi,M.Högman,C.Rylander,R.Giuliani,T.Fiore,G. Hedenstierna,Assessmentofrespiratorysystemmechanics byartificialneuralnetworks:anexploratorystudy,J.Appl. Physiol.90(2001)1817–1824.
[12] U.Uncü,Evaluationofpulmonaryfunctiontestsbyusing fuzzylogictheory,J.Med.Syst.34(3)(2010)241–250. [13] A.J.Lopes,D.Capone,R.Mogami,R.S.Lanzillotti,P.L.Melo,
J.M.Jansen,Severityclassificationforidiopathicpulmonary fibrosisbyusingfuzzylogic,Clinics66(6)(2011)1015–1019. [14] A.M.G.T.DiMango,A.J.Lopes,J.M.Jansen,P.L.Melo,Changes
inrespiratorymechanicswithdegreesofairwayobstruction inCOPD:detectionbyforcedoscillationtechnique,Respir. Med.100(3)(2006)399–410.
[15] C.Ionescu,E.Derom,R.DeKeyser,Assessmentof respiratorymechanicalpropertieswithconstant-phase modelsinhealthyandCOPDlungs,Comput.Methods ProgramsBiomed.97(1)(2010)78–85.
[16] M.Barúa,H.Nazeran,P.Nava,V.Granda,B.Diong, Classificationofpulmonarydiseasesbasedonimpulse oscillometricmeasurementsoflungfunctionusingneural networks,in:Conf.Proc.IEEEEng.Med.Biol.Soc.,2004,pp. 3848–3851.
[17] M.Barúa,H.Nazeran,P.Nava,B.Diong,M.Goldman, Classificationofimpulseoscillometricpatternsoflung functioninasthmaticchildrenusingartificialneural networks,in:Conf.Proc.IEEEEng.Med.Biol.Soc.,2005, pp.327–331.
[18] D.Macleod,M.Birch,Respiratoryinputimpedance measurements:forcedoscillationmethods,Med.Biol.Eng. Comput.39(2001)505–516.
[19] J.Hellinckx,M.Cauberghs,K.DeBoeck,M.Demedts, Evaluationofimpulseoscillationsystem:comparisonwith forcedoscillationtechniqueandbodyplethysmography,Eur. Respir.J.18(2001)564–570.
[20] J.L.M.Amaral,A.C.D.Faria,A.J.Lopes,J.M.Jansen,P.L.Melo, Automaticidentificationofchronicobstructivepulmonary diseasebasedonforcedoscillationmeasurementsand artificialneuralnetworks,in:32ndAnnualInternational ConferenceoftheIEEEEngineeringinMedicineandBiology Society,BuenosAires,Argentina,2010.
[21] L.I.Kuncheva,CombiningPatternClassifiers:Methodsand Algorithms,Wiley-Interscience,2004.
[22] R.O.Duda,P.E.Hart,D.G.Stork,PatternClassification, Wiley-Interscience,2000.
[23] P.N.Tan,M.Steinbach,V.Kumar,IntroductiontoData Mining,UniversityofMinnesotaPublisher,Addison-Wesley Copyright,2006.
[24] I.H.Witten,E.Frank,DataMining:PracticalMachine LearningToolsandTechniques,2nded.,MorganKaufmann, 2005.
[25] S.Haykin,NeuralNetworksaComprehensiveFoundation, MacmillanCollegePublishingCompany,EnglewoodCliffs, 1994.
[26] V.N.Vapnik,TheNatureofStatisticalLearningTheory,2nd ed.,Springer,NewYork,2000.
[27] G.P.Zhang,Neuralnetworksforclassification:asurvey,IEEE Trans.Syst.ManCybern.C:Appl.Rev.30(2000)451–462. [28] C.E.Pedreira,L.Macrini,M.G.Land,E.S.Costa,Newdecision
supporttoolfortreatmentintensitychoiceinchildhood acutelymphoblasticleukemia,IEEETrans.Inf.Technol. Biomed.13(2009)284–290.
[29] M.H.Goldbaum,P.A.Sample,K.Chan,J.Williams,T.-W.Lee, E.Blumenthal,C.A.Girkin,L.M.Zangwill,C.Bowd,T. Sejnowski,R.N.Weinreb,Comparingmachinelearning classifiersfordiagnosingglaucomafromstandard automatedperimetry,Invest.Ophthalmol.Vis.Sci.43(1) (2002)162–169.
[30] I.Guyon,A.Elisseeff,Anintroductiontovariableandfeature selection,J.Mach.Learn.Res.3(2003)1157–1182.
[31] D.T.Dietterich,Approximatestatisticaltestsforcomparing supervisedclassificationlearningalgorithms,Neural Comput.10(1998)1895–1923.
[32] T.Fawcett,Anintroductiontorocanalysis,PatternRecogn. Lett.27(8)(2006)861–874.
[33] P.Refaeilzadeh,L.Tang,H.Liu,CrossValidation, EncyclopediaofDatabaseSystems,Springer,2009. [34] J.Demsar,Statisticalcomparisonsofclassifiersover
multipledatasets,J.Mach.Learn.Res.7(2006)1–30. [35] J.V.Cavalcanti,A.J.Lopes,J.M.Jansen,P.L.Melo,Detectionof
changesinrespiratorymechanicsduetoincreasingdegrees ofairwayobstructioninasthmabytheforcedoscillation technique,Respir.Med.100(12)(2006)2207–2219. [36] P.L.Melo,Newimpedancespectrometerforscientificand
clinicalstudiesontherespiratorysystem,Rev.Sci.Instrum. 71(7)(2000)2867–2872.
[37] P.L.Melo,M.M.Werneck,A.Giannella-Neto,Influenceofthe pressuregeneratornon-linearitiesintheaccuracyof respiratoryinputimpedancemeasuredbyforcedoscillation, Med.Biol.Eng.Comput.38(2000)102–108.
[38] A.C.D.Faria,A.J.Lopes,J.M.Jansen,P.L.Melo,Assessmentof respiratorymechanicsinpatientswithsarcoidosisusing forcedoscillation:correlationswithspirometricand volumetricmeasurementsanddiagnosticaccuracy, Respiration78(1)(2009)93–104.
[39] R.P.W.Duin,P.Juszczak,P.Paclik,E.Pekalska,D.deRidder, D.M.J.Tax,S.Verzakov,PRTools4.1,AMatlabToolboxfor PatternRecognition,DelftUniversityofTechnology, 2007.
[40] C.W.Hsu,C.C.Chang,C.J.Lin,Apracticalguidetosupport vectorclassification.Availablefrom:
<www.csie.ntu.edu.tw/∼cjlin/papers/guide/guide.pdf> (accessedOctober2010).
[41] W.L.Martinez,A.R.Martinez,ExploratoryDataAnalysiswith MATLAB,CRCPress,2005.
[42] W.J.Conover,PracticalNonparametricStatistics,3rded., Wiley,1999.
[43] S.J.Delany,P.Cunningham,L.Coyle,Anassessmentof case-basedreasoningforspamfiltering,Artif.Intell.Rev.24 (3)(2005)359–378.
[44] J.A.Hanley,B.J.McNeil,Themeaninganduseofthearea underareceiveroperatingcharacteristic(ROC)curve, Radiology143(1982)29–36.
[45] J.A.Swets,R.M.Picket,Evaluationofdiagnosticsystems: methodsfromsignaldetectiontheory,Med.Phys.10(2) (1983)266–267.
[46] J.A.Swets,Measuringtheaccuracyofdiagnosticsystems, Science240(1988)1285–1293.
[47] R.Golpe,A.Jiménez,R.Carpizo,J.M.Cifrian,Utilityofhome oximetryasascreeningtestforpatientswithmoderateand severesymptomsofobstructivesleepapnea,Sleep22(7) (1999)932–937.
[48] T.L.Croxton,G.G.Weinmann,R.M.Senior,J.R.Hoidal,Future researchdirectionsinchronicobstructivepulmonary disease,Am.J.Respir.Crit.CareMed.165(2002) 838–844.