UNIVERSITÀ DEGLI STUDI DI TRENTO
Department of Mathematics
Ph.D. in Mathematics
XXX CYCLE
The influence of the inclusion of biological
knowledge in statistical methods to integrate
multi-omics data
Supervisor:
Ph.D. student:
Prof. Corrado Priami
Giulia Tini
Co-supervisors:
Dr. Marie Pier Scott-Boyer
Dr. Luca Marchetti
È passato del tempo, sembra sia stato un lampo, eravamo ragazzi e ora eccoci qua con le crisi del caso e gli occhiali sul naso e un’idea più realista di felicità.
Table of contents
List of figures ix
List of tables xi
Preface xiii
1 Introductıon 1
1.1 The "Omics Revolution" . . . 1
1.2 Linear and simultaneous integration: challenging the central dogma of biology 4 1.2.1 Linear multi-omics integration . . . 4
1.2.2 Simultaneous multi-omics integration . . . 5
1.3 Statistical multi-omics data integration . . . 6
1.3.1 Latent variable factorization . . . 7
1.3.2 Network-based methods . . . 8
1.4 Application of multi-omics integration to real data . . . 10
1.4.1 Multi-omics data integration challenges . . . 10
1.4.2 Biological questions approached by multi-omics integration . . . . 11
1.5 DNA methylation . . . 12
2 A linear supervised three-omics integration study on human adipogenesis 17 2.1 Introduction . . . 18
2.2 Methods . . . 21
2.2.1 Study design . . . 21
2.2.2 Fructose treatment of SGBS cells . . . 21
2.2.3 Adipocytes omics data analysis . . . 22
2.2.4 Multi-omics data integration . . . 24
2.3 Results . . . 26
2.3.1 Integration of DNA methylation and gene expression during adipocyte differentiation . . . 26
2.3.2 Gene location of methylated regions . . . 31
2.3.3 Integration of methylation, gene and protein expression changes in fully differentiated adipocytes . . . 32
2.3.4 Pathways enrichment analysis . . . 33
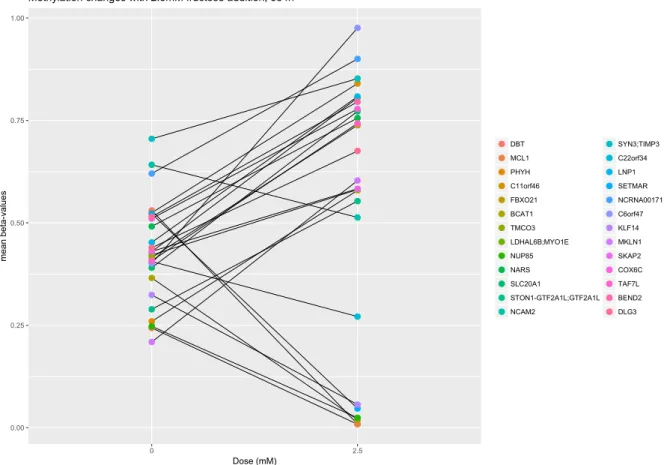
2.3.5 Influence of fructose on DNA methylation . . . 36
2.4 Discussion . . . 39
2.4.1 DMRs in control conditions . . . 39
2.4.2 Fructose effect on methylation . . . 40
2.4.3 Integration of methylation, gene expression and proteomics . . . . 41
2.5 Conclusion . . . 42
2.6 Supplementary material . . . 42
3 Comparison of simultaneous and unsupervised clustering methodologies 51 3.1 Introduction . . . 52 3.2 Datasets . . . 56 3.2.1 Real datasets . . . 56 3.2.2 Simulated datasets . . . 57 3.3 Methods . . . 59 3.4 Results . . . 62 3.4.1 Simulated scenarios . . . 62 3.4.2 Real datasets . . . 64
3.4.3 Influence of parameter training . . . 67
3.4.4 Influence of multiclass classification and experimental design . . . 69
3.5 Discussion . . . 70
3.6 Conclusion . . . 73
3.7 Supplementary material . . . 73
4 Addition of prior knowledge for multi-omics sample classification 87 4.1 Introduction . . . 88
4.2 Methods . . . 90
4.2.1 Prior knowledge computation . . . 90
4.2.2 Prior knowledge inclusion . . . 93
4.2.3 Datasets and simulations . . . 95
4.3 Results and Discussion . . . 97
4.3.1 Effect of prior-knowledge inclusion . . . 97
4.3.2 Effect of data-driven computation of inter-omics relationship . . . . 99
Table of contents vii
5 Discussion 107
Appendix A Overview of multi-omics integration statistical methods 113
List of figures
1.1 Central dogma of molecular biology . . . 3
1.2 Alternative hypoteses of biological data interactions . . . 5
1.3 Scheamtic representation of DNA methylation . . . 13
2.1 Integration of the three omics datasets . . . 20
2.2 DNA methylation and gene expression integration . . . 25
2.3 DNA methylation patterns during differentiation . . . 27
2.4 DNA methylation changes for DMRs common to 192 and 384 hours . . . . 28
2.5 DNA methylation changes for DMRs returning to baseline after 192 hours . 30 2.6 DNA methylation changes at 384 hours for 2.5mM fructose addition . . . . 37
3.1 Graphical overview of the multi-omics integration methods comparison . . 55
3.2 Visualization of the simulated scenarios . . . 58
3.3 Comparison of the integration methods on the simulated scenarios . . . 63
3.4 Comparison of the integration methods on the real datasets . . . 66
3.5 Comparison of SNF results with and without training the parameters . . . . 68
3.6 PCA visualization of the BXD dataset . . . 75
3.7 PCA visualization of the Platelet Reactivity dataset . . . 76
3.8 PCA visualization of the Breast Cancer dataset . . . 77
3.9 PCA visualization of the simulated scenario A . . . 78
3.10 PCA visualization of the simulated scenario B . . . 79
3.11 PCA visualization of the simulated scenario C . . . 80
3.12 PCA visualization of the simulated scenario D . . . 81
3.13 PCA visualization of the simulated scenario E . . . 82
3.14 Comparison of the integration methods (accuracy) on the simulated scenarios 83 3.15 Comparison of the integration methods (accuracy) on the real datasets . . . 85
4.1 Graphical overview of the prior-knowledge addition pipeline . . . 91
4.3 Averaged F-score for Simulation 1 . . . 99
4.4 Minkowski distances effect on simulated scenario C . . . 100
4.5 Minkowski distances effect on simulated scenario D . . . 101
4.6 Minkowski distances effect on simulated scenario E . . . 101
4.7 Distribution of weights generated from the prior-knowledge network (Simu-lation 2) . . . 103
List of tables
1.1 Summary of omics data types . . . 2
2.1 Summary of the study design . . . 21
2.2 Results of integration of gene expression and DNA methylation . . . 26
2.3 DAVID pathway analysis of DMRs common to 192 and 384 hours . . . 29
2.4 DAVID pathway analysis of DMRs returning to baseline after 192 hours . . 31
2.5 Up and down changes of Gene Expression and Methylation by location . . 32
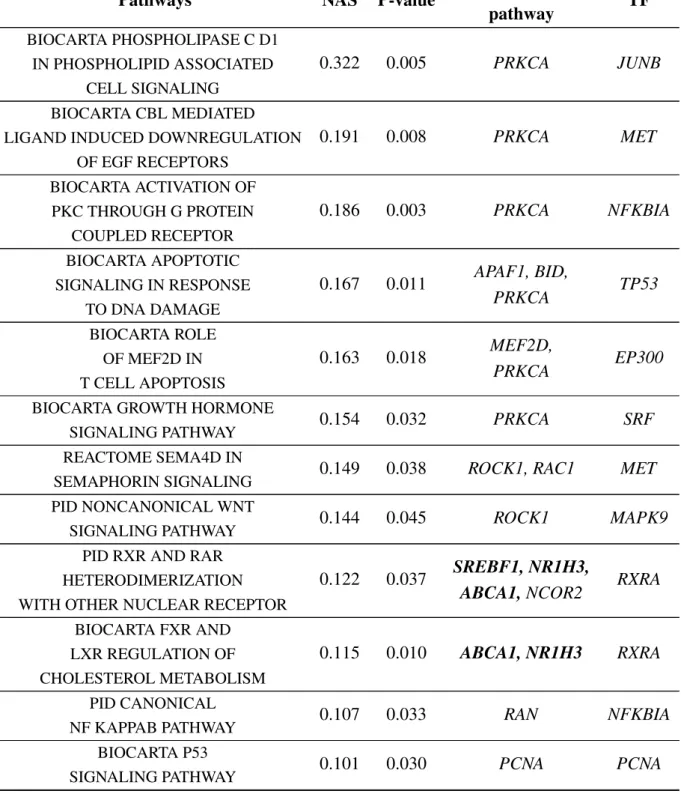
2.6 Significant NASFinder pathways at 384 hours . . . 34
2.7 Genome-wide DMRs in varying fructose concentrations . . . 37
2.8 DMRs location on the genes (384 hours, 2.5mM fructose) . . . 38
2.9 DAVID pathway analysis of DMRs (384 hours, 2.5mM fructose) . . . 38
2.10 Information about genes methyalted/expressed at 192 and 384 hours . . . . 43
2.11 Information about genes methyalted/expressed at 192 but not at 384 hours . 47 2.12 Most significant pathways from DEGs showing protein changes at 384h . . 50
3.1 Summary of multi-omics integration methods . . . 54
3.2 Overview of integrated real datasets . . . 56
3.3 Number of features before and after feature selection step . . . 60
3.4 Spearman correlation among different omics in the BXD dataset . . . 75
3.5 Spearman correlation among different omics in the Platelet dataset . . . 76
3.6 Spearman correlation among different omics in the BRCA dataset . . . 77
3.7 Spearman correlation among different omics in the simualted scenario A . . 78
3.8 Spearman correlation among different omics in the simulated scenario B . . 79
3.9 Spearman correlation among different omics in the simulated scenario C . . 80
3.10 Spearman correlation among different omics in the simulated scenario D . . 81
Preface
This thesis summarizes my research in the field of multi-omics data integration as a Ph.D. student at the Department of Mathematics of the University of Trento and at The Microsoft Research - University of Trento Centre for Computational and Systems Biology (COSBI). Multi-omics data integration is a multi-disciplinary field, which revolutionised Bioinfor-matics in the last decades. Its aim is analysing and interpreting information coming from multiple molecular layers, namely genomics, epigenomics, transcriptomics, proteomics, metabolomics and microbiomics, comprehensively called "omics". The accumulation of these data, generated with advanced high-throughput techniques, provides information on important biological processes. For instance, multi-omics diagnostics is nowadays considered crucial for the improvement of medical and healthcare services and for the implementation of preventive and precision medicine. The biological and medical relevance of studying multiple molecular layers together is proved by the elevate number of articles which contain the text "multi omics" in their abstract. From the PubMed repository for biomedical literature, more than 1000 papers referred to "multi omics" in the last ten years, with more than 300 of them also linked, for instance, to "cancer". However, the huge quantity of available omics data must be analysed with comprehensive systems: statistical and computational techniques are essential tools to obtain prognostic, diagnostic, and therapeutic information [248]. Addi-tionally, mathematical approaches have been developed in the last years to simultaneously model information based on not evident/not yet studied inter-omics interactions. Those methods have proven to be powerful to combine omics data, although they do not use prior information on omics relationships.
For this reason, this thesis mainly focuses on the interplay of mathematical tools and prior knowledge about omics interactions, which are essential in the development of the multi-omics integration field and its applications. Specifically, the goal of the work described here is to show that, at least on simulated datasets, statistical multi-omics integration has better performances when both known and unknown inter-omics interactions are included in the analysis. Since prior knowledge of inter-omics interactions is not always available, we will compute it from the data with the use of multivariate statistics and networks. This thesis
deals in particular with three-omics data integration but the methodologies developed here can be easily applied to an higher number of omics.
The thesis is organized in chapters which explore increasingly complex approaches to multi-omics data integration. Specifically, I will present: a three-omics integration where inter-omics interactions are known, a study on completely unsupervised simultaneous inte-gration and, finally, a model where known and unknown interactions are considered together. Although the biological questions addressed in the chapters of the thesis are different, it is im-portant to consider that the biological phenomena are connected: increased knowledge about molecular mechanisms, for example, can lead to more accurate separation of patients/samples with similar medical responses. Chapters 2, 3 and 4 detail projects I contributed to during the last years and that resulted in publication or manuscripts in preparation.
Chapter 1: we provide here an overview of the main hypothesis (linear and simultaneous) of biological interactions between omics data. Additionally, this Chapter presents the state of the art statistical approaches developed to solve multi-omics integration.
Chapter 2: we test here the importance of considering known linear inter-omics relations. We combine DNA methylation, gene expression and protein levels to study adipogenesis, the process of creation and growth of adipocytes. Prior knowledge about biomolecule connections reduce the amount of data to be analysed. This leads to the observation of coordinated changes at the epigenomic, transcriptomic and proteomic levels, showing how information flows from one molecular layer to the others. Although this biological linear integration provides new insights in the adipogenic process, we consider only known omics interactions to perform it. The content of this Chapter was developed in collaboration with the Nestlé Institute of Health Science and the U.S. Food and Drug Administration, and is part of a paper under preparation:
• G. Tini, V. Varma, R. Lombardo, G. Lefebvre, P. Descombes, S. Métairon, C. Priami, J. Kaput, M.P. Scott-Boyer, "DNA methylation during human adipogenesis and the impact of fructose", preprint.
Chapter 3: here we move to a simultaneous perspective of multi-omics integration. We focus on unsupervised methodologies, which are able to model also unknown interactions between different data types. To understand more about this approach, we compare differ-ent unsupervised methodologies on sample classification problem. We consider both real and simulated datasets. We explore the impact of several factors that are shown to affect simultaneous integration results (method choice, presence of noise, number of integrated
xv
data, applied pre-processing). The content of this Chapter has been published in the journal
Briefings in Bioinformatics:
• G. Tini, L. Marchetti, C. Priami, M.P. Scott-Boyer, "Multi-omics integration - a comparison of unsupervised clustering methodologies",Briefings in Bioinformatics, November 2017.
Chapter 4: we present here a pipeline whose aim is to combine the strengths of the simulta-neous and the linear approaches, in order to solve sample classification. While the use of prior knowledge is useful to focus on known biological interactions, simultaneous methods allow the inclusion in the analysis of unknown omics relations that would be missed otherwise. The accuracy of simultaneous multi-omics data integration is improved, on simulated datasets, by the prioritization of important features. This step is performed with a multivariate linear regression method followed by the creation of a prior-knowledge network. The results obtained in this Chapter indicate that the inclusion of prior knowledge increases the power of integration methodologies.
• This work is the result of my internship at the Nestlé Institute of Health Science in Lausanne, Switzerland.
Chapter 5: in this Chapter we summarize the main results of the thesis and discuss possible future directions.
Chapter 1
Introductıon
In this Chapter we introduce the problem of multi-omics data integration. We first provide a brief overview of the different types of omics data, with a more detailed focus on DNA methylation, type of data discussed in Chapter 2. We present the different hypotheses of inter-omics interplay that will be used throughout the thesis, together with the main approaches to multi-omics data integration that are based on those hypotheses. We finally provide the state-of-the-art models that have been developed to solve the main questions and challenges of multi-omics data integration.
1.1
The "Omics Revolution"
The addition of the suffix "omics" to a molecular term connotes the comprehensive assessment of a set of molecules (like genes or proteins) [73] which contain part of the information related to the biological system under study. In their work, Hasinet. alwell summarized the different omics data that can be assessed for the same experiment [73], namely genomics, epigenomics, transcriptomics, proteomics, metabolomics and microbiomics (see Table 1.1 for a more detailed description of those data).
In early studies, the omics collected in Table 1.1 have been investigated in isolation to look for their association with a phenotypic trait of interest. This approach, however, does not consider the interactions between different biomolecules, acknowledged by the central dogma of molecular biology. This theory, proposed by Francis Crick in 1970 [39] describes the flow of genetic information from DNA to RNA to proteins that occurs in a biological system and leads to the determination of cellular phenotypes (Figure 1.1).
T able 1.1 Omics data types that can be collected from the same experiment. F or each omics the correspondent molecular le v els and the description of what the omics assess are pro vided. Additionally , the platforms used to measure the molecula r le v els are added. NGS: Ne xt Generation Sequencing; MS: Mass Spectrometry; RRBS: Reduced Representation Bisulfite Sequencing. Omics Molecular le v el Description Platf orms Genomics Genetic v ariants Identification of genetic v ariants associated with the phenotype genotype arrays [221 ]; NGS [217 ]; exome sequencing [158 ] Epigenomics DN A meth ylation; histone acetylation Genome-wide assessment of re v ersible modification of DN A which do not v ary nucleic basis sequence NGS [217 ] RRBS [136 ] T ranscriptomics mRN A; miRN A; long non-coding RN A Genome-wide qualitati v e (which transcripts are present) and quantitati v e (le v els of expression) assessment of RN A le v els NGS [217 ], probe-based arrays [187 ] Proteomics Proteins Quantification of peptide ab undances and modifications MS [54 ] Metabolomics Metabolites Quantification of multiple molecules (e.g. amino acids, fatty acids, carboh ydrates) MS [54 ] Microbiomics Microbiota Collecti v e in v estig ation of microor g anim (bacteria, viruses) colonizing skin, mucosal surf aces, gut NGS for metagenomics quantification [75 ]
1.1 The "Omics Revolution" 3
Fig. 1.1 Genetic information flow as described by the central dogma of molecular biology (from [151]). Instructions on DNA are transcribed into messenger RNA (mRNA) and then translated into proteins. Metabolites are the end-product of biological processes, obtained by dynamical interactions with proteins.
The central dogma of molecular biology can be thought as the first theoretical step towards multi-omics data integration. However, the importance of this field in Bioinformatics has increased only in the last decades, with the sequencing if entire human genome in 2001, with the Human Genome Project [82].
Improvements in high-throughput techniques (e.g. Next Generation Sequencing [217], Mass Spectrometry [54]) also permitted cost-efficient access to measurements of multiple molecular levels. These technological improvements, coupled with the availability of several repositories of accessible data, such as The Cancer Genome Atlas Project (TCGA) [204] or The Encyclopedia of DNA Elements Project (ENCODE) [51], lead to what can be called "Omics Revolution" [91]. However, there is now a need for adequate analytical methods namely improving multi-omics integration [156] to unleash the full potential of this ever-increasing amount of massive data.
1.2
Linear and simultaneous integration: challenging the
central dogma of biology
The growing availability of data describing complex traits has challenged the central dogma of molecular biology. The alternative theories that were proposed gave new perspectives to the multi-omics integration field.
Deeper investigation of biochemical processes, allowed by the advent of recent technologies, has uncovered molecular activities which were not taken into account by Crick. Examples are: reverse transcription (copying of DNA into RNA [21, 22]), post-transcription RNA processing [77] and post-translation protein modification (e.g.protein methylation [109], cis-and trans-splicing [182]).
On the basis of those discoveries, in 2009, James Shapiro re-formulated the central dogma by stating, for example, that the flow of information from one molecular layer to the others is not unidirectional. Shapiro also stated that every element of the genome interacts directly or indirectly with many other genomics components [190]. Few years later, in 2012, Denis Noble proposed a theory of no privileged level of causation in biological systems, that is it cannot be assumed that an organism is completely defined by its genome alone [160]. Starting from the example of the cardiac rhythm, Noble showed that feedback cycles among molecular layers not only exist, but are necessary parts of biological processes.
Following the hypotheses of omics interplay provided by the central dogma of molecular biology and by its alternative theories, two main approaches to multi-omics data integration can be distinguished: linear or simultaneous integration [175]. In Figure 1.2 we provide a graphical representation of the two different hypotheses of interplay: the hypothesis of linear interaction is referred as "Hypothesis A", while "Hypothesis B" describes the simultaneous interaction of omics.
1.2.1
Linear multi-omics integration
The first approach to multi-omics data integration that we will discuss in this thesis, assumes linear and hierarchical interactions between omics data (based on the Hypothesis A, Figure 1.2). Following the central dogma of molecular biology (Figure 1.1), variations in the DNA lead to gene expression changes, which in turn are responsible of level of protein production and thus of different phenotypes appearance [39]. Although, as pointed out before, this view of biology has proved to be oversimplified, the linear integration ensures to obtain biological meaningful results, since it is based on already known biological processes.
mathemati-1.2 Linear and simultaneous integration: challenging the central dogma of biology 5
Fig. 1.2 Alternative hypotheses of interactions between molecular layers (from [175]). Hy-pothesis A (grey arrows) suggests a linear view of phenotype emergency. HyHy-pothesis B (black arrows) assumes that the phenotype is given by simultaneous changes in the omics data.
cally solve this type of integration. This is especially true when only two data are considered: those models can predict cause-and-effect links between different data types. For example, in the work by Tappet al. [202], methods such as Partial Least Squares (PLS) [132, 241], Least absolute shrinkage and selection operator (Lasso) [206] and Elastic net [254], were used to predict the concentration of proteins related to obesity. Protein concentrations were then integrated with the hepatic transcriptome, in order to elucidate the molecular mechanisms associated to adiposity and inflammation in high-fat fed mice.
1.2.2
Simultaneous multi-omics integration
Linear integration has the limitation that unknown inter-omics relationships are not consid-ered: only assessed directions of interaction are explored. Moreover, in general, only part of the total inter-omics interactions are known from literature.
The complexity of the phenotypes suggests that phenotypic traits can be more exhaustively explored by the combination of simultaneous changes across all omics data. This view of
inter-omics interactions, described by Hypothesis B in Figure 1.2, is also at the basis of alternative theories of the central dogma.
Multi-omics data integration based on Hypothesis B does not need prior knowledge to be included. Additionally, following this approach several omics data (i.e. three or more) can be combined at the same time, providing a more complete and realistic view of the problem at hand.
As pointed out by Huanget. al[79], the inter-omics interactions are major concerns for data integration strategies: this is why the more recent progresses in multi-omics data integration focus on the simultaneous approach, with the help of computational and mathematical tools.
1.3
Statistical multi-omics data integration
The field of multi-omics integration is developing from a linear to a simultaneous point of view. Statistical methodologies are improving to include more than two omics data types and to take into account inter-omics relationships.
In this section, we give an overview of the classical statistical methodologies that are at the basis of simultaneous integration techniques. Those methodologies were usually proposed to meet the requirements of pairwise omics integration. This implies the importance of linear integration, based on biological knowledge, in the improvement of the multi-omics data integration field.
Another important aspect to consider is whether information about the phenotype is used during the integration. With this in mind, statistical methodologies can be divided into either supervised or unsupervised approaches.
Supervised integration approaches consider the phenotype labels of samples (e.g. dis-ease/normal, control/treatment) [79] and use this information to discover genotype-phenotype interactions [230] and to learn something more about the studied biological process.
Conversely, unsupervised integration approaches aim at drawing an inference from the con-sidered omics data without having access to the labels of the response variables [79]. From the mathematical point of view, thekomics data measured from the same experiment are considered as matricesX1, . . . ,Xk of dimensionn×pk.nrepresents the number of
com-mon subjects while pi i=1. . .kis the number of biological features collected for omicsXi.
Latent variable factorization and networks are mathematical tools often used as a starting point for the developments of integrative methods.
1.3 Statistical multi-omics data integration 7
1.3.1
Latent variable factorization
Latent variable factorization focuses on projecting variations occurring across different biological layers in a low-dimensional space. This goal is obtained by factorization of the matricesX1, . . . ,Xk into the product of loadingsFi (of dimensionn×r) and factorsQi (of dimension pi×rand called latent variables) added to an error term:
Xi=FiQTi +E i=1. . .k (1.1)
The number of columns ofFi andQi,r<pi, represents the number of latent components used to build the new low-dimensional space. Starting from this model, different methods can be developed accordingly to the inter-omics relationship that are searched. How these interactions are computed and which constraints should be imposed have to be considered in order to build a model.
Among all the possible methodologies developed starting from the model described in Equation 1.1, Partial Least Squares and Canonical Correlation Analysis have been largely used and ameliorated along the years to respond to new questions.
Partial Least Squares
Partial Least Squares (PLS) [107, 241] is a standard regression technique. It is used to identify a small set of features working as predictors for the response dataset [11] and strongly associated with them. Following Equation 1.1, two omics data, X andY can be decomposed as:
X=FxQTx +E Y =FyQTy +E
(1.2)
For each latent component j=1. . .r, PLS finds the loading factors (qxjandqyj, respectively columns of Qx and Qy) maximizing the covariance between Fx and Fy. This is done by solving the equivalent problem:
max
||qxj||=1,||qyj||=1
cov(Xj−1qxj,Y qyj) j=1. . .r (1.3)
whereXj−1is the residual matrix for each component [107]. To respond to the new challenges
brought by technological advances, the method has been extended in 2012 to integrate more than two omics data by Liet al.. They proposed Multi-block PLS [114], which implies that different layers jointly contributes to a unique dataset used as a response.
Additionally, to focus only on important biomolecules and discard the others, sparsity has been introduced in the PLS model, for example adding to the maximization problem a Lasso penalty term [206], defined on the vectorx= (x1. . .xn)asPL(x) =∑|xi|.
Canonical Correlation Analysis
Canonical Correlation Analysis (CCA) [67, 76] is another standard method to inspect inter-actions occurring between two data types. Differently to the PLS approach, for CCA it is not necessary to define which of the integrated omics data contains response variables. This makes the method more suitable for a total unsupervised integration.
Similarly to PLS, CCA searches for linear combinations of features. To find loading factors (Fx andFy, from Equation 1.1), for each latent component j=1. . .r, Canonical Correlation
Analysis maximizes the correlation amongX qxj andY qyj, by solving
max
||qxj||=1,||qyj||=1
corr(X qxj,Y qyj) j=1. . .r (1.4) The dimension of the maximization problem can be reduced also in the Canonical Correlation Analysis case, by applying regularization and penalization terms, such as the Lasso or the Elastic net (PE(x) =∑|xi|+∑|xi|2), to create sparse solutions.
To account for information coming from more than two omics data, in 2009 Witten and Tib-shirani extended the sparse CCA version [239], by proposing Multiple Canonical Correlation Analysis: a detailed description of this method is given in Appendix A.
1.3.2
Network-based methods
Networks represent a powerful tool in the context of multi-omics data integration, since they are able to contain heterogeneous and high-dimensional information.
A network Gis defined by the couple G= (V,E), whereV = (v1, . . .vn)is a set of nodes
whileE =ei j, i,j=1. . .n , is a set of edges connecting nodes inV, whereei j represents
the connection between nodesviandvj. A weightwi j can be associated to the edgeei j to
describe the importance of the link.
Networks can characterize complex interactions, thus identifying mechanism linked to differ-ent types of information [79] and associated to the phenotype of interest.
Networks can also be employed as a source of prior knowledge, describing biological processes and functions [230], helping in data interpretation. To this extent, databases of annotated pathways, such as KEGG [92] or Reactome [40], as well as gene networks or protein-protein interaction networks (PPI), have been collected to store inter-omics
infor-1.3 Statistical multi-omics data integration 9
mation obtained from literature. Omics datasets can be mapped to those databases to study over-representation or enrichment of molecules coming from different molecular layers. Alternatively, networks can be generated on the basis of the omics data at hand. In this case, network-based approaches to multi-omics data integration take advantage of algorithms from graph theory, such as diffusion processes [42, 229] or sub-network extraction [115, 149]. According to what nodes and edges represent, as well as the type of inter-omics interactions searched, edges can be built in different ways [231]. Bayesian networks, for example, allow the use of informative priors to capture conditional dependencies between probabilistic events [167]: probabilities are used to define the relationships between nodes [6]. Text-mining approaches instead, build networks based on scientific publications, on the assumption that molecules likely to interact share contextual information [56, 215]. Finally, correlation networks such as those generated by the Weighted Correlation Network Analysis method (WGCNA) [103] are based on the correlation (or on significance of correlation) between nodes.
Bersanelliet al.in their review of statistical integration methods [11], distinguish two kinds of network formalism (heterogeneous and multiplex) to describe multiple layers of biological information and their interactions.
Givenkomics dataX1. . .Xk, heterogeneous networks considerktypes of nodes, with each of
them corresponding to a different omics. Edges are built to represent intra and inter-layers connections. This allows to extract information about the problem at hand from the same unique graph. An example of the use of heterogeneous network in multi-omics data integra-tion is provided by Li and Patra [116]. They propose a random walk with restart algorithm to connect a gene network and a phenotype one: edges between genes and phenotypes represent the probability of the gene to be relevant for the phenotype. The gene network is built considering the PPI data from the Human Protein Reference Database [168], while genes-phenotype relations are obtained from the OMIM database [70]. Another approach based on heterogeneous networks is Lemon-Tree [16], which finds modules of co-expressed genes before combining them with one type of regulator data (such as methylation or miRNA) to infer regulatory scores, on the basis on decision trees assigned to regulators.
Multiplex networks [141] are instead defined askdifferent networks which store biological information on the same set of vertices (e.g. the samples/patients under study). In this case, an edge between two nodes in one of the networks represents the strength of intra-omics association among the two samples, such as their correlation or their similarity. To combine knowledge form the k data types, inter-omics links can be built. For instance, it can be determined, through degree correlation, if a hub in one of the considered layers has the same role in others [144]. Another example of use of multiplex networks in multi-omics data
integration is provided by the algorithm developed by Wanget al. [229], called Similarity Network Fusion. Through an information diffusion-based strategy (described in details in Appendix A) the algorithm retrieves the strongest and most informative sample similarities across different omics.
1.4
Application of multi-omics integration to real data
On the basis of the two main approaches (latent variable factorization and networks) described in the previous sections, statistical methods have been proposed overcome the challenges of multi-omics data integration and to solve real biological questions.
1.4.1
Multi-omics data integration challenges
The main challenges of multi-omics data integration are data heterogeneity and the complex-ity of the inter/intra-omics interactions. Data heterogenecomplex-ity refers to measurements from different platforms that are usually not taken on the same scale or have different distributions. Statistical methods should thus ensure that results are not biased towards the omics with larger dimension or larger variance. This issue can be overcome by scaling data or by reducing them to the most informative ones by means of feature selection approaches [74]. Inter-omics interactions and co-variations should be revealed without discarding relevant single omics patterns (intra-omics changes). Biologically significant results can be both supported by weaker signals involving more omics or strongly induced by a single data type. Thus multi-omics integration algorithms should be able to model either the significant intra and inter-omics relationships, to provide a complete view of the problem at hand.
The relevance of these challenges is intensified when integration methods are extended to support more than two omics data, cases that will be considered through this dissertation. Despite combining more biological levels implies that a more complete picture of the bio-logical system under study is drawn [11], it also increases the amount of noise added to the model, intensifying false positive discovery and difficulties in interpretation.
Dealing with common and complementary information
One of the goals of multi-omics data integration is to reinforce the common signal coming from different platforms (Table 1.1), such as genomics and transcriptomics [62, 183], miRNA and transcriptomics [120, 233], transcriptomics and proteomics [202, 208], or proteomics and metabolomics [13, 152]. Several studies are available for the integration of these omics types. For example Wanget al. [233] integrated miRNAs and gene expression by meaningfully
1.4 Application of multi-omics integration to real data 11
associating with Bayesian model analysis networks between the two omics and clinical outcomes in glioblastoma. Blanchetet al. [13] combined rat metabolomics and proteomics to divide samples at the onset of Experimental Autoimmune Encephalomyelitis, peripheral inflamed and healthy ones. A latent variable approach, Extended Canonical Variate Analysis [162], was separately applied to the data to reduce their dimension and extract relevant proteins and metabolites, which were then merged in a unique matrix and analysed through Principal Component Analysis (PCA) [85].
Strengthening common signal, however, is not the sole multi-omics data integration goal, since some levels like transcriptomics and metabolomics, do not interact directly. Their integration, however, could potentially bring complementary information [31, 36, 225]. Conesa et al. [36] integrated mice mRNAs and metabolites, measured on multiple time points and treatments, by N-PLS [19]. This method associates omics with a regression model on the latent space with maximum covariance between data and is an extension of the PLS algorithm to support structures with more factors (e.g., different time points). Results were compared to those obtained from transcriptomics data with Tucker3 [194], an algorithm able to decompose multi-factorial data and study within-block relationships. This study revealed that, despite the high overlap of selected genes, those found by integration described the response to treatments more closely. Furthermore, N-PLS integration showed differences in time response between genes and metabolites, suggesting that this algorithm can be used for time course experimental design (e.g., Dynamic Time Warping [30]).
1.4.2
Biological questions approached by multi-omics integration
The common or complementary information gained by multi-omics data integration can be used to solve several types of biological questions including the analysis of molecular mechanisms, sample classification and biomarker identification.
Exploring multilevel molecular mechanisms
To better understand molecular mechanisms underlying complex traits, interactions between biomolecules from different platforms and biological pathways are sought, especially by means of networks [32, 63, 102, 170, 209, 232]. In a study about breast cancer by Wanget al. [232], three sets of genes coming from pairwise integration of gene expression with one among somatic mutation, DNA copy number and DNA methylation were used to build a cross-talk network of risk pathways by random walk with restart [100] on a human protein interaction network. Networks were also built by the tool 3Omics [102] to unveil connections between transcriptomics, proteomics and metabolomics data under different experimental
conditions. In such a case, the edge creation between biomolecules and the new node addition when information was missing were performed by correlation analysis and literature text-mining.
Sample classification
One of the biological questions more addressed by multi-omics data integration is to rec-ognize, or correctly classify, different subtypes of the phenotype under study. For example, in studies concerning the effect of a treatment, responding subjects can be separated from those not responding to treatment. When dealing with diseases, it would be interesting to distinguish patients from healthy control subjects, for instance, to improve diagnosis and disease prognosis; or, in a more complex situation, to classify different subtypes of the same disease (like cancer). Because of the diversity in tumour types and the availability of patients, sample classification has been widely applied to oncology [118, 139, 147, 191, 252]. A method developed to solve this question is iCluster [191] which, after an initial estima-tion based on an optimized K-means clustering [250], computes integrated clusters with a likelihood-based solution of a joint Gaussian latent variable model. Applied to DNA copy number, methylation and gene expression, iCluster recognized three glioblastoma subtypes (i.e., Proneural, Classical and Mesenchymal) [192].
Biomarker identification
Another important goal of multi-omics data integration is the identification of biomolecules characterizing a phenotype. Omics integration could be more effective than single omics anal-ysis [16, 33, 97, 220, 225]: the interactions between biomolecules from different omics data cannot be modelled by separated analysis, leading to fragmented and incomplete information [231]. In a study on human metabolic disorders [225], metabolites and gene expression were clustered by means of WGCNA [103], which computes modules of highly correlated features through topological measures on correlation networks. The identified metabolite and gene clusters were then associated to external phenotypes such as variations of body weight, which revealed their connection with obesity and mitochondrial dysfunction.
1.5
DNA methylation
This section will provide an overview of epigenetics and DNA methylation main characteris-tics, as they will be the main focus of Chapter 2.
1.5 DNA methylation 13
Epigenetics refers to any DNA modification that does not change its sequence of nucleic basis but regulates its transcription [84, 90, 198]. Although not directly discussed in the central dogma of molecular biology, epigenomics, which refers to the genome-wide distribution of epigenetic changes (Table 1.1), always played an important role in biology. In the last decades, great efforts have been made to characterize the epigenome, its regulation and its changes during the development of cells in normal and disease state [87]. In particular, it is well known that epigenetic is essential for developmental process and cellular differentiation, but can also occur randomly in mature cells, following environmental exposure [84].
The best known epigenetic process is perhaps DNA methylation. DNA methylation (see Fig-ure 1.3 for a schematic representation) is the addition by DNA methyltransferases (DNMTs) of a methyl group (CH3) to the 5 position of the cytosine in CpG dinucleotides (CpG sites),
thus forming 5-methylcytosine [90].
Fig. 1.3 Schematic representation of DNA methylation, from [249]: methylation usually occurs when cytosine is followed by guanine (CpG site). Cytosine is methylated by DNA methyltransferase (DNMT) through the addition of a methyl group CH3, donated by
S-adenosylmethionine (SAM).
The methyl group is donated by S-adenosylmethionine (SAM), which after the methyl transfer reaction forms S-adenosyl homocysteine (SAH), a potent DNMT inhibitor [249]. Methylation usually occurs in genomic regions with a high content of guanine and cytosine and rich of CpG dinucleotides, which are called CpG islands. The importance of DNA methylation is emphasized by the growing number of human diseases that occur when
methylation is not properly established or maintained [177]. For example, in cancer cells, methylation of CpG islands is known to contribute to silence tumor suppressor genes, while during carcinogenesis a genome-wide hypomethylation (low methylation levels) can be seen across the genome [84].
Methylation in CpG enriched regions provides regulatory mechanisms of gene expression: its effect on gene expression depends on where it occurs. High methylation levels (hyper-methylation) in CpG islands associated with promoters normally repress gene transcription [112], although an increasing number of exceptions are identified [197]. Methylation within intronic and exonic regions of a gene body is instead positively correlated with expression [89]. Epigenetic changes, like DNA methylation, are thought to be involved in aging pro-cess and can be mediated by environmental factors, such as exposure to pollutants or diet and lifestyle. For example, methylation of CpG islands associated with estrogen receptor, undetectable in young individuals becomes progressively detectable with age [83]. Similarly, hypermethylation has been linked with atherosclerosis [235]. Also diet is known to affect variations in methylation levels: supplements of folate and vitamins affect the activity of the enzymes producing the methyl group [46], while methyl deficient diet induces liver cancer through hypomethylation and consequent higher expression of oncogenes [227]. Moreover, investigation on maternal diet in mice proved that feeding pregnant females with methyl donors induces changes in the offspring phenotypes (e.g.coat colour) [242]. Interestingly, such DNA modifications are for the most part reversible and can thus be modulated by opti-mizing, for instance, environments and daily habits. It is thus important to study modification in the DNA methylation connected with changes at other molecular layers, as well as to better study the impact of factors such as nutrition.
The hypotheses of linear and simultaneous omics interplay described in Figure 1.2 are tested in this thesis to take into account the challenges and the biological problem described above. We focus on differences and strengths of performing linear supervised and simul-taneous unsupervised omics integration. More than two data types are always considered. The two methodologies extract different kind of information from the data: respectively, information based only on prior knowledge and that based on not evident/not yet studied interactions. Under these considerations, we first want to test the effect of considering only known inter-omics relationships. We want also to test which factors influence unsupervised three-omics integration and to prove that network-based methods are the best in recovering information from unknown interactions. Simultaneous integration is known to be a pow-erful statistical tool to combine omics data, but it is usually considered in its unsupervised version. In this thesis, we thus want to include prior knowledge to simultaneous methods,
1.5 DNA methylation 15
to improve their performances. In particular, since prior knowledge of interaction is not al-ways available, we focus on computing it from the data with the help of multivariate statistics.
Chapter 2
A linear supervised three-omics
integration study on human adipogenesis
In this Chapter we study the molecular mechanisms underlying adipogenesis, the biological process of creation and growth of adipocytes. Following the Hypothesis A (Figure 1.2), we perform a linear and supervised three-omics integration. We aim of the study is to inspect the role of DNA methylation (see Table 1.1 and Section 1.5) in the regulation gene expression during adipogenesis. DNA methylation levels, gene expression, and protein abundances were measured from adipocytes cultured along 16 days and with the addition of different doses of fructose. These omics are integrated with classical statistical tools. In this thesis framework, the novelty of this integration consists in the use of prior knowledge to reduce the amount of data to focus on. Indeed, integration is here performed by considering only genomic regions that encode differentially expressed genes (already known from a previous work [157]). This step assures to focus on methylated DNA regions that are likely to affect gene expression. The result is a list of genes changing both at transcriptomic and epigenomic level. Those genes are involved in different biological processes linked to adipogenesis that were not found when only the transcriptomic level was analysed [157].
Additionally, some of the methylated/expressed genes change coordinately also at the pro-teomic level. This result highlights the importance of considering available inter-omics interactions when biomarkers are searched for the studied biological process.
The content of this chapter is the result of a collaboration with Nestlé Institute of Health Science (NIHS) and the U.S. Food and Drug Administration (FDA) and is included in a paper in preparation.
2.1
Introduction
Obesity and its comorbidities are growing worldwide epidemics [255]. A major hallmark of modern, westernised nutrition is increased consumption of highly refined sugar [154] that has been associated to the increasing incidence of metabolic disorders [94, 145]. Fructose consumption, as part of sugar-sweetened beverages and other processed foods, affects gut-and adipocyte-secreted hormones as well as the innate immune system [255]. Additionally, fructose causes deregulation of metabolic pathways in the hypothalamus and adipose tissue, both involved in mediation and regulation of the homeostatic maintenance of host energy balance resulting in the promotion of the development of metabolic syndrome [24].
Adipose tissue stores excess energy in the form of triglyceride through i) an increase of adipocyte size (hypertrophy) and ii) the promotion of differentiation or adipogenesis of pre-existing adipocytes (hyperplasia) [29]. Obesity occurs as consequence of a chronic positive energy intake which brings hypertrophy to a plateau resulting in the promotion of hyperplasia to cope with unbalance energy intakes [29].
Adipocyte differentiation mechanisms are regulated by a complex network of transcription factors responsible for expression of key proteins that induce mature adipocytes [157]. The main regulators of the early adipocyte differentiation process are the peroxisome proliferator-activated receptor (PPAR) and the CCAAT/enhancer binding proteins (C/EBPs)[111]. In the later stages, the process is regulated through the fatty acid binding protein 4 (FABP4), adiponectin, and fatty acid synthase (FAS) [201]. The understanding of adipogenesis was previously expanded and enriched by analyzing systems-wide transcriptomic profiles at specific time points from progenitor to mature adipocyte using a novel analytical tool for bio-logical network activity, the Network Activity Score Finder (NASFinder) [157]. NASFinder identified high scoring networks in signaling pathways, transcription factors, metabolic, energy production, and membrane and cell structure functions that change simultaneously across the differentiation process.
Epigenetic modifications such as DNA methylation contribute to the control of gene ex-pression and therefore participate in regulating these processes. For example, the promoter of lipoprotein lipase (LPL) that is expressed during adipose stem cell differentiation in culture [124] contains a hypomethylatedPPARresponsive element [161]. Activation ofLPL
ultimately leads to induction ofFABP4whose promoter harbors aC/EBPα site [142, 210].
Additionally, the promoter ofPPARγ2 was hypermethylated in 3T3-L1 mice preadipocytes
and was progressively demethylated following the induction of differentiation with a con-comitant increase of expression of its mRNA [58].
Methylation in CpG islands provides regulatory mechanisms of gene expression and is essential for cell differentiation and tissue integrity [4]. The effect of methylation on gene
2.1 Introduction 19
expression depends on where methylation occurs: high methylation levels in promoters nor-mally repress gene transcription [112], while methylation within intronic and exonic regions of a gene body is positively correlated with expression [89]. Moreover, DNA methylation can be affected by environmental factors such as lifestyle and diet, particularly since choline, betaine, folate, riboflavin and vitamin B12 participate in the one carbon cycle that produces S-adenosylmethionine, the methyl donor [25].
Differential methylation has been associated with chronic diseases associated with improper diets such as obesity [4, 222] and increased BMI [48]. Changes in methylation ofFASN in rats is associated with liver steatosis [37]. In addition, a relationship between methylation of genes involved in the circadian clock system and obesity, metabolic syndrome, and weight loss has been shown [143].
The controversial link between increased consumption of fructose in human diets and the obe-sity epidemic [18] stimulated research that tested the detrimental impact of this carbohydrate on insulin resistance and adipocyte differentiation, key processes to maintain metabolic health [105, 126]. The role of DNA methylation status in fructose-induced metabolic syndrome and DNA methylation status has not been well characterized. Consumption of high fructose has been shown to induce DNA methylation inPPARα andCPT1Ain rat liver [164], leading to
reduced expression of these genes and then to a hepatic lipid accumulation. Fructose may alter adipocyte differentiation by increasing levels ofPPARγ,C/EBPα, andFABP4, at least
in murine cells in culture [50]. Both fructose and glucose are substrates utilized to increase adiposity, but fructose contributes more to weight gain in humans [200].
Stable isotope tracer methods were used to show that fructose was metabolized to glutamate and fatty acids [218, 219] and it diverts glucose metabolites to the serine oxidative pathway producing additional metabolic energy [219]. To further characterize the effects of fructose on adipocyte biology, genome-wide transcriptomic and DNA methylation data were ana-lyzed at multiple time-points during differentiation of the human Simpson-Golabi-Behmel Syndrome (SGBS) euploid progenitor cells.
We identified genomic regions of differentially expressed genes where methylation of CpG sites differed compared to undifferentiated adipocytes. The integrative DNA modification, transcriptomic, and proteomic analysis reported here revealed that adipocyte methylation changes are influenced by time and the state of differentiation, with the largest differences detected at 384 hours following the initiation of differentiation, when the adipocytes are in the fully differentiated state. Furthermore, a 1:2 ratio of fructose (2.5mM) to glucose (5mM) demonstrated the most altered DNA methylation patterns among the different concentrations of fructose examined. An overview of all the performed single omics analysis and of the consequent omics integration is represented in Figure 2.1.
Methylation
Gene Expression Proteomics
24h 48h 96h 192h 384h 24h 48h 96h 192h 384h 96h 192h 384h 0h 5G 10F 5F 2.5F 0F Inter−omics integration Intra−omics contrasts
Fig. 2.1 Overview of the integration analysis of the three available omics data: methylation, gene expression and protein abundances. For each omics data, coloured dots indicate the different fructose/glucose doses available (0F, 2.5F, 5F, 10F, 5G) at each time point. To represent the significant integration among two different omics, for each fructose/glucose dose, a coloured thick line is drawn to connect the corresponding axes. The contrasts within the same omics providing the results are displayed as grey lines. Integration of gene expression and methylation resulted significant at 192 and 384 hours for control condition (0F) and for 2.5mM of fructose. Concordant integration results with protein abundances were found only at 384 hours in control condition.
2.2 Methods 21
2.2
Methods
2.2.1
Study design
Human Simpson-Golabi-Behmel syndrome (SGBS) preadipocytes, kindly provided by Mar-tin Wabitsch, were used and cultured as described in [218]. The study design is summarized in Table 2.1. Triplicates of cells in culture were harvested for DNA methylation or transcrip-tomics assays at specific time points including 24, 48, 96, 192 and 384 hours for control adipocytes (six replicates were harvested at 0 hours). Cultures treated with different concen-trations of fructose: 2.5, 5 and 10mM were harvested at 192 and 384 hours following the initiation of differentiation, as described in section 2.2.2. Importantly, samples for RNA and DNA platform were measured on cells plated at the same time and treated similarly.
For proteomic Somascan assays, cell lysates were obtained from 0, 96, 192, 384 hours following the induction of differentiation grown in 0, 2.5, 5, 10mM fructose.
Table 2.1 DNA methylation and gene expression were assayed at 6 different time points for control adipocytes, proteomics only at 4 time points (day 1 and day 2 excluded). DNA methylation, gene expression and proteins changes in the fructose-treated adipocytes were examined at 192 and 384 hours, following the addition of three different doses of fructose (2.5mM, 5mM, 10mM). Hours Glucose (mM) Fructose (mM) Methylation Gene Expression Proteomics 0 5 0 24 (1 day) 5 0 − 48 (2 days) 5 0 − 96 (4 days) 5 0 192 (8 days) 5 0, 2.5, 5, 10 384 (16 days) 5 0, 2.5, 5, 10
2.2.2
Fructose treatment of SGBS cells
For gene expression and DNA methylation studies, SGBS preadipocytes were plated at 2×
105cells in 100 mm dishes, supplemented with 10 ml growth medium, grown to confluence and initiated to differentiate as per [218]. All media used for the growth, differentiation and maintenance of adipocytes contained a basal amount of 5 mM glucose, equivalent to the normal blood glucose concentration. Cells were fully differentiated by day 8 (by oil red O
staining, not shown). Cells for RNA and DNA isolations were collected at different time points across differentiation at 24, 48, 96, 192 and 384 hours. Fructose doses were based on reports found in the systemic circulation following exposure to fructose-rich food [80]. At the initiation of differentiation, 2.5, 5 and 10 mM fructose concentrations were added and maintained in the medium until the collection of cells and medium at end points of either day 8 (192 hours) or until day 16 (384 hours) of differentiation. Cell lysates from the control or fructose-treated adipocytes were collected for DNA and RNA isolations.
For RNA isolation, media was completely aspirated from cells and a total of 700 ul of QIAzol lysis reagent was added to the cells, and the lysed cells were scraped, collected in an Eppendorf vial, sheer disrupted by passing through a tuberculin syringe about 6 time, and the lysates flash frozen.
For obtaining samples for DNA isolation, media was removed and cells were washed with PBS and aspirated to remove all PBS. The cells were gently scraped in the presence of a total of 400 ul of PBS, collected using a pipette fitted with a wide mouth tip, transferred to an eppendorf vial, and flash frozen. Cells from triplicate wells were used for both RNA and DNA isolation respectively.
2.2.3
Adipocytes omics data analysis
DNA methylation data
Genome-wide methylation was assessed using Illumina Infinium HumanMethylation450k array platform (Illumina, San Diego, CA. USA) that contains a total of 485,512 CpG sites. Samples were distributed over four different BeadChips. CpG sites were then annotated with the R package ilmn12.hg.19 [72], which identified the gene and the region on the chromosome. Illumina GenomeStudio software was used to extract the raw signal intensities. Methylation data preprocessing was performed with the function preprocessIllumina from the R package Minfi [7]. This method was applied to reduce Infinium I/II type bias and correct for background. Absolute percentages of methylation (β-values) were then extracted
and normalized with SWAN method [128].For each CpG site, averagedβvalues across the
cell triplicates were considered for the following analysis.
Minfi package was used to detect differentially methylated positions (DMPs). Statistical significance of CpG sites was assessed with a moderated F-statistic implemented in the function dmpFinder. Since DMPs were used as starting point for further analysis, a loose FDR adjusted p-value threshold of 0.1 was chosen.
In addition to DMPs, differentially methylated regions (DMRs) were identified with R package COHCAP [234]. COHCAP functions take as input a list of annotated DMPs to
2.2 Methods 23
compute average signals from CpG sites in the same region. A t-test with a FDR threshold of 0.05 was applied to find DMRs. The minimum number of sites needed to create a region was set at 1.
Transcriptomic data
The transcriptomic dataset was generated with 4 Illumina Human HT-12 v-4 BeadChips (Ilumina, Inc., San Diego, CA) hybridized with the RNA from 46 cell-cultures at different time points (0, 24, 48, 96, 192, 384 hours) and for different fructose concentration (0, 2.5mM, 5mM, 10mM). The RNA labeling and microarray hybridization was performed according to the manufacturer’s recommendations.
The scanned data was acquired in R using the package illiminaio [195]. The non-normalized summarized bead-level data was then annotated with R package illuminaHumanv4.db [52]. Other labeling and analysis methods were performed with the preprocessing pipeline previ-ously described in [157].
Differential expression analysis was carried out using the limma [196] R package. The probes were ranked by their log-odds scores given by empirical Bayesian moderation of sample variances with an FDR threshold of 0.01. The DEGs of fully differentiated adipocytes at 384h in controls were further processed to identify clusters of co-expressed genes. The clusters were decomposed according to the functional categories of their genes related to biological functions and pathways (DEG modules). The details of the procedures are described in [157]
Proteomic data
Regariding proteomics data, SGBS preadipocytes were plated at 1×10⁵cells/well in a 6-well plate and allowed to reach near confluence before adding differentiation medium. Samples were harvested from three replicate wells at 4 different time points including day 0 just before induction of differentiation, and then 96, 192 and 384 hours after the induction of differentiation.
The spent culture medium (supernatant) from respective wells was pipetted into an eppen-dorf vial, centrifuged at 13,000 RPM for 10 minutes at 4°C to pellet the cell debris. The supernatant was transferred to a fresh vial and stored at -80°C until used. Cells were then washed three times with ice cold PBS and then lysed by the addition of 125µl Mammalian
Protein Extraction Reagent M-PER® (Pierce biotechnology cat # 78503) containing sup-plemented with halt protease inhibitors (with EDTA) Pierce biotechnology cat # 87786) at 1x concentration and incubated for 5 minutes. Cell lysates were scraped and transferred to a microcentrifuge tube, centrifuged at 13,000 RPM for 10 minutes at 4°C to pellet the cell
debris. The clarified supernatant (lysate) obtained was transferred to a fresh tube and stored at -80°C. Protein concentrations in the supernatant and cell lysates were estimated using the micro BCA kit (Pierce biotechnology cat # 23235) as per the recommended protocol. Cells lysates in triplicates were analysed with the SOMAscan platform (SomaLogic, Inc., Boulder, CO) consisting of 1,12909 aptamers at different time-points (0, 96, 192 and 384 hours) and for different doses of fructose (0, 2.5, 5 and 10mM). SomaLogic Inc. (Boulder, CO) performed all proteomic assessments and was blinded to the clinical characteristics of participants in this study. Samples were analysed as previously described [20, 64, 65, 165]. Differentially expressed proteins were found with robust linear model from R package limma [196]. A threshold of 0.05 on moderated empirical Bayesian FDR was set to select significant proteins.
2.2.4
Multi-omics data integration
Genome-wide methylation, transcriptomic and proteomic data were collected and analyzed as described above. Differentially methylated regions (DMRs), differentially expressed genes (DEGs) and significantly expressed proteins were searched for each time point and each different fructose concentration.
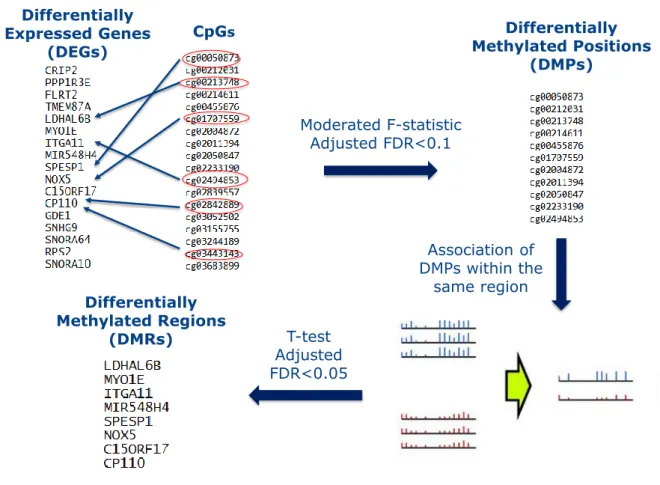
Integrative analysis of methylation and gene expression was then performed by determining the DMRs that were associated with differentially expressed genes, for each of the considered analysis. These genes show significant changes in both methylation and gene expression. The location of the DMRs in the corresponding gene (promoter, exon, intron or intergenic) were annotated with genomation R package [2]. Figure 2.2 illustrates the different steps used to perform the integration of these two omics data types.
Integration with protein expression was performed by determining the methylated/expressed genes that also associated with significantly expressed proteins. These genes show significant changes in methylation, gene and protein expression.
Transcription Factors binding sites analysis
Binding sites of transcription factors (TFs) in DMRs were identified with the function get.enriched.motif of the R package ELMER [245, 246]. Binding sites were searched on 181 transcription factors identified in the ENCODE database1. The CpG sites of all DMPs were used as background. Motifs occurring at least 10 times and with an odd ratio higher than 1 in the 95% CI were considered significant. Significant motifs from the same family were summarized with the function motif.relevant.TFs data from the ELMER.data package [247].
2.2 Methods 25
Moderated F-statistic Adjusted FDR<0.1 Differentially Methylated Positions (DMPs) Differentially Methylated Regions (DMRs) T-test Adjusted FDR<0.05 CpGs Differentially Expressed Genes (DEGs) Association of DMPs within the same region
Fig. 2.2 Pipeline used to perform integration of DNA methylation and gene expression for each of the considered contrast. Starting from a given list of genes known to be differentially expressed (DEGs), CpG sites close to them are retrieved. DMPs are searched through the usage of F-test. The signal of DMPs found in the same genomic region are averaged, and a t-test is used to found differentially methylated genomic regions (DMRs). Those correspond to a sublist of the starting list f genes.
Pathway analysis
Pathways analysis was performed with NASFinder [157]. NASFinder identifies and scores statistically significant sub-networks of an interactome network connecting functionally related genes to its main regulator (e.g. receptors or transcription factors). The analysis described here were adipose-specific using transcription factors as regulators and transcripts that mapped to differentially methylated genes to find the most active pathways influenced by methylation. The p-value threshold used to select significant pathway was<0.05. Functional pathway enrichment analysis was also performed with DAVID [47], using default parameters and a p-value threshold<0.05 to analyse the fructose data.
2.3
Results
2.3.1
Integration of DNA methylation and gene expression during adipocyte
differentiation
Genome-wide DNA methylation was measured using the Illumina 450K BeadChip at differ-ent time points during adipocyte differdiffer-entiation to determine the changes in DNA methylation accompanying adipocyte differentiation compared to the baseline (0 hours in the absence of fructose without fructose). A total of 2, 2 ,4, 607 and 155,573 genome-wide DMRs were found at 24, 48, 96, 192 and 384 hours, respectively. The corresponding differential tran-scriptomic analysis identified 2007, 2473, 4977, 6594 and 5237 genes at the same respective time points.
The integration of DNA methylation and transcriptomic data identified DMRs in genes which were differentially expressed during adipocyte differentiation. The majority of methylation sites analysed did not change between pre-induction (0 hour) and 24, 48, and 96 hours after induction (Figure 2.3A). However, a large number of changes in methylation were apparent at 192 hours and 384 hours versus baseline (Figure 2.3 and Table 2.2).
Table 2.2 Differentially methylated regions (DMRs) and differentially expressed genes (DEGs) at different time points across adipocyte differentiation in control adipocytes. The number of genes differentially expressed used for the integration, and the number of re-gions with a significant change in methylation levels (both genome-wide and on DEGs) are displayed for each comparison. DMRs on DEGs are detected only at 192 and 384 hours following the initiation of differentiation.
Time-point
(hours) No. DEGs
Genome-wide DMRs No. DMRs on DEGs 24 2007 2 − 48 2473 2 − 96 4977 4 − 192 6594 607 57 384 5237 155573 1437
At 192 hours, 57 of the 6,594 (0.8% of the DEG) differentially expressed genes showed significant changes also in methylation levels. At 384 hours, methylation changed in 1437 genomic regions (DMRs), in 1,254 of the 5,237 differentially expressed genes (23.95% of the DEGs). 130 of those 1,254 genes were differentially methylated in multiple regions. Hereafter, the differentially methylated/expressed genes (or regions) will be referred to as
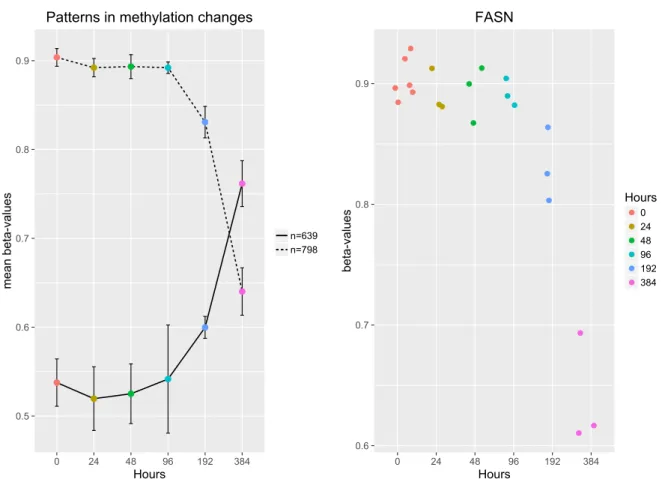
2.3 Results 27 0.5 0.6 0.7 0.8 0.9 0 24 48 96 192 384 Hours mean beta-values n=639 n=798 Patterns in methylation changes
0.6 0.7 0.8 0.9 0 24 48 96 192 384 Hours beta-values Hours 0 24 48 96 192 384 FASN
Fig. 2.3 DNA Methylation levels for probes in control adipocytes, reveals a general decreasing in DNA methylation. Different time-points across differentiation are represented by different colors. A) Methylation patterns during differentiation. Dots define averagedβ-values for
each time-point. 798 differentially methylated genes present the decreasing trend, but β
-values for 639 genes increase with time. The biggest changes happen between 192 and 384 hours. B) Change of methylation levels during differentiation for the geneFASN. Dots represent the different replicates available for each time-point.
DMRs.
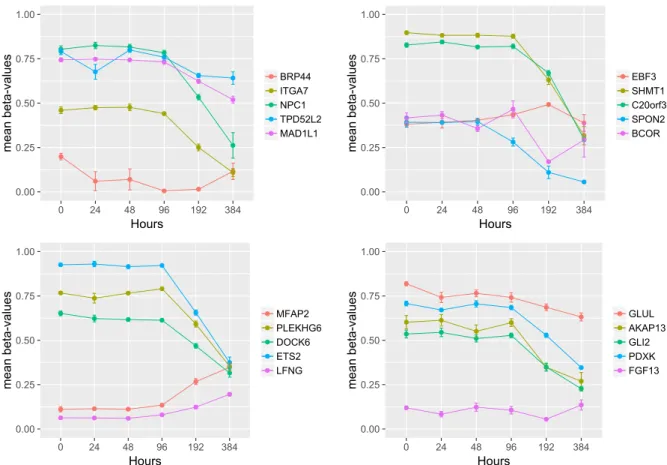
20 of the 57 genes DMRs at 192 hours maintained their methylation status at 384 hours (Figure 2.4), suggesting that methylation occurred before 192 hours and lasted at least until 384 hours. Gene enrichment analysis revealed that the top-ranked KEGG pathway was glyoxylate and dicarboxylate metabolism (e.g.,SHMT1, GLUL) and GO terms involved in morphogenesis, adhesion, and developmental process not corrected for multiple comparisons (Table 2.3), although none of these pathways was significant after correction for multiple comparisons. Eight (BCOR, EBF3, ETS2, GLI2, ITGA7, NPC1, PDXK, SPON2) of the 20 genes have been shown to be involved in adipocyte differentiation or function and all but four (GLUL, PLEKHG6, SHMT1, TPD52L2) are in involved in other types (e.g., neurite,
intestinal, cardiac and other) of differentiation or development processes (see Table 2.10 in supplementary material section).
0.00 0.25 0.50 0.75 1.00 0 24 48 96 192 384 Hours mean beta-values BRP44 ITGA7 NPC1 TPD52L2 MAD1L1 0.00 0.25 0.50 0.75 1.00 0 24 48 96 192 384 Hours mean beta-values EBF3 SHMT1 C20orf3 SPON2 BCOR 0.00 0.25 0.50 0.75 1.00 0 24 48 96 192 384 Hours mean beta-values MFAP2 PLEKHG6 DOCK6 ETS2 LFNG 0.00 0.25 0.50 0.75 1.00 0 24 48 96 192 384 Hours mean beta-values GLUL AKAP13 GLI2 PDXK FGF13
Patterns for significant genes at 192 and 384 hours
Fig. 2.4 Methylation patterns during differentiation for the 20 genes showing significant methylation/expression changes both at 192 and 384 hours. To better inspect the patterns, gene results are separated in four panels. Dots define averagedβ-values for each time-point,
2.3 Results 29
Table 2.3 Enriched pathways from the DAVID analysis of the 20 DMRs found to be signifi-cantly methylated/expressed both at 192 and 384 hours. P-value and pathway genes are also provided.
Category Term P-value Genes
GOTERM_BP_FAT GO:0007389∼pattern
specification process 0.009
ETS2, GLI2, BCOR, LFNG
GOTERM_BP_FAT GO:0009790∼embryo
development 0.014 ETS2, ITGA7, MFAP2, GLI2, LFNG GOTERM_BP_FAT GO:0009952∼anterior/ posterior pattern specification 0.018 ETS2, GLI2, LFNG
GOTERM_BP_FAT GO:0048598∼embryonic
morphogenesis 0.019 ETS2, ITGA7, MFAP2, GLI2 GOTERM_BP_FAT GO:0022603∼regulation of anatomical structure morphogenesis 0.020 ITGA7, FGF13, AKAP13, BCOR, LFNG
GOTERM_BP_FAT GO:0045165∼cell fate
commitment 0.025 ETS2, FGF13, GLI2 KEGG_PATHWAY hsa00630: Glyoxylate and dicarboxylate metabolism 0.035 SHMT1, GLUL GOTERM_BP_FAT GO:0016337∼single organismal cell-cell adhesion 0.036 MAD1L1, ITGA7, GLI2, LFNG GOTERM_BP_FAT GO:0051093∼negative regulation of developmental process 0.039 FGF13, GLI2, BCOR, LFNG GOTERM_BP_FAT GO:0010639∼negative regulation of organelle organization 0.04 MAD1L1, FGF13, BCOR
GOTERM_BP_FAT GO:0003002∼regionalization 0.043 ETS2,
GLI2, LFNG
GOTERM_BP_FAT GO:0098602∼single
organism cell adhesion 0.043
MAD1L1, ITGA7, GLI2, LFNG
![Fig. 1.1 Genetic information flow as described by the central dogma of molecular biology (from [151])](https://thumb-us.123doks.com/thumbv2/123dok_us/1365711.2682840/19.892.143.777.206.482/fig-genetic-information-described-central-dogma-molecular-biology.webp)
![Fig. 1.2 Alternative hypotheses of interactions between molecular layers (from [175])](https://thumb-us.123doks.com/thumbv2/123dok_us/1365711.2682840/21.892.281.614.186.559/fig-alternative-hypotheses-interactions-molecular-layers.webp)
![Fig. 1.3 Schematic representation of DNA methylation, from [249]: methylation usually occurs when cytosine is followed by guanine (CpG site)](https://thumb-us.123doks.com/thumbv2/123dok_us/1365711.2682840/29.892.197.713.528.855/schematic-representation-methylation-methylation-usually-cytosine-followed-guanine.webp)