Abstract
Introduction: The study was performed to compare and analyze the inter-departmental variability in the request of rarely requested laboratory tests in primary care, as opposed to other more common and highly requested tests.
Materials and methods: Data from production statistics for the year 2012 from 76 Spanish laboratories was used. The number of antinuclear anti-bodies, antistreptolysin O, creatinine, cyclic citrullinated peptide antianti-bodies, deaminated peptide gliadine IgA antianti-bodies, glucose, protein electrop-horesis, rheumatoid factor, transglutaminase IgA antibodies, urinalysis and uric acid tests requested was collected. The number of test requests per 1000 inhabitants was calculated. In order to explore the variability the coefficient of quartile dispersion was calculated.
Results: The smallest variation was seen for creatinine, glucose, uric acid and urinalysis; the most requested tests. The tests that were least reque-sted showed the greatest variability.
Conclusion: Our study shows through a very simplified approach, in a population close to twenty million inhabitants, how in primary care, the va-riability in the request of laboratory tests is inversely proportional to the request rate.
Key words: primary care; laboratory proficiency testing; clinical laboratory services; test requesting; preanalytical phase
Received: May 11, 2015 Accepted: August 28, 2015
Larger differences in utilization of rarely requested tests in primary care in
Spain
Maria Salinas 1,2*, Maite López-Garrigós1,2, Emilio Flores1,3, Joaquín Uris4, Carlos Leiva-Salinas5 On behalf of the Pilot Group of the Appropriate Utilization of Laboratory Tests
1Clinical Laboratory, Hospital Universitario de San Juan, San Juan de Alicante, Spain
2Department of Biochemistry and Molecular Pathology, Universidad Miguel Hernandez, Elche, Spain 3Department of Clinical Medicine, Universidad Miguel Hernandez, Elche, Spain
4Department of Public Health, Universidad de Alicante, Alicante, Spain 5Department of Radiology, University of Virginia, Charlottesville, VA, USA
*Corresponding author: [email protected]
Introduction
Test request is the key step in the pre analytical phase (1). Inappropriate tests could be defined as those that could reasonably be avoided at no sig-nificant detriment to a patient’s care (2). It is very difficult to measure requesting appropriateness in the long term and practically impossible on a daily basis, at least in an automatic and fast way, and es-pecially in laboratories with high workload.
However, it is imperative to investigate how to deal this important topic, to investigate the de-gree of test requesting variability and
inappropri-designed and established thorough communica-tion between laboratory and requesting clinicians to reach an optimal laboratory test request. More-over, it is also a key element to monitor after the establishment of interventions for its adjustment (3).
By comparing test requests in different settings or geographical areas (4,5) where the patient popula-tion is similar, it is possible to study the variability in the request of laboratory tests and therefore to estimate one’s requesting pattern as compared to
Several studies have shown a high variability in the request of laboratory tests in primary care in Spain (6-9). Overall, the least the tests were re-quested, the more variability was observed (7). The request rate was inversely proportional with the requesting pattern variability. However prima-ry care requests of some esoteric or rarely request-ed tests has not still been studirequest-ed. Those results provide a starting point after which it is possible to establish corrective actions to solve over and also under requesting.
Based on this data, it seemed interesting to meas-ure the request of some esoteric tests in primary care and to compare to highly demanded tests to try to confirm that trend and to understand the potential rationale behind their requesting pat-terns in order to further establish strategies for better request. The hypothesis was that the re-quest rate of laboratory tests was inversely pro-portional with the requesting pattern variability. The aim of the study is to compare and analyze in-ter-departmental variability in the request of rare-ly requested laboratory tests in primary care, as opposed to other more common and highly re-quested tests.
Materials and methods
Setting
Spain is divided in 17 Autonomous Communities. Every Spanish citizen possesses the Individual Health Care Card, which let access to public health services as a healthcare user throughout the Na-tional Health System. The Health system in every Autonomous Community is divided into Health Departments. Each Health Department covers a geographic area and its population. It is composed by several primary care centers and usually a unique Hospital. The laboratory located at the hospital attends the needs of every Health Depart-ment inhabitant.
This study presents just part of the results ob-tained from a large database from the Pilot Group of the Appropriate Utilization of Laboratory Tests, REDCONLAB, working group. The large number of
participants and data made it necessary to be published in parts. The research studies the varia-bility of laboratory test request, as a measure of how spread out or closely clustered a set of data regarding demand in different geographical areas is.
Data collection
A call for data was posted via email. Spanish
labo-ratories willing to participate in the study were in-vited to fill out an enrollment form and submit their results online. The dissemination of the ques-tionnaire was addressed to the participants of pre-vious studies of the REDCONLAB group that rec-ommended to other laboratories to join the cur-rent edition and sent to us the e-mail addresses of the potential applicants. 141 laboratories were in-vited to participate.
Numbers of tests requested by all of the general practitioners (GPs) for the year 2012 from laborato-ries at different hospitals from diverse depart-ments across Spain were used. Each participating laboratory was required to be able to obtain pa-tient data from local Laboratory Information Sys-tems Patient’s databases and also to provide data of the organization. The criteria to select tests were to obtain 3 different groups: highly request-ed tests, moderately requestrequest-ed tests, and rarely re-quested tests in primary care. In fact studied tests were divided in three groups. First group: glucose and creatinine; second group: urinalysis and uric acid and lastly a third group: antinuclear antibod-ies (ANA), antistreptolysin O (ASO), cyclic citrulli-nated peptide antibodies (anti-CCP), deamicitrulli-nated peptide gliadine IgA antibodies (anti-DGP), protein electrophoresis, rheumatoid factor, transglutami-nase IgA antibodies (anti-tTG), tests requested was collected.
Data processing
After collecting the data, test-utilization rates were calculated by standardization with the population attended by each laboratory. Rates were
ex-pressed as tests per 1000 inhabitants. We
consid-ered inhabitants the residents in each public Health Departments.
Statistical analysis
All analyses were performed using SPSS Inc. for Windows, Version 16.0. (Chicago, SPSS Inc). De-scriptive statistics were generated for test-utiliza-tion rates. In order to explore the variability through test-utilization rates comparison the coef-ficient of quartile dispersion (CQD) was used. Coef-ficient of variation was not employed due to its higher sensitivity to outliers. CQD was calculated
using the first (Q1) and third (Q3) quartiles for each
data set, as follows: (Q3-Q1)/(Q3+Q1) (10).
Results
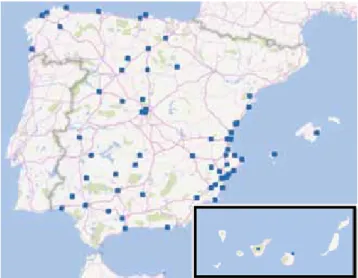
Of the 141 requested laboratories, 76 laboratories, on a voluntary basis, participated in the study, cor-responding to a catchment area of 17,679,195 in-habitants (38% of the Spanish population) from 13 different communities throughout Spain. Figure 1 shows the distribution of the different health de-partments around the country in a map. All labo-ratories served Primary Health Care Units and also hospital wards. Moreover, every laboratory includ-ed in the study performs all of the preselectinclud-ed tests. Table 1 shows the descriptive analysis of
eve-ry test rate per 1000 inhabitants. CQD was up to
ten times higher in the less requested tests when
Figure 1. Distribution of the participating health departments (laboratories).
The figure shows a map of Spain with the distribution of the 76 participating laboratories. Note that laboratories located in the same town are marked with a single dot (in alphabetical order: Elche (2), Madrid (4), Murcia (2), Sevilla (2), and Valencia (4).
Rates per 1000 inhabitants Median Q1 Q3 IQR CQD
Glucose 361.53 325.54 401.33 75.79 0.10 Creatinine 342.61 309.77 382.59 18.82 0.11 Uric acid 297.13 224.07 339.95 115.88 0.21 Urianalysis 203.44 162.52 255.31 92.79 0.22 Rheumatoid factor 20.42 14.19 29.80 15.61 0.35 anti-tTG 4.37 2.91 6.35 3.44 0.37 ANA 3.65 2.40 6.26 3.86 0.44 Protein electrophoresis 5.26 2.84 10.19 7.35 0.56 Antistreptolisin antibodies 3.87 1.81 9.78 7.97 0.69 anti-CCP 0.19 0.06 0.69 0.63 0.84 anti-DGP 0.54 0.00 2.48 2.48 1.00
Table 1. Summary of rates per 1000 inhabitants, showing the median, the first (Q1) and third (Q3) quartiles and, as magnitudes of
variation, interquartile range (IQR) and coefficient of quartile dispersion (CQD) for each data.
compared to glucose. The smallest variation was seen for creatinine, glucose, uric acid and urinalysis, the most requested tests. Note that the tests that are least requested show the greatest variability. Figure 2 shows the test utilization rate expressed as a median and the CQD for every studied
labora-tory test. We can visualize how the request rate was inversely proportional with the requesting pattern variability.
Discussion
Our study shows through a very simplified ap-proach, in a population close to twenty million in-habitants, how in primary care, the variability in the request of laboratory tests is inversely propor-tional to the request rate.
Every public health care worker should contribute to achieve the goal best outcome for the patient at the best price, with no differences between the different geographical areas or hospitals. A first step to standardize the utilization of diagnostic procedures and hence equity in health care is to study the variability in the request of such tests between the different geographic areas (11). Correct utilization of laboratory tests is para-mount. First, laboratory data intervene in 70% of clinical decisions (12). Second, the consequence of inappropriate test request is not just financial, but also implies missing certain diagnosis when a test is under requested, or delivering an unacceptable number of false positive results when over re-quested (13). Besides, the latter contributes to an unnecessary increased workload; laboratory pro-fessionals cannot provide every laboratory data
the attention it deserves, with increased risk that high-value data for clinical decision making to be hidden by invaluable information (14).
The variability of the least demanded tests in pri-mary care has not been previously compared to the one for the highly requested tests. In a first group, we included two highly requested tests, glucose and creatinine, that are considered rou-tine laboratory tests for preventive health exams to promote healthier behaviors; in fact their high demand may be justified and request is very uni-form between areas. Secondly, we considered two less requested tests: urinalysis and uric acid. Both are not recommended as part of a health checkup. In primary care, uric acid is mainly limited to pa-tients with suspected gout. It is known that uric acid is usually requested out of habit and may be over requested (11). This could be potentially dan-gerous since its use for screening purposes may lead to treatment of “asymptomatic hyperurice-mia” (15). In fact, unexpected pathologic values could cause unneeded repeated visits. Although urinalysis is not recommended as a screening test for reasons of cost-benefit, it continues to be fre-quently requested in primary care services (16). Fi-nally, we studied tests that are rarely requested in primary care, but with an increasing utility such as markers for diagnosis of celiac and autoimmune diseases; conditions that are increasingly being di-agnosed and treated in general practice. Lastly, we have studied the variability of two tests that are rarely requested, and have no or very marginal utility in this setting as ASO and protein electro-phoresis.
It is difficult to define the optimal use of specific laboratory markers (3). However, when intervening in this type of benchmark studies, one must be aware when getting specific marginal results; i.e. if one’s uric acid or urinalysis request rate is in the highest or lowest level. Moreover, information re-garding the variability in the request of rare tests is very useful since they are usually much more ex-pensive than the more demanded (17).
The value and significance of our study results and hence the applicability of the findings regarding differences in tests requesting patterns between laboratories are clear. Our results can be efficiently
Mean Quartile coefficient of dispersion
Quar
tile coefficient of dispersion
Tests/1000 inhabitants 400 300 350 200 250 100 50 150 0 1.2 1 0.8 0.6 0.4 0.2 0 Glucose
Creatinine Uric acidUrianalysis Rheumatoid fac tor anti-tT G ANA Protein elec trophoresis Antistreptolisin antibodies anti-CCP anti-DG P
Figure 2. Utilization rate expressed as number of tests per 1000
inhabitant, and quartile coefficient of dispersion for every stud-ied laboratory test.
used not only for discussions with local doctors on the appropriate use of laboratory tests (11), but also as a pillar for the design and establishment of strategies for a better request (17,18), even at a na-tional level. The study has some limitations. First our data could not be transferred to other institu-tions with different Healthcare models, different to the public sector. Second, the differences ob-served could be due to differences in type or mix of patients treated by primary care in disease prev-alence/incidence across departments or differenc-es between poor and rich areas. Third, the differ-ences in the requesting patterns could be also ex-plained by the degree of management of the dif-ferent diseases by GPs in the studied areas.
In all, the variability in the request of laboratory tests is inversely proportional to the request rate; this data can be used for discussions between lab-oratory professionals and GPs on the appropriate use of laboratory tests to improve test utilization and also can be the pillar for the design and estab-lishment of strategies for a better test request. Acknowledgements
Members of the REDCONLAB working group are the following (in alphabetical order): Alfonso Pé-rez-Martínez (Hospital Morales Meseguer), Ampa-ro Miralles (Hospital de Sagunto), Ana Santo-Quiles (Hospital Virgen de la Salud, Elda), Ángela Rodri-guez-Piñero (Hospital Universitario de Móstoles), Angeles Giménez-Marín (Hospital de Antequera), Antonio Buño-Soto (Hospital La Paz, Madrid), An-tonio Gómez del Campo (Complejo Asistencial de Ávila), Antonio León-Juste (Hospital Juan Ramón Jiménez, Huelva), Antonio Moro-Ortiz (Hospital de Valme, Sevilla), Arturo Carratalá (Hospital Clínico Universitario de Valencia), Begoña Laiz (Hospital Universitario y Politécnico La Fe de Valencia), Berta González-Ponce (Hospital Da Costa, Burela), Car-men Hernando de LarraCar-mendi (Hospital Severo Ochoa de Leganés), Carmen Vinuesa (Hospital de Vinaros), Cesáreo García-García (Hospital Universi-tario de Salamanca), Concepción Magadán-Núñez (Hospital Arquitecto Marcide, El Ferrol), Consuelo Tormo (Hospital General Universitario de Elche), Cristina Santos-Rubio (Hospital Río Tinto, Huelva), Cristóbal Avivar (Hospital de Poniente, El Ejido),
uardo Sanchez-Fernandez (Hospital del Vinalopo, Elche), Emilia Moreno-Noguero (Hospital Can Miss-es), Enrique Rodríguez-Borja (Hospital Clínico Uni-versitario de Valencia), Esther Roldán-Fontana (Hospital La Merced. Area de Gestión Sanitaria Se-villa Este), Fco. Javier Martín Oncina (Hospital Virgen del Puerto de Plasencia, Caceres), Félix Gas-cón (Hospital Valle de los Pedroches, Pozoblanco), Fernando Rodríguez Cantalejo (Hospital Universi-tario Reina Sofia de Cordoba), Fidel Velasco Pena (Hospital Virgen de Altagracia, Manzanares), Fran-cisco Miralles (Hospital Lluis Alcanyis, Xativa), Goit-zane Marcaida (Consorcio Hospital General Uni-versitario de Valencia), Marta Barrionuevo (Hospi-tal Universitario Principe de Asturias, Alcalá de Henares), Inmaculada Domínguez-Pascual (Hospi-tal General Universitario Virgen del Rocio, Sevilla), Isidoro Herrera Contreras (Complejo Hospitalario de Jaén), Jose Antonio Ferrero (Hospital General de Castellón), Jose Luis Barberà (Hospital de Man-ises), Jose Luis Quilez Fernandez (Hospital Univer-sitario Reina Sofia de Murcia), Jose Luis Ribes-Vallés (Hospital de Manacor), Jose Miguel Gonzalez Re-dondo (Hospital Santiago Apostol de Miranda de Ebro), Jose Sastre (Hospital Virgen de los Lirios, Al-coy), Jose Vicente Garcia-Lario (Hospital Virgen de las Nieves, Granada), Juan Ignacio Molinos (Hospi-tal Sierrallana, Torrelavega), Juan Molina (Hospi(Hospi-tal Comarcal de La Marina, Villajoyosa), Juan Ramón Martínez-Inglés (Hospital General Universitario Santa Lucía, Cartagena), Julian Diaz (Hospital Francesc de Borja, Gandia), Laura Navarro Casado (Complejo Hospitalario Universitario de Albacete), Leopoldo Martín-Martín (Hospital General de La Palma), Lola Máiz Suárez (Hospital Universitario Lu-cus Augusti, HULA, Lugo), Luís Rabadán (Complejo Asistencial de Soria), M Dolores Calvo (Hospital Clinico de Valladolid), M. Amalia Andrade-Olivie (Hospital Xeral-Cies, CHU Vigo), M. Angeles Rod-ríguez-Rodriguez (Complejo Asistencial de Palen-cia), M. Carmen Gallego Ramirez (Hospital Rafael Mendez, Lorca), M. Mercedes Herranz-Puebla (Hospital Universitario de Getafe), M. Victoria Pon-cela-Garcia (Hospital Universitario de Burgos), Mª José Baz (Hospital de Llerena, Badajoz), Mª José Martínez-Llopis (Hospital de Denia), Mª.Teresa Avello-López (Hospital San Agustín, Avilés), Mabel Llovet (Hospital Verge de la Cinta, Tortosa), Mamen
Lorenzo (Hospital de Puertollano), Marcos Lopez-Hoyos (Hospital Universitario Marques de Valdecil-la), Maria Jose Zaro (Hospital Don Benito-Villanue-va), Maria Luisa Lopez-Yepes (Hospital Virgen del Castillo de Yecla), Mario Ortuño (Hospital Universi-tario La Ribera), Marisa Graells (Hospital General Universitario de Alicante), Marta García-Collía (Hospital Ramon y Cajal, Madrid), Martin Yago (Hospital de Requena), Mercedes Muros (Hospital Nuestra Señora de la Candelaria, Tenerife), Nuria Estañ (Hospital Dr. Peset, Valencia), Nuria Fernán-dez-García (Hospital Universitario Rio Hortega,
Val-ladolid), Pilar Garcia-Chico Sepulveda (Hospital General Universitario de Ciudad Real), Ricardo Franquelo (Hospital Virgen de la Luz de Cuenca), Ruth Gonzalez Tamayo (Hospital de Torrevieja), Sil-via Pesudo (Hospital La Plana), Vicente Granizo-Dominguez (Hospital Universitario de Guadalaja-ra), Vicente Villamandos-Nicás (Hospital Santos Reyes, Aranda del Duero), Vidal Perez –Valero (Hos-pital Regional de Málaga).
Potential conflict of interest None declared.
References
1 . Fryer AA, Smellie WS . Managing demand for laboratory te-sts: a laboratory toolkit . J Clin Pathol 2013;66:62-72 . http:// dx .doi .org/10 .1136/jclinpath-2011-200524 .
2 . Smellie WS . Appropriateness of test use in pathology: a new era or reinventing the wheel? . Ann Clin Biochem 2003;40:585– 92 . http://dx .doi .org/10 .1258/000456303770367180 . 3 . Baird G . The laboratory test utilization management
to-olbox . Biochem Med (Zagreb) 2014;24:223-34 . http:// dx .doi .org/10 .11613/BM .2014 .025 .
4 . Salinas M, López-Garrigós M, Uris J; Pilot Group of the Appro-priate Utilization of Laboratory Tests (REDCONLAB) Working Group . Differences in laboratory requesting patterns in emer-gency department in Spain . Ann Clin Biochem 2013;50:353-9 . http://dx .doi .org/10 .1177/0004563212474568 .
5 . Larsson A, Palmer M, Hulten G, Tryding N . Large differences in laboratory utilization between hospital in Sweden . Clin Chem Lab Med 2000:38:383-9 . http://dx .doi .org/10 .1515/ CCLM .2000 .056 .
6 . Salinas M, López-Garrigós M, Díaz J, Ortuño M, Yago M, Laíz B, et al . Regional variations in test requiring patterns of general practitioners in Spain . Ups J Med Sci 2011;116:247-51 . http://dx .doi .org/10 .3109/03009734 .2011 .606927 . 7 . Salinas M, López-Garrigós M, Tormo C, Uris J . Primary care
use of laboratory tests in Spain: measurement through appropriateness indicators . Clin Lab 2014;60:483-90 . 8 . Salinas M, López-Garrigós M, Flores E, Uris J, Leiva-Salinas
C; On behalf of the Pilot Group of the Appropriate Utiliza-tion of Laboratory Tests (REDCONLAB) working group . Po-tential over request in anemia laboratory tests in primary care in Spain . Hematology 2014; [Epub ahead of print] . 9 . Salinas M, López-Garrigós M, Uris J, Leiva-Salinas C;
Appro-priate Utilization of Laboratory Tests (REDCONLAB) wor-king group . A study of the differences in the request of glycated hemoglobin in primary care in Spain: A global, si-gnificant, and potentially dangerous under-request . Clin Biochem 2014;47:1104-7 . http://dx .doi .org/10 .1016/j .clin-biochem .2014 .04 .020 .
10 . Bonnett DG . Confidence interval for a coefficient of quartile variation . Comput Stat Data Anal 2006;50:2953-57 . http:// dx .doi .org/10 .1016/j .csda .2005 .05 .007 .
11 . Larsson A . What can we learn from studies on regional differences in the utilization of laboratory tests? Ups J Med Sci 2011;116:225-6 . http://dx .doi .org/10 .3109/03009734 .2 011 .624281 .
12 . Forsman RW . Why is the laboratory an afterthought for managed care organizations? Clin Chem 1996;42:813-6 . 13 . Salinas M, Lopez-Garrigós M, Flors L, Leiva-Salinas C .
Labo-ratory false-positive results: a clinician responsibility or a shared responsibility with requesting clinicians? Clin Chem Lab Med 2013;51:e199-200 . http://dx .doi .org/10 .1515/ cclm-2013-0043 .
14 . Simundic AM, Nikolac N, Miler M, Cipak A, Topic E . Efficiency of test report delivery to the requesting physician in an out-patient setting: an observational study . Clin Chem Lab Med 2009;47:1063–6 . http://dx .doi .org/10 .1515/CCLM .2009 .249 . 15 . Salinas M, López-Garrigós M, Asencio A, Batlle E, Minguez
M, Lugo J et al . Strategy to improve the request of uric acid in primary care: preliminary results and evaluation throu-gh process and outcome appropriateness indicators . Clin Biochem 2014;47:467-70 . http://dx .doi .org/10 .1016/j .clin-biochem .2013 .12 .025 .
16 . Merenstein D, Daumit GL, Powe NR . Use and costs of nonre-commended tests during routine preventive health exams . Am J Prev Med 2006;30:521-7 . http://dx .doi .org/10 .1016/j . amepre .2006 .02 .003 .
17 . Salinas M, López-Garrigós M, Asencio A, Leiva-Salinas M, Lugo J, Leiva-Salinas C . Laboratory utilization improve-ment through a computer-aided algorithm developed with general practitioners . Clin Chem Lab Med 2015;53:1391– 97 .
18 . Salinas M, López-Garrigós M, Flores E, Leiva-salinas M, Ahumada M, Leiva-Salinas C . Education and communica-tion is the key for the successful management of vitamin D test requesting . Biochem Med (Zagreb) 2015;25:237-41 . http://dx .doi .org/10 .11613/BM .2015 .024 .