metals
ArticleFiber Laser Welding of Dissimilar 2205/304 Stainless
Steel Plates
Ghusoon Ridha Mohammed1,2,* ID, Mahadzir Ishak1, Syarifah Nur Aqida Syed Ahmad1 and Hassan Abdulrssoul Abdulhadi1,2
1 Faculty of Mechanical Engineering, University Malaysia Pahang, Pekan 26600, Pahang, Malaysia; mahadzir@ump.edu.my (M.I.); aqida@ump.edu.my (S.N.A.S.A.); h.shamary@gmail.com (H.A.A.) 2 Institute of Technology, Middle Technical University Baghdad, Alzafaranya 10074, Iraq
* Correspondence: ghusoon_ridha@yahoo.com; Tel.: +60-129-457-480
Received: 27 September 2017; Accepted: 27 November 2017; Published: 6 December 2017
Abstract:In this study, an attempt on pulsed-fiber laser welding on an austenitic-duplex stainless steel butt joint configuration was investigated. The influence of various welding parameters, such as beam diameter, peak power, pulse repetition rate, and pulse width on the weld beads geometry was studied by checking the width and depth of the welds after each round of welding parameters combination. The weld bead dimensions and microstructural progression of the weld joints were observed microscopically. Finally, the full penetration specimens were subjected to tensile tests, which were coupled with the analysis of the fracture surfaces. From the results, combination of the selected weld parameters resulted in robust weldments with similar features to those of duplex and austenitic weld metals. The weld depth and width were found to increase proportionally to the laser power. Furthermore, the weld bead geometry was found to be positively affected by the pulse width. Microstructural studies revealed the presence of dendritic and fine grain structures within the weld zone at low peak power, while ferritic microstructures were found on the sides of the weld metal near the SS 304 and austenitic-ferritic microstructure beside the duplex 2205 boundary. Regarding the micro-hardness tests, there was an improvement when compared to the hardness of duplex and austenitic stainless steels base metals. Additionally, the tensile strength of the fiber laser welded joints was found to be higher when compared to the tensile strength of the base metals (duplex and austenitic) in all of the joints.
Keywords: fiber laser welding; dissimilar material; stainless steel; microstructure; hardness; tensile strength
1. Introduction
In the automotive, oil, aerospace, and nuclear power industries, the welding of dissimilar materials is a strategic area of interest [1,2]. Owing to the differences the metallurgical and physico-mechanical behaviour of joined dissimilar materials (DM), they have attracted significant interest when compared to the joints of similar materials. Components with adequate ductility, high strength, good corrosion resistance, and desirable electrical and thermal conductivities have been achieved through DM welding [3,4]. Several DM welding techniques have been reported, including Welding-Brazing [5–7], Arc [8–10], Friction [11], Friction stir [12,13], Ultrasonic [14,15], Explosive welding [16], Laser [17–19], and Hybrid Laser-Arc welding [20,21].
There is an increased risk of encountering problems with DM during welding and in the resultant weldments. The noted problems with DM welding include (a) carbon migration from materials higher carbon content to the materials with less carbon content; (b) the variation in the thermal expansion coefficient of the materials, triggering a deviation of the thermal residual stress over disparate parts of the weldments; and, (c) the challenges in the execution of the post-welding heat treatment, especially
Metals2017,7, 546 2 of 19
in compounds where one of the joined materials is sensitive to an unwanted deposition at elevated temperatures [22]. Consequently, the solution largely depends on high-energy-density techniques, including electron beam and laser beam welding methods, which result in excessive industrial concerns [23].
The laser welding technique, both in continuous and pulse modes, gained interest in the 1960s. The laser welding requires a low heat input during welding, which results in a higher capability of combining heat-susceptible parts with low distortions. The small focusing zone of laser welding is the main reason for its wide application in cropping narrow welding zones with low heat involvement. Additionally, the welded beads from laser welding processes are created with limited residual stress and deformation [24]. To create a high-quality joint between two different materials with different physico-mechanical and metallurgical characteristics while using the laser welding technique, there must be a suitable combination of welding variables [25]. For Arc welding procedures, fiber laser welding (FLW) is one of the extensively recommended techniques due to its precise benefits such as higher efficacy, absence of flux obligation, low defects, low maintenance cost and compact size, good appearance, and simplicity of mechanization [26].
Austenitic stainless steels (ASS) account for about 70% of stainless steel groups. They have a face-centred cubic structure, with individual characteristics, such as weldability, corrosion resistance, toughness, and ductility [27]. Duplex stainless steels (DSS) were developed to accommodate strong bonding and higher resistance to the pitting zones, and stress corrosion cracking to support 300-series ASS [28,29]. When compared to ASS, DSS have greater product strength and stress-corrosion cracking resistance to chlorides. This distinctive feature of the DSS is the reason for their application in many industries such as chemical process plant piping, structures in marine environments, biomedical applications, oil and gas transmission lines, and nuclear power plants [30–36]. DSS is composed of a two-phase microstructure, showing an approximately similar ferrite and austenite balance [37]. Their exclusive properties are completely based on the equal stability exhibited by ferrite and austenite. However, with the duplex steels, it is advised to use a low welding joint energy [38–40].
DM welding is used in many industries for the combination of different stainless steels or with other materials. The reasons for this combination of these dissimilar materials are economical and evolutional. To create a weld joint with the benefits of the dissimilar materials and good service performance, it is necessary to select a suitable welding technique and a proper filler metal [41]. Since laser welding techniques does not involve the use of filler metals, it is therefore obvious that the process parameters play a key role in achieving the desired weld joints. The mechanical properties of stainless steel have strongly been reported to rely on the microstructure of the joint. It is necessary, therefore, to study the relationship of the microstructure with their mechanical properties. Berretta [42] had investigated the pulsed Nd:YAG laser welding of AISI 304–AISI 420 stainless steels, while Anawa [43] experimented on the optimization of the tensile strength of ferritic/austenitic laser-welded components. Similarly, another study has experimented on low carbon and austenitic stainless steels to determine the major parameters that influence the mechanical properties and microstructure of a laser welded joint steel [44]. The study reported that a variation of the laser beam position can be effective in controlling the composition of the fusion zone. Anawa and Olabi [45] statistically studied the dissimilar LBW of stainless steel and low carbon steel and reported a significant influence of the laser power and welding speed on the weld bead characteristics. Torkamany et al. [46] studied low carbon-austenitic stainless steel for the influence of dissimilar laser welding on its mechanical performance and microstructure. The study revealed that the transition of laser welding mode from conduction to keyhole had a significant influence on the size of the fusion zone and dilution percentage of low carbon steel. Even though several works have been reported on the application of laser welding [18,44,47], limited studies are available in the area of fiber laser techniques of dissimilar materials (DM), such as carbon steel with aluminium alloys [44], titanium alloy with steel [48], wrought to powder stainless steel [49], stainless steel to aluminium [50], magnesium alloy to stainless steel [51], and aluminium with titanium [52].
Metals2017,7, 546 3 of 19
In summary, many studies have reported interesting findings on the potential of welding stainless steel. However most of these studies have failed to simultaneously examine the effect of fiber laser welding on dissimilar duplex-austenitic stainless steel. Therefore, this study aims to experimentally investigate the influence of fiber laser parameters on the mechanical and metallurgical characteristics of dissimilar 2205-304 stainless steel plates.
In this study, a fiber laser welding technique was employed to join two dissimilar metals plates (AISI 304 and AISI 2205) of 2 mm thickness. The joined metals were characterized for the tensile test, microhardness, macrostructure, microstructure, and phase composition, using an optical microscope (OM) and scanning electron microscopy (SEM) coupled with an energy dispersive spectrometer (EDS).
2. Materials and Methods
2.1. Base Materials
AISI 2205 duplex and AISI 304 austenitic stainless steels were the metals used in this study, with their chemical composition shown in Table1. Before welding, the metal plates were shaped to sizes,
with L×W×T dimensions of 75×50×2 mm, respectively.
Table 1.Chemical composition of the base metals (wt %).
Elements C Cr Ni Mn Si P S Mo Nb
AISI 2205 0.03 22.07 4.8 1.15 0.53 0.003 0.005 3.65 0.002
AISI 304 0.07 18.3 8.6 1.18 0.47 0.003 0.005 - 0.002
The ASS is made up of randomly linking equiaxed austenite crystals (γ), whereas the DSS entailed of grainy and lengthened particles of ferrite (α) and austenite (γ), respectively, as shown in Figure1a,b. The experimental setup is shown in Figure2.
Metals 2017, 7, 546 3 of 19
fiber laser welding on dissimilar duplex-austenitic stainless steel. Therefore, this study aims to experimentally investigate the influence of fiber laser parameters on the mechanical and metallurgical characteristics of dissimilar 2205-304 stainless steel plates.
In this study, a fiber laser welding technique was employed to join two dissimilar metals plates (AISI 304 and AISI 2205) of 2 mm thickness. The joined metals were characterized for the tensile test, microhardness, macrostructure, microstructure, and phase composition, using an optical microscope (OM) and scanning electron microscopy (SEM) coupled with an energy dispersive spectrometer (EDS).
2. Materials and Methods 2.1. Base Materials
AISI 2205 duplex and AISI 304 austenitic stainless steels were the metals used in this study, with their chemical composition shown in Table 1. Before welding, the metal plates were shaped to sizes, with L × W × T dimensions of 75 × 50 × 2 mm, respectively.
Table 1. Chemical composition of the base metals (wt %).
Elements C Cr Ni Mn Si P S Mo Nb
AISI 2205 0.03 22.07 4.8 1.15 0.53 0.003 0.005 3.65 0.002
AISI 304 0.07 18.3 8.6 1.18 0.47 0.003 0.005 - 0.002
The ASS is made up of randomly linking equiaxed austenite crystals (γ), whereas the DSS entailed of grainy and lengthened particles of ferrite (α) and austenite (γ), respectively, as shown in Figure 1a,b. The experimental setup is shown in Figure 2.
(a) (b)
Figure 1. The microstructure of (a) Austenitic stainless steels (ASS) 304; (b) Duplex stainless steels (DSS) 2205.
Figure 2.The experimental setup.
Figure 1.The microstructure of (a) Austenitic stainless steels (ASS) 304; (b) Duplex stainless steels (DSS) 2205.
Metals 2017, 7, 546 3 of 19
fiber laser welding on dissimilar duplex-austenitic stainless steel. Therefore, this study aims to experimentally investigate the influence of fiber laser parameters on the mechanical and metallurgical characteristics of dissimilar 2205-304 stainless steel plates.
In this study, a fiber laser welding technique was employed to join two dissimilar metals plates (AISI 304 and AISI 2205) of 2 mm thickness. The joined metals were characterized for the tensile test, microhardness, macrostructure, microstructure, and phase composition, using an optical microscope (OM) and scanning electron microscopy (SEM) coupled with an energy dispersive spectrometer (EDS).
2. Materials and Methods 2.1. Base Materials
AISI 2205 duplex and AISI 304 austenitic stainless steels were the metals used in this study, with their chemical composition shown in Table 1. Before welding, the metal plates were shaped to sizes, with L × W × T dimensions of 75 × 50 × 2 mm, respectively.
Table 1. Chemical composition of the base metals (wt %).
Elements C Cr Ni Mn Si P S Mo Nb
AISI 2205 0.03 22.07 4.8 1.15 0.53 0.003 0.005 3.65 0.002 AISI 304 0.07 18.3 8.6 1.18 0.47 0.003 0.005 - 0.002
The ASS is made up of randomly linking equiaxed austenite crystals (γ), whereas the DSS entailed of grainy and lengthened particles of ferrite (α) and austenite (γ), respectively, as shown in Figure 1a,b. The experimental setup is shown in Figure 2.
(a) (b)
Figure 1. The microstructure of (a) Austenitic stainless steels (ASS) 304; (b) Duplex stainless steels (DSS) 2205.
Figure 2.The experimental setup.
Metals2017,7, 546 4 of 19
2.2. Laser Welding
The laser welding studies were conducted using a pulse-mode with an output power of 2 kW.
The fiber laser welding (FLW) was performed at an angle of 10◦ from a vertical position, whereas
the laser was fixed at the joint border. Table2showed the varied parameters (peak power PP, beam diameter BD, pulse width PW, and pulse repetition rate PRR) that were used during the welding process. Argon gas (99.99% purity) at a flow rate of 20 L/min was used as the shielding gas.
Table 2.The fiber laser welding parameters.
No. PP (kW) BD (mm) PW (ms) PRR (Hz) 1 1 0.3 5 15 2 1.2 0.3 5 15 3 1.4 0.3 5 15 4 1.6 0.3 5 15 5 1.8 0.3 5 15 6 1.4 0.24 5 15 7 1.4 0.3 5 15 8 1.4 0.35 5 15 9 1.4 0.4 5 15 10 1.4 0.45 5 15 11 1.4 0.5 5 15 12 1.4 0.35 3 15 13 1.4 0.35 4 15 14 1.4 0.35 5 15 15 1.4 0.35 6 15 16 1.4 0.35 7 15 17 1.4 0.35 8 15 18 1.4 0.3 5 8 19 1.4 0.35 5 10 20 1.4 0.3 5 12 21 1.4 0.3 5 15 22 1.4 0.3 5 18 23 1.4 0.3 5 20 2.3. Metallography
The weld geometry was studied at several weld zones to observe the changes in the bead profile, and weld joint microstructures through low-intensity optical microscopy (MT8000 Series Metallurgical Microscopes, Roanoke, NC, USA) and scanning electron microscopy (SEM) (HITACHI Table Top Microscope TM3030Plus, Schaumburg, IL, USA). Energy dispersive X-ray analysis (EDS, HITACHI, Roanoke, NC, USA) technique has been utilized for the qualitative analysis of the samples.
Metallographic investigations were conducted on a “compound region” of 30 mm×10 mm×2 mm,
which involved all of the weldment regions (base metal, heat-affected, and fusion zones). The samples
were etched with modified Kalling’s solution (5 mg CuCl2in 100 mL ethanol and 100 mL HCl) for a
period of 20 s. The compound weldment regions were polished with alumina and distilled water, using emery sheets of SiC of varied sand sizes ranging from 240 to 1200. The polishing process followed regular metallographic techniques to achieve a perfect mirror finishing of approximately 1µm.
2.4. Mechanical Tests
Figure3shows the weld bead dimensions (W: width of weld bead, D: depth of penetration),
while the micro-hardness was measured at 0.5 mm from the top surface of the welded joint. Vickers hardness analysis technique was applied to study the mechanical behavior by using a hardness tester, Tukon 1202 (Instran ITW Test & Measurement Co., Shanghai, China). Hardness measurements were studied across the interface. Standard 500 gf load was smeared for a residing time of 10 s and the quantities were measured at consistent intervals of 0.20 mm. The tensile tests were performed following
Metals2017,7, 546 5 of 19
the American Society for Testing and Materials (ASTM E8M-04 Standard). Sub-sized specimens were prepared due to the small plate thickness. The samples for the tensile tests were transversely cut to the weld direction and were machined to the dimensions that are presented in Figure4.
Metals 2017, 7, 546 5 of 19
Tukon 1202 (Instran ITW Test & Measurement Co., Shanghai, China). Hardness measurements were studied across the interface. Standard 500 gf load was smeared for a residing time of 10 s and the quantities were measured at consistent intervals of 0.20 mm. The tensile tests were performed following the American Society for Testing and Materials (ASTM E8M-04 Standard. Sub-sized specimens were prepared due to the small plate thickness. The samples for the tensile tests were transversely cut to the weld direction and were machined to the dimensions that are presented in Figure 4.
Figure 3. Weld bead profile and the micro-hardness position across it.
Figure 4. Sketch shows the geometry of (a) the American Society for Testing and Materials (ASTM) E8 standard tensile strength of the laser-welded samples and the base metals; (b) the Sub-sized specimen (all dimensions in mm).
3. Results and Discussion
3.1. The Influence of Weld Parameters on the Weld Profile
3.1.1. Influence of Peak Power on Weld Geometries
The peak power exhibited a continuous effect on the heat input in each individual pulse (Tests
1–5). A linear increase in the weld depth and width was observed at varied peak power rates. The
weld depth was significantly influenced by the increase in peak power when compared to the weld width (see Figure 5a). A maximum depth and width value of 2 mm and 0.9 mm, respectively, at full penetration was recorded at a peak power of 1.8 kW.
Figure 3.Weld bead profile and the micro-hardness position across it.
Metals 2017, 7, 546 5 of 19
Tukon 1202 (Instran ITW Test & Measurement Co., Shanghai, China). Hardness measurements were studied across the interface. Standard 500 gf load was smeared for a residing time of 10 s and the quantities were measured at consistent intervals of 0.20 mm. The tensile tests were performed following the American Society for Testing and Materials (ASTM E8M-04 Standard. Sub-sized specimens were prepared due to the small plate thickness. The samples for the tensile tests were transversely cut to the weld direction and were machined to the dimensions that are presented in Figure 4.
Figure 3. Weld bead profile and the micro-hardness position across it.
Figure 4. Sketch shows the geometry of (a) the American Society for Testing and Materials (ASTM) E8 standard tensile strength of the laser-welded samples and the base metals; (b) the Sub-sized specimen (all dimensions in mm).
3. Results and Discussion
3.1. The Influence of Weld Parameters on the Weld Profile
3.1.1. Influence of Peak Power on Weld Geometries
The peak power exhibited a continuous effect on the heat input in each individual pulse (Tests
1–5). A linear increase in the weld depth and width was observed at varied peak power rates. The
weld depth was significantly influenced by the increase in peak power when compared to the weld width (see Figure 5a). A maximum depth and width value of 2 mm and 0.9 mm, respectively, at full penetration was recorded at a peak power of 1.8 kW.
Figure 4.Sketch shows the geometry of (a) the American Society for Testing and Materials (ASTM) E8 standard tensile strength of the laser-welded samples and the base metals; (b) the Sub-sized specimen (all dimensions in mm).
3. Results and Discussion
3.1. The Influence of Weld Parameters on the Weld Profile
3.1.1. Influence of Peak Power on Weld Geometries
The peak power exhibited a continuous effect on the heat input in each individual pulse (Tests1–5). A linear increase in the weld depth and width was observed at varied peak power rates. The weld depth was significantly influenced by the increase in peak power when compared to the weld width
(see Figure 5a). A maximum depth and width value of 2 mm and 0.9 mm, respectively, at full
Metals2017,7, 546 6 of 19
Metals 2017, 7, 546 6 of 19
(a) (b)
Figure 5. Effects of (a) peak power and;(b)laser diameter on weld width and depth. 3.1.2. Laser Beam Diameter Effects on Weld Geometries
Figure 5b shows a decrease in the weld penetration depth and weld width with the laser beam diameter (Tests 6–11). The decrease in the weld width was due to the decline in the applied laser ray focal point. However, a decrease in the beam diameter caused an increase in the laser density at the same laser power, which effectively increased the weld depth. The optimum values were the obtained at a laser beam diameter of 0.35 mm, which fashioned almost a weld depth and width of 1.38 mm and 0.79 mm, respectively.
3.1.3. Influence of Pulse Width on the Weld Geometries
The pulse width demonstrated a bilateral influence on the weld bead dimensions (Tests 12–17). Figure 6a showed that the best weld dimensions can be achieved at the optimum value, depending on the materials involved and the thickness of the joined parts. The weld depth reached the maximum value with increasing pulse length due to the increased system pulse overlapping. Furthermore, there was a decrease in the weld depth as the pulse width exceeded the optimal value, but, on the weld width, there was no significant effect. The decrease in the laser power is attributed the effect of the increase in the pulse length and energy decline. An optimal pulse width of 5 ms at 1.4 kW was achieved, resulting in a weld depth of 0.79 mm and weld width of 1.73 mm.
(a) (b)
Figure 6. Influence of (a) pulse width and; (b) pulse repetition rate on the depth and width of the weld bead.
3.1.4. Influence of Pulse Repetition Rate on the Weld Geometries
Figure 6b showed an increasing pattern of the weld width and depth, with an increasing pulse repetition rate (Tests 18–23). This result is largely due to the enhanced pulse overlapping because of an increase in the pulse repetition rate. The pulse overlapping resulted in an increased pulse density, which increased the weld depth. The optimal pulse repetition rate value was obtained at 20 Hz; thereby, producing a weld depth of 1.95 mm and weld width of 0.97 mm.
0 0.5 1 1.5 2 2.5 0 0.5 1 1.5 2 Lengt h (mm) Peak power (kW) Depth Width 0 0.4 0.8 1.2 1.6 2 0 0.2 0.4 0.6 Lengt h (mm) Beam diameter(mm) Depth Width 0 1 2 0 2 4 6 8 10 Lengt h (mm) Pulse width (ms) Depth Width 0 0.5 1 1.5 2 2.5 0 5 10 15 20 25 Lengt h (mm)
Pulse repetition rate (Hz) Depth
Width
Figure 5.Effects of (a) peak power and; (b) laser diameter on weld width and depth.
3.1.2. Laser Beam Diameter Effects on Weld Geometries
Figure5b shows a decrease in the weld penetration depth and weld width with the laser beam
diameter (Tests6–11). The decrease in the weld width was due to the decline in the applied laser ray focal point. However, a decrease in the beam diameter caused an increase in the laser density at the same laser power, which effectively increased the weld depth. The optimum values were the obtained at a laser beam diameter of 0.35 mm, which fashioned almost a weld depth and width of 1.38 mm and 0.79 mm, respectively.
3.1.3. Influence of Pulse Width on the Weld Geometries
The pulse width demonstrated a bilateral influence on the weld bead dimensions (Tests12–17). Figure6a showed that the best weld dimensions can be achieved at the optimum value, depending on the materials involved and the thickness of the joined parts. The weld depth reached the maximum value with increasing pulse length due to the increased system pulse overlapping. Furthermore, there was a decrease in the weld depth as the pulse width exceeded the optimal value, but, on the weld width, there was no significant effect. The decrease in the laser power is attributed the effect of the increase in the pulse length and energy decline. An optimal pulse width of 5 ms at 1.4 kW was achieved, resulting in a weld depth of 0.79 mm and weld width of 1.73 mm.
Metals 2017, 7, 546 6 of 19
(a) (b)
Figure 5. Effects of (a) peak power and;(b)laser diameter on weld width and depth. 3.1.2. Laser Beam Diameter Effects on Weld Geometries
Figure 5b shows a decrease in the weld penetration depth and weld width with the laser beam diameter (Tests 6–11). The decrease in the weld width was due to the decline in the applied laser ray focal point. However, a decrease in the beam diameter caused an increase in the laser density at the same laser power, which effectively increased the weld depth. The optimum values were the obtained at a laser beam diameter of 0.35 mm, which fashioned almost a weld depth and width of 1.38 mm and 0.79 mm, respectively.
3.1.3. Influence of Pulse Width on the Weld Geometries
The pulse width demonstrated a bilateral influence on the weld bead dimensions (Tests 12–17). Figure 6a showed that the best weld dimensions can be achieved at the optimum value, depending on the materials involved and the thickness of the joined parts. The weld depth reached the maximum value with increasing pulse length due to the increased system pulse overlapping. Furthermore, there was a decrease in the weld depth as the pulse width exceeded the optimal value, but, on the weld width, there was no significant effect. The decrease in the laser power is attributed the effect of the increase in the pulse length and energy decline. An optimal pulse width of 5 ms at 1.4 kW was achieved, resulting in a weld depth of 0.79 mm and weld width of 1.73 mm.
(a) (b)
Figure 6. Influence of (a) pulse width and; (b) pulse repetition rate on the depth and width of the weld bead.
3.1.4. Influence of Pulse Repetition Rate on the Weld Geometries
Figure 6b showed an increasing pattern of the weld width and depth, with an increasing pulse repetition rate (Tests 18–23). This result is largely due to the enhanced pulse overlapping because of an increase in the pulse repetition rate. The pulse overlapping resulted in an increased pulse density, which increased the weld depth. The optimal pulse repetition rate value was obtained at 20 Hz; thereby, producing a weld depth of 1.95 mm and weld width of 0.97 mm.
0 0.5 1 1.5 2 2.5 0 0.5 1 1.5 2 Lengt h (mm) Peak power (kW) Depth Width 0 0.4 0.8 1.2 1.6 2 0 0.2 0.4 0.6 Lengt h (mm) Beam diameter(mm) Depth Width 0 1 2 0 2 4 6 8 10 Lengt h (mm) Pulse width (ms) Depth Width 0 0.5 1 1.5 2 2.5 0 5 10 15 20 25 Lengt h (mm)
Pulse repetition rate (Hz) Depth
Width
Figure 6. Influence of (a) pulse width and; (b) pulse repetition rate on the depth and width of the weld bead.
3.1.4. Influence of Pulse Repetition Rate on the Weld Geometries
Figure6b showed an increasing pattern of the weld width and depth, with an increasing pulse repetition rate (Tests18–23). This result is largely due to the enhanced pulse overlapping because of an increase in the pulse repetition rate. The pulse overlapping resulted in an increased pulse density, which increased the weld depth. The optimal pulse repetition rate value was obtained at 20 Hz; thereby, producing a weld depth of 1.95 mm and weld width of 0.97 mm.
Metals2017,7, 546 7 of 19
3.2. Metallography and Visual Examination
Macro and Microstructure of the Welded Joint
A top view of the fiber-laser welded dissimilar joints is illustrated in Figure7, showing the different zones (fusion zone (FZ), HAZ) of the welded seam for the joined plates. The Macrograph of the weld geometry of the welding tests that were studied during the analysis is presented in Figure8. As shown in the Figures, several variables (dimensions of the welds) and their effects were determined by the presence of a persistent variable. Samples1–5were used to scrutinize the behavior of the peak power, while Samples6–11were studied to reflect the effect of laser beam diameter. Samples12–17
were used to show the properties of the pulse width, while Samples18–23were studied for the effects of the pulse repetition rate.
Metals 2017, 7, 546 7 of 19
3.2. Metallography and Visual Examination
Macro and Microstructure of the Welded Joint
A top view of the fiber-laser welded dissimilar joints is illustrated in Figure 7, showing the different zones (fusion zone (FZ), HAZ) of the welded seam for the joined plates. The Macrograph of the weld geometry of the welding tests that were studied during the analysis is presented in Figure 8. As shown in the Figures, several variables (dimensions of the welds) and their effects were determined by the presence of a persistent variable. Samples 1–5 were used to scrutinize the behavior of the peak power, while Samples 6–11 were studied to reflect the effect of laser beam diameter. Samples 12–17 were used to show the properties of the pulse width, while Samples 18–23 were studied for the effects of the pulse repetition rate.
Figure 7. Plan view of the seam welding.
Figure 8. Macrograph of the weld geometry, depth, and width of appointed samples. The numbers shown are referred to the welding tests listed in Table 2.
Figure 7.Plan view of the seam welding.
Metals 2017, 7, 546 7 of 19
3.2. Metallography and Visual Examination
Macro and Microstructure of the Welded Joint
A top view of the fiber-laser welded dissimilar joints is illustrated in Figure 7, showing the different zones (fusion zone (FZ), HAZ) of the welded seam for the joined plates. The Macrograph of the weld geometry of the welding tests that were studied during the analysis is presented in Figure 8. As shown in the Figures, several variables (dimensions of the welds) and their effects were determined by the presence of a persistent variable. Samples 1–5 were used to scrutinize the behavior of the peak power, while Samples 6–11 were studied to reflect the effect of laser beam diameter. Samples 12–17 were used to show the properties of the pulse width, while Samples 18–23 were studied for the effects of the pulse repetition rate.
Figure 7. Plan view of the seam welding.
Figure 8. Macrograph of the weld geometry, depth, and width of appointed samples. The numbers shown are referred to the welding tests listed in Table 2.
Figure 8.Macrograph of the weld geometry, depth, and width of appointed samples. The numbers shown are referred to the welding tests listed in Table2.
Metals2017,7, 546 8 of 19
A macro investigation showed narrow welded beads of 2205-304 stainless steel welded joints with complete fusion (Figure8). A fast interaction of solid metals and molten liquids, as well as the formation of metallic vapors at high laser power intensity, results in instability in the weld pool during keyhole laser welding. On one side, it encourages deep laser penetration, and on the other hand, it controls the welded bead profile by governing the different patterns of heat transfer and fluid flow in the welded pool which can lead to various surface deformations [53].
During fusion welding, the deformation of the welded surface can assume a convex or concave profile (the convex weld bead profiles are profiles that protrude above the joining material, while those that form a dip are termed concave weld bead profiles). Few studies have been reported on the mechanisms that are responsible for the shape of weld bead profiles [54–56]. The effect of surface
deformation and melt flow on weld bead formation was first investigated by Bradstreet [57] when
correlated the bead profile of a convex-shaped profile to the surface tension, which controls edge wetting in the weld pool. Similarly, several reasons, such as the aspect ratio, heat transfer, melt flow, pressure balance, and welding speed account for the development of concave-shaped weld bead profiles [53,58–60].
The weld microstructure of various materials is highly complex because of different cooling rates in the laser welding process [61]. On the other hand, steadiness in the microstructures at different weld locations can be determined. The micrographic examination was performed on a cross-section of the 2205-304 dissimilar welded joints (Figure9).
Metals 2017, 7, 546 8 of 19
A macro investigation showed narrow welded beads of 2205-304 stainless steel welded joints with complete fusion (Figure 8). A fast interaction of solid metals and molten liquids, as well as the formation of metallic vapors at high laser power intensity, results in instability in the weld pool during keyhole laser welding. On one side, it encourages deep laser penetration, and on the other hand, it controls the welded bead profile by governing the different patterns of heat transfer and fluid flow in the welded pool which can lead to various surface deformations [53].
During fusion welding, the deformation of the welded surface can assume a convex or concave profile (the convex weld bead profiles are profiles that protrude above the joining material, while those that form a dip are termed concave weld bead profiles). Few studies have been reported on the mechanisms that are responsible for the shape of weld bead profiles [54–56]. The effect of surface deformation and melt flow on weld bead formation was first investigated by Bradstreet [57] when correlated the bead profile of a convex-shaped profile to the surface tension, which controls edge wetting in the weld pool. Similarly, several reasons, such as the aspect ratio, heat transfer, melt flow, pressure balance, and welding speed account for the development of concave-shaped weld bead profiles [53,58–60].
The weld microstructure of various materials is highly complex because of different cooling rates in the laser welding process [61]. On the other hand, steadiness in the microstructures at different weld locations can be determined. The micrographic examination was performed on a cross-section of the 2205-304 dissimilar welded joints (Figure 9).
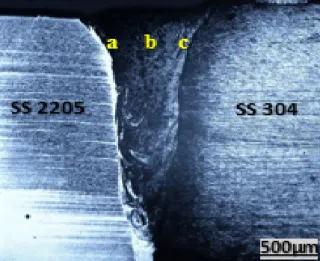
Figure 9. Micrograph of fiber-laser welding dissimilar 2205-304 stainless steels (SS).
The study was conducted to examine and analyse several points at the fusion zone and near the base metals. Figure 10a shows the microstructure (mainly a mixture of ferrite and austenite) present at the 2205 DSS base metals near the 2205 DSS (point “a” in Figure 9). Conversely, the microstructure at the position closer to the 2205 stainless steel was improved and additionally subtle than the initial dual phase assembly of the 2205 SS. A superior cooling rate is considered responsible for this behavior in laser welding [39,62,63]. Figure 10b showed the microstructures in the fusion zone (FZ), and at the boundary between the FZ and the base metals (point “b” in Figure 9). Larger grains were observed in the FZ, while fine grains were noted in the BM section. The fine grains in the FZ were bordered by the coarse grains of the two diverse metal sides due to dynamic recrystallization [64].
In Figure 10b, the longitudinal columnar grain structures were dispersed at the principal area of the FZ along the vertical direction. The area next to the BM was categorized by the equiaxed particles, as shown in Figure 10a,c (point “c” in Figure 9). Paralleled-lined structures were observed on the side of the ASS near the central equiaxed particle structures and the neighboring boundaries, are presented in Figure 10c.
Figure 9.Micrograph of fiber-laser welding dissimilar 2205-304 stainless steels (SS).
The study was conducted to examine and analyse several points at the fusion zone and near the base metals. Figure10a shows the microstructure (mainly a mixture of ferrite and austenite) present at the 2205 DSS base metals near the 2205 DSS (point “a” in Figure9). Conversely, the microstructure at the position closer to the 2205 stainless steel was improved and additionally subtle than the initial dual phase assembly of the 2205 SS. A superior cooling rate is considered responsible for this behavior in laser welding [39,62,63]. Figure10b showed the microstructures in the fusion zone (FZ), and at the boundary between the FZ and the base metals (point “b” in Figure9). Larger grains were observed in the FZ, while fine grains were noted in the BM section. The fine grains in the FZ were bordered by the coarse grains of the two diverse metal sides due to dynamic recrystallization [64].
In Figure10b, the longitudinal columnar grain structures were dispersed at the principal area of the FZ along the vertical direction. The area next to the BM was categorized by the equiaxed particles, as shown in Figure10a,c (point “c” in Figure9). Paralleled-lined structures were observed on the side of the ASS near the central equiaxed particle structures and the neighboring boundaries, are presented in Figure10c.
Metals2017,7, 546 9 of 19
Metals 2017, 7, 546 9 of 19
(a) (b) (c)
Figure 10. Microstructure of the fusion zone in 2205-304 dissimilar welding: Grain shape close to (a) 2205 side, (b) in the center line of the fusion zone, (c) close to 304 side.
A proper fusion of the base metals was achieved with the predetermined process parameters using fibre laser welding technique. The SEM observations of various weld metal microstructure at room temperature of some selected AISI 304 samples welded with duplex 2205 are listed in Figure 11. Generally, the final microstructure of all the weldments can be standardized by the chemical composition of the parent metals and the thermal cycle of the welding process, as the stainless steel welds had four potential solidification modes namely, fully ferritic, primary ferritic, primary austenitic, and fully austenitic [65,66].
Figure 11. SEM of the weld zone of selected samples. The sample numbers displayed on the graphs refer to the welding tests listed in Table 2.
Figure 10. Microstructure of the fusion zone in 2205-304 dissimilar welding: Grain shape close to (a) 2205 side, (b) in the center line of the fusion zone, (c) close to 304 side.
A proper fusion of the base metals was achieved with the predetermined process parameters using fibre laser welding technique. The SEM observations of various weld metal microstructure at room temperature of some selected AISI 304 samples welded with duplex 2205 are listed in Figure11. Generally, the final microstructure of all the weldments can be standardized by the chemical composition of the parent metals and the thermal cycle of the welding process, as the stainless steel welds had four potential solidification modes namely, fully ferritic, primary ferritic, primary austenitic, and fully austenitic [65,66].
Metals 2017, 7, 546 9 of 19
(a) (b) (c)
Figure 10. Microstructure of the fusion zone in 2205-304 dissimilar welding: Grain shape close to (a) 2205 side, (b) in the center line of the fusion zone, (c) close to 304 side.
A proper fusion of the base metals was achieved with the predetermined process parameters using fibre laser welding technique. The SEM observations of various weld metal microstructure at room temperature of some selected AISI 304 samples welded with duplex 2205 are listed in Figure 11. Generally, the final microstructure of all the weldments can be standardized by the chemical composition of the parent metals and the thermal cycle of the welding process, as the stainless steel welds had four potential solidification modes namely, fully ferritic, primary ferritic, primary austenitic, and fully austenitic [65,66].
Figure 11. SEM of the weld zone of selected samples. The sample numbers displayed on the graphs refer to the welding tests listed in Table 2.
Figure 11.SEM of the weld zone of selected samples. The sample numbers displayed on the graphs refer to the welding tests listed in Table2.
Metals2017,7, 546 10 of 19
Type A (fully austenite) or AF (austenite to ferrite) principally refers to austenite solidification, which results in diverse austenite and ferrite morphologies. The FA (ferrite to austenite) mode signifies emaciated and/or stripped ferrite caused by ferrite to austenite transformation; F symbolizes acicular ferrite with a particle boundary of austenite, as illustrated in (Figure9). A successive transformation of ferrite to austenite ensues in solid form within a temperature range of 1300–800◦C [33]. Additionally, an increase in the Creq/Nieqratio results in a higher ferrite propensity foundation and altering of the
solidification approach from A and AF to FA or F [67].
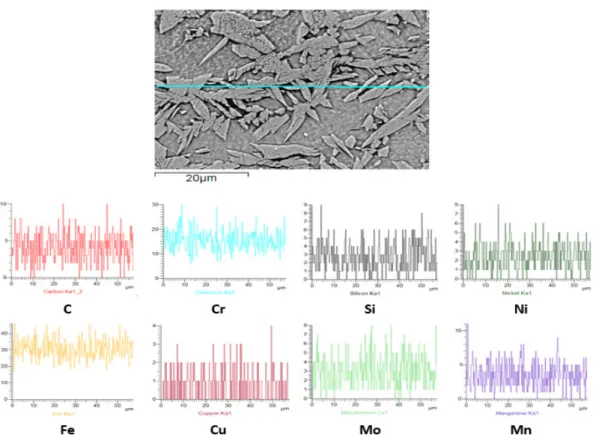
SEM investigations (point b in Figure9) revealed the formation of delta ferrite at the center line of the FZ due to the higher cooling level during laser welding, as shown in (Figure11). On the 304 austenitic SS side (point c in Figure9), a significant decrease in the austenite quantity was observed, and the microstructure largely comprised of ferrite materials (Figure12). The chemical composition of the welded metals near 304 SS were studied using EDS; the line mapping of the weldment is shown in Figure13, and the elements that were analyzed included both ferrite (Cr, Mo, Si, Fe) and austenite (Ni, C, Mn) stabilizing elements; while, the analyses and the corresponding values are presented in Table3. Moreover, Table3also presents the chemical composition of the 304 stainless
steel. Commencing the WRC-1992 diagram [68], it is expected that the weld microstructures would
enclose a combination of austenite and ferrite, containing approximately 11–18% of ferrite. The Creq
value was equivalent to 19 and the Nieqvalue was close to 11, giving a Creq/Nieqratio of 1.73 and that
means the solidification process led to ferritic formation, as previously reported [69,70]. Table 3.Chemical composition of 304SS base metal and the weld zone near 304 SS.
Position Fe Cr Ni Cu Si V Mo Mn
Base 304 54.46 14.8 5.96 1.48 0.53 0.09 0.18 1.49
WZ near 304 51.04 15.8 5.23 0.09 0.57 0.05 1.44 1.14
Metals 2017, 7, 546 10 of 19
Type A (fully austenite) or AF (austenite to ferrite) principally refers to austenite solidification, which results in diverse austenite and ferrite morphologies. The FA (ferrite to austenite) mode signifies emaciated and/or stripped ferrite caused by ferrite to austenite transformation; F symbolizes acicular ferrite with a particle boundary of austenite, as illustrated in (Figure 9). A successive transformation of ferrite to austenite ensues in solid form within a temperature range of 1300–800 °C
[33]. Additionally, an increase in the Creq/Nieq ratio results in a higher ferrite propensity foundation
and altering of the solidification approach from A and AF to FA or F [67].
SEM investigations (point b in Figure 9) revealed the formation of delta ferrite at the center line of the FZ due to the higher cooling level during laser welding, as shown in (Figure 11). On the 304 austenitic SS side (point c in Figure 9), a significant decrease in the austenite quantity was observed, and the microstructure largely comprised of ferrite materials (Figure 12). The chemical composition of the welded metals near 304 SS were studied using EDS; the line mapping of the weldment is shown in Figure 13, and the elements that were analyzed included both ferrite (Cr, Mo, Si, Fe) and austenite (Ni, C, Mn) stabilizing elements; while, the analyses and the corresponding values are presented in Table 3. Moreover, Table 3 also presents the chemical composition of the 304 stainless steel. Commencing the WRC-1992 diagram [68], it is expected that the weld microstructures would enclose
a combination of austenite and ferrite, containing approximately 11–18% of ferrite. The Creq value was
equivalent to 19 and the Nieq value was close to 11, giving a Creq/Nieq ratio of 1.73 and that means the
solidification process led to ferritic formation, as previously reported [69,70].
Table 3. Chemical composition of 304SS base metal and the weld zone near 304 SS.
Position Fe Cr Ni Cu Si V Mo Mn
Base 304 54.46 14.8 5.96 1.48 0.53 0.09 0.18 1.49
WZ near 304 51.04 15.8 5.23 0.09 0.57 0.05 1.44 1.14
Figure 12. SEM of the weld zone microstructure at points near SS 304.
Metals2017,7, 546 11 of 19
Metals 2017, 7, 546 11 of 19
Figure 13. Energy dispersive spectrometer (EDS) line mapping analysis of duplex-austenitic stainless steel weldment.
At test number 5, a solidification crack was detected on the side of 304 SS at a peak power of 1.8
kW due to the high peak power value. The crack was instigated from the center of the weld and it was directed towards the base metal, as illustrated in Figure 14. The diverse thermal and physical (heat capacity, thermal conductivity; and the relationship between hardness and temperature) behaviors of the materials, which were supposed to weld in DSS metal welding resulted in a general symmetrical distortion. In contrast to the duplex stainless steel, the tested specimens did not exhibit any extensive warp. This behavior of austenitic stainless steel is due to their less hardness and heat conductivity at elevated temperatures. This behavior has been recognized in the friction welding of different weldments, such as stainless steel to copper, steel to aluminum, and steel to titanium [26,71,72].
Figure 14. Solidification crack in the fusion zone at 304 side.
The basis of crack-susceptible microstructure in stainless steels is the evolution of impurity-developed and low-melting liquid films along the grain boundaries in the final phase of the solidification process [53,73]. The influence of ferrite content in welds on the solidification and cracking at room temperature has long been documented, but it has not been accurately linked with the cracking sensitivity. A greater focus has been on the solidification behavior of stainless steel welds
Figure 13.Energy dispersive spectrometer (EDS) line mapping analysis of duplex-austenitic stainless steel weldment.
At test number5, a solidification crack was detected on the side of 304 SS at a peak power of 1.8 kW due to the high peak power value. The crack was instigated from the center of the weld and it was directed towards the base metal, as illustrated in Figure14. The diverse thermal and physical (heat capacity, thermal conductivity; and the relationship between hardness and temperature) behaviors of the materials, which were supposed to weld in DSS metal welding resulted in a general symmetrical distortion. In contrast to the duplex stainless steel, the tested specimens did not exhibit any extensive warp. This behavior of austenitic stainless steel is due to their less hardness and heat conductivity at elevated temperatures. This behavior has been recognized in the friction welding of different weldments, such as stainless steel to copper, steel to aluminum, and steel to titanium [26,71,72].
Metals 2017, 7, 546 11 of 19
Figure 13. Energy dispersive spectrometer (EDS) line mapping analysis of duplex-austenitic stainless steel weldment.
At test number 5, a solidification crack was detected on the side of 304 SS at a peak power of 1.8
kW due to the high peak power value. The crack was instigated from the center of the weld and it was directed towards the base metal, as illustrated in Figure 14. The diverse thermal and physical (heat capacity, thermal conductivity; and the relationship between hardness and temperature) behaviors of the materials, which were supposed to weld in DSS metal welding resulted in a general symmetrical distortion. In contrast to the duplex stainless steel, the tested specimens did not exhibit any extensive warp. This behavior of austenitic stainless steel is due to their less hardness and heat conductivity at elevated temperatures. This behavior has been recognized in the friction welding of different weldments, such as stainless steel to copper, steel to aluminum, and steel to titanium [26,71,72].
Figure 14. Solidification crack in the fusion zone at 304 side.
The basis of crack-susceptible microstructure in stainless steels is the evolution of impurity-developed and low-melting liquid films along the grain boundaries in the final phase of the solidification process [53,73]. The influence of ferrite content in welds on the solidification and cracking at room temperature has long been documented, but it has not been accurately linked with the cracking sensitivity. A greater focus has been on the solidification behavior of stainless steel welds
Figure 14.Solidification crack in the fusion zone at 304 side.
The basis of crack-susceptible microstructure in stainless steels is the evolution of impurity-developed and low-melting liquid films along the grain boundaries in the final phase of the solidification process [53,73]. The influence of ferrite content in welds on the solidification and cracking at room
Metals2017,7, 546 12 of 19
temperature has long been documented, but it has not been accurately linked with the cracking sensitivity. A greater focus has been on the solidification behavior of stainless steel welds [74–76]. For alloys that display a Creq/Nieqratio of less than 1.5, austenite is the key phase of solidification.
With an increment in the Creq/Nieqratio (1.5 to 2.0), the primary solidification is promoted by ferrite.
Duplex stainless steels are those that solidify completely to ferrite (Creq/Nieq> 2) [39]. They exhibit
cracking vulnerability to indeterminate alloys that experience complete austenitic and ferritic/austenitic solidifications [33]. In the welding process, most of the produced duplex weld metals are initially solidified in a fully ferritic mode. At the fusion line of the base metal, there is a higher rate of ferritic solidification within the weld metal. In the DSS weld, ferrite grains are encouraged to form a coarse columnar structure as a reasonable and epitaxial result of the growth of ferrite grains. Figure15showed that in the weld metal with excessive ferrite content, the austenite aggregate drops; the morphology modifies to granular form; and, fine precipitation appears in the ferrite. Austenite precipitates in the cooling process of a welded metal from a temperature of 1300◦C to 800◦C due to the higher free energy of the ferrite grain interfaces. The degree of precipitation is governed by the cooling rate and chemical composition of the compound [77,78]. However, the austenite morphology (Widmanstätten or intergranular) plates are largely based on the cooling rates and the size of the ferrite grains [33].
Metals 2017, 7, 546 12 of 19
[74–76]. For alloys that display a Creq/Nieq ratio of less than 1.5, austenite is the key phase of
solidification. With an increment in the Creq/Nieq ratio (1.5 to 2.0), the primary solidification is
promoted by ferrite. Duplex stainless steels are those that solidify completely to ferrite (Creq/Nieq > 2)
[39]. They exhibit cracking vulnerability to indeterminate alloys that experience complete austenitic and ferritic/austenitic solidifications [33]. In the welding process, most of the produced duplex weld metals are initially solidified in a fully ferritic mode. At the fusion line of the base metal, there is a higher rate of ferritic solidification within the weld metal. In the DSS weld, ferrite grains are encouraged to form a coarse columnar structure as a reasonable and epitaxial result of the growth of ferrite grains. Figure 15 showed that in the weld metal with excessive ferrite content, the austenite aggregate drops; the morphology modifies to granular form; and, fine precipitation appears in the ferrite. Austenite precipitates in the cooling process of a welded metal from a temperature of 1300 °C to 800 °C due to the higher free energy of the ferrite grain interfaces. The degree of precipitation is governed by the cooling rate and chemical composition of the compound [77,78]. However, the austenite morphology (Widmanstätten or intergranular) plates are largely based on the cooling rates and the size of the ferrite grains [33].
Figure 15. SEM of weld microstructures at a point near 2205 side.
3.3. Mechanical Tests
3.3.1. Microhardness
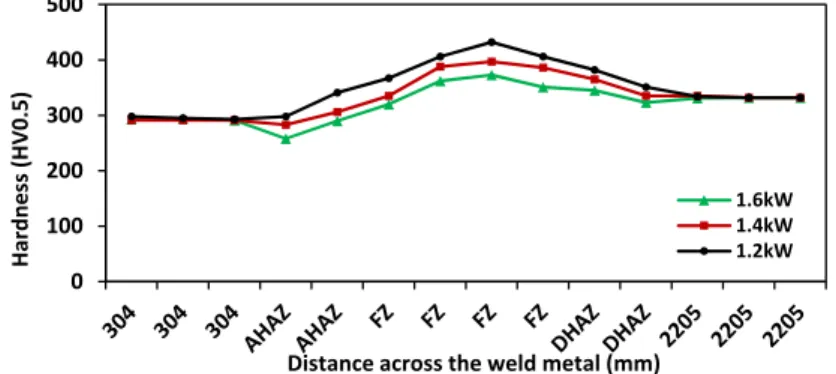
The microhardness profiles of the weld regions (304-AHAZ-FZ-DHAZ-2205) are presented in Figures 16 and 17. AHAZ refers to the austenitic heat-affected zone, while DHAZ refers to duplex heat-affected zone. Specimens were selected for the microhardness studies based on the peak power (Tests 2,3,4) and pulse width (Tests 12,14,16) of the welding process. All of the microhardness profiles in Figure 16 and 17 have the same tendency. The hardness increases in the weld zone and decreases towards the base metals.
Figure 16. Microhardness profile along the welded line of dissimilar joints at different peak powers. 0 100 200 300 400 500 Har dness (HV0.5)
Distance across the weld metal (mm)
1.6kW 1.4kW 1.2kW Figure 15.SEM of weld microstructures at a point near 2205 side. 3.3. Mechanical Tests
3.3.1. Microhardness
The microhardness profiles of the weld regions (304-AHAZ-FZ-DHAZ-2205) are presented in
Figures16and17. AHAZ refers to the austenitic heat-affected zone, while DHAZ refers to duplex
heat-affected zone. Specimens were selected for the microhardness studies based on the peak power (Tests2,3,4) and pulse width (Tests12,14,16) of the welding process. All of the microhardness profiles in Figures16and17have the same tendency. The hardness increases in the weld zone and decreases towards the base metals.
Metals 2017, 7, 546 12 of 19
[74–76]. For alloys that display a Creq/Nieq ratio of less than 1.5, austenite is the key phase of
solidification. With an increment in the Creq/Nieq ratio (1.5 to 2.0), the primary solidification is
promoted by ferrite. Duplex stainless steels are those that solidify completely to ferrite (Creq/Nieq > 2)
[39]. They exhibit cracking vulnerability to indeterminate alloys that experience complete austenitic and ferritic/austenitic solidifications [33]. In the welding process, most of the produced duplex weld metals are initially solidified in a fully ferritic mode. At the fusion line of the base metal, there is a higher rate of ferritic solidification within the weld metal. In the DSS weld, ferrite grains are encouraged to form a coarse columnar structure as a reasonable and epitaxial result of the growth of ferrite grains. Figure 15 showed that in the weld metal with excessive ferrite content, the austenite aggregate drops; the morphology modifies to granular form; and, fine precipitation appears in the ferrite. Austenite precipitates in the cooling process of a welded metal from a temperature of 1300 °C to 800 °C due to the higher free energy of the ferrite grain interfaces. The degree of precipitation is governed by the cooling rate and chemical composition of the compound [77,78]. However, the austenite morphology (Widmanstätten or intergranular) plates are largely based on the cooling rates and the size of the ferrite grains [33].
Figure 15. SEM of weld microstructures at a point near 2205 side.
3.3. Mechanical Tests
3.3.1. Microhardness
The microhardness profiles of the weld regions (304-AHAZ-FZ-DHAZ-2205) are presented in Figures 16 and 17. AHAZ refers to the austenitic heat-affected zone, while DHAZ refers to duplex heat-affected zone. Specimens were selected for the microhardness studies based on the peak power (Tests 2,3,4) and pulse width (Tests 12,14,16) of the welding process. All of the microhardness profiles in Figure 16 and 17 have the same tendency. The hardness increases in the weld zone and decreases towards the base metals.
Figure 16. Microhardness profile along the welded line of dissimilar joints at different peak powers. 0 100 200 300 400 500 Har dness (HV0.5)
Distance across the weld metal (mm)
1.6kW 1.4kW 1.2kW
Metals2017,7, 546 13 of 19
Metals 2017, 7, 546 13 of 19
Figure 17. The cross-sectional Vickers microhardness profile of welds joint different pulse width. For the peak power effect, the fusion zone presented a higher microhardness when compared to those of the base materials (AISI 304 and AISI 2205), likely being due to the rapid solidification effect. The microhardness and elemental (Cr, Fe, and Ni) redistribution gradients are positively correlated, which may be a special attribute of dissimilar joints [79]. The fusion zone of the laser keyhole welds had a rapid cooling rate of about 104 and 106 °C·s−1 [80] which not only increased the probabilities of
under-cooling and nucleation with the attendant formation of fine structures, but also extended the solubility of the solutes, thereby preventing marked segregation and resulted in a supersaturated solid solution with new microstructures [81]. The microhardness of the weld HAZ was less than that of the weld metal, but greater than that of the base metals at both sides due to the earlier stated reasons. Figure 16 revealed the hardness dispersal across the welded regions, which indicates that the hardness was greater on the DSS side when compared to the ASS side. The BM regions showed an average hardness of 292 HV in the austenitic stainless steel 304 side and 332 HV for the duplex stainless steel 2205 side. The microhardness values increased in the FZ section, with a calculated maximum hardness value of 432 HV. This indicates that the FLW enhanced the hardness of the material to the level of about 32% and 23% for the duplex and austenitic stainless steel, respectively. The higher heating of laser welding is beneficial for the growth of ferrite, which is primed to immensely increase the hardness of the FZ region. Thus, the principal factor that is affecting the hardness in the FZ region is mainly ferrite formation.
For the pulse width effect, the operational parameters of sample 12, 14, and 16 differed in the pulse width (3, 5, and 7 ms, respectively). The welding parameters influenced the mode of solidification and cooling rate of the welding zone. Also, the microstructure of the weld zone was noted to change with the welding parameters as well. Moreover, the microhardness profile of the samples affected the variations in their cooling rate. In Figure 17, sample 16 (from Table 2) had the highest hardness value of 453 HV when compared to samples 12 and 14 with hardness values of 363 and 421 HV, respectively, due to the variation in the cooling rate. The cooling rate increases with the pulse duration.
3.3.2. Tensile Strength
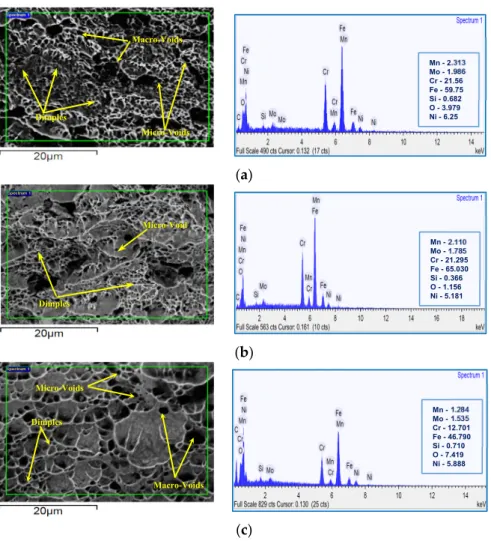
The tensile tests performed on the fiber laser butt welded joints with complete penetration based on the impact of peak power (Tests 3, 4, 5 inTable 2). The tests were conducted following the relevant standards at room temperature. Three samples from each condition were subjected to the tensile strength test and the average of the triplicates was reported. Figure 18 presents the typical engineering stress-strain curve of the samples. The SEM analysis accomplished, to show the fracture manner of tensile test (brittle or ductile failures), as shown in (Figure 19a–c). Moreover, the EDS analysis was carried out to exhibit the redistribution of elements in the weld zone that form as a result to the fiber laser welding of dissimilar metals (2205-304).
0 100 200 300 400 500 Har dness (HV0.5)
Distance across the weld metal (mm)
3ms 5ms 7ms
Figure 17.The cross-sectional Vickers microhardness profile of welds joint different pulse width.
For the peak power effect, the fusion zone presented a higher microhardness when compared to those of the base materials (AISI 304 and AISI 2205), likely being due to the rapid solidification effect. The microhardness and elemental (Cr, Fe, and Ni) redistribution gradients are positively correlated, which may be a special attribute of dissimilar joints [79]. The fusion zone of the laser keyhole welds had a rapid cooling rate of about 104 and 106◦C·s−1[80] which not only increased the probabilities of under-cooling and nucleation with the attendant formation of fine structures, but also extended the solubility of the solutes, thereby preventing marked segregation and resulted in a supersaturated solid
solution with new microstructures [81]. The microhardness of the weld HAZ was less than that of
the weld metal, but greater than that of the base metals at both sides due to the earlier stated reasons. Figure16revealed the hardness dispersal across the welded regions, which indicates that the hardness was greater on the DSS side when compared to the ASS side. The BM regions showed an average hardness of 292 HV in the austenitic stainless steel 304 side and 332 HV for the duplex stainless steel 2205 side. The microhardness values increased in the FZ section, with a calculated maximum hardness value of 432 HV. This indicates that the FLW enhanced the hardness of the material to the level of about 32% and 23% for the duplex and austenitic stainless steel, respectively. The higher heating of laser welding is beneficial for the growth of ferrite, which is primed to immensely increase the hardness of the FZ region. Thus, the principal factor that is affecting the hardness in the FZ region is mainly ferrite formation.
For the pulse width effect, the operational parameters of sample 12, 14, and 16 differed in the pulse width (3, 5, and 7 ms, respectively). The welding parameters influenced the mode of solidification and cooling rate of the welding zone. Also, the microstructure of the weld zone was noted to change with the welding parameters as well. Moreover, the microhardness profile of the samples affected the variations in their cooling rate. In Figure17, sample 16 (from Table2) had the highest hardness value of 453 HV when compared to samples 12 and 14 with hardness values of 363 and 421 HV, respectively, due to the variation in the cooling rate. The cooling rate increases with the pulse duration.
3.3.2. Tensile Strength
The tensile tests performed on the fiber laser butt welded joints with complete penetration based on the impact of peak power (Tests3,4,5in Table2). The tests were conducted following the relevant standards at room temperature. Three samples from each condition were subjected to the tensile strength test and the average of the triplicates was reported. Figure18presents the typical engineering stress-strain curve of the samples. The SEM analysis accomplished, to show the fracture manner of tensile test (brittle or ductile failures), as shown in (Figure19a–c). Moreover, the EDS analysis was carried out to exhibit the redistribution of elements in the weld zone that form as a result to the fiber laser welding of dissimilar metals (2205-304).
Metals2017,7, 546 14 of 19
Metals 2017, 7, 546 14 of 19
Figure 18. Typical trend of the 2205-304 in stress-strain diagram.
(a)
(b)
(c)
Figure 19. SEM image and EDS analysis of fiber-laser welded tensile-tested joints at (a) 1.4 kW; (b) 1.6 kW; and (c) 1.8 kW.
From the SEM fractographs of the tensile tested of peak power 1.4, 1.6, and 1.8 kW weldments using, the presence of dimpled facets with the macro/micro-voids coalesced in shiny, fibrous fringes were clearly shown, signifying the ductile mode of the fracture. Also, the 1.8 kW weldments showed shallow ridges with more voids and dimples, which contributed to the ductile fracture. The percentage elongation of the 1.4 kW weldments was also noted to be greater, which further confirmed the absence of any deleterious phase in the fusion zone.
The presence of Mn, Cr, Ni, Fe, Si, and Mo were confirmed from the EDS analysis. The fractography in Figure 19a showed a dimpled pattern, which indicates that a ductile fracture was shown, while in Figure 19b,c, deep dimples were depicted when compared to Figure 19a, which indicates an improved ductility. From Figure 19a, chromium, and manganese were observed to have
0 200 400 600 800 0 0.2 0.4 0.6 Stress ( Mpa) Strain 1.4kW 1.6kW 1.8kW Dimples Mn - 2.110 Mo - 1.785 Cr - 21.295 Fe - 65.030 Si - 0.366 O - 1.156 Ni - 5.181 Macro-Voids Dimples Mn - 1.284 Mo - 1.535 Cr - 12.701 Fe - 46.790 Si - 0.710 O - 7.419 Ni - 5.888 Mn - 2.313 Mo - 1.986 Cr - 21.56 Fe - 59.75 Si - 0.682 O - 3.979 Ni - 6.25 Micro-Void Dimples Micro-Voids Micro-Voids Macro-Voids
Figure 18.Typical trend of the 2205-304 in stress-strain diagram.
Metals 2017, 7, 546 14 of 19
Figure 18. Typical trend of the 2205-304 in stress-strain diagram.
(a)
(b)
(c)
Figure 19. SEM image and EDS analysis of fiber-laser welded tensile-tested joints at (a) 1.4 kW; (b) 1.6 kW; and (c) 1.8 kW.
From the SEM fractographs of the tensile tested of peak power 1.4, 1.6, and 1.8 kW weldments using, the presence of dimpled facets with the macro/micro-voids coalesced in shiny, fibrous fringes were clearly shown, signifying the ductile mode of the fracture. Also, the 1.8 kW weldments showed shallow ridges with more voids and dimples, which contributed to the ductile fracture. The percentage elongation of the 1.4 kW weldments was also noted to be greater, which further confirmed the absence of any deleterious phase in the fusion zone.
The presence of Mn, Cr, Ni, Fe, Si, and Mo were confirmed from the EDS analysis. The fractography in Figure 19a showed a dimpled pattern, which indicates that a ductile fracture was shown, while in Figure 19b,c, deep dimples were depicted when compared to Figure 19a, which indicates an improved ductility. From Figure 19a, chromium, and manganese were observed to have
0 200 400 600 800 0 0.2 0.4 0.6 Stress ( Mpa) Strain 1.4kW 1.6kW 1.8kW Dimples Mn - 2.110 Mo - 1.785 Cr - 21.295 Fe - 65.030 Si - 0.366 O - 1.156 Ni - 5.181 Macro-Voids Dimples Mn - 1.284 Mo - 1.535 Cr - 12.701 Fe - 46.790 Si - 0.710 O - 7.419 Ni - 5.888 Mn - 2.313 Mo - 1.986 Cr - 21.56 Fe - 59.75 Si - 0.682 O - 3.979 Ni - 6.25 Micro-Void Dimples Micro-Voids Micro-Voids Macro-Voids
Figure 19. SEM image and EDS analysis of fiber-laser welded tensile-tested joints at (a) 1.4 kW; (b) 1.6 kW; and (c) 1.8 kW.
From the SEM fractographs of the tensile tested of peak power 1.4, 1.6, and 1.8 kW weldments using, the presence of dimpled facets with the macro/micro-voids coalesced in shiny, fibrous fringes were clearly shown, signifying the ductile mode of the fracture. Also, the 1.8 kW weldments showed shallow ridges with more voids and dimples, which contributed to the ductile fracture. The percentage elongation of the 1.4 kW weldments was also noted to be greater, which further confirmed the absence of any deleterious phase in the fusion zone.
The presence of Mn, Cr, Ni, Fe, Si, and Mo were confirmed from the EDS analysis.
Metals2017,7, 546 15 of 19
was shown, while in Figure19b,c, deep dimples were depicted when compared to Figure19a, which
indicates an improved ductility. From Figure19a, chromium, and manganese were observed to have
the highest presence, indicating a higher tensile strength in the fractured joint when compared to the base material (AISI 2205 and AISI 304). The presence of oxygen, which suggests the oxidation of the material due to the presence of Fe, was noted in the three samples (Figure19a–c). In Figure19c, Mo notably had the lowest presence, pointing towards more ductility. A maximum percentage of Cr was observed in Figure19a, which might be due to the increased tensile strength of the joint.
At a tensile stress range of 611, 646, and 674 MPa, respectively, the entire welded sample broke from the joint during the testing with a corresponding percentage elongation of about 39%, 43%, and 54%, respectively. During the tensile testing, failures at the weldment were due to the low strength of the welds due to their slightly increased hardness. The welded specimens and the base metal had similar tensile properties only that the ductility of the welded joint was somewhat lower when compared to that of the base metal because of the decreased amount of austenite in the welded joint as compared to the base metal. An increased Cr/Ni ratio resulted in the presence of ferrite in the solidified weld region and consequently increased the tensile strength of the weld material [67].
It is worthy to note that despite the higher volume of austenite in this study, an increase in the heat input did not significantly affect the tensile elongation of the laser welded joint which was likely due to the larger size of the fusion zone with a higher heat input. In other words, the decrease in the tensile elongation because of the fusion zone size was more than the austenite volume effect on increasing the tensile elongation.
4. Conclusions
Detailed experiments were carried out under diverse process environments, and based on the microstructural studies using OM, SEM, and EDS the following conclusions are made:
• Fiber-laser welding was effectively employed to produce austenitic–duplex stainless steels weldments.
• Weld bead profiles and hardness can be articulated in terms of the method parameters.
• The mechanical properties of the produced DSS-ASS joints were better when compared to that of
the base metals due to the small HAZ that resulted from the laser welding and the advantageous effect of rapid solidification in the fusion zone.
• Using fiber-laser welding in the austenitic-duplex steel joint significantly increased the
microhardness, largely because of the presence of ferrite structures. High heat inputs resulted in coarse grain size formation and a decrease in the microhardness values.
• In the 2205-304 joints, regions with a fully austenitic solidification mode were prone to
solidification cracking.
• The welded joints had an average tensile strength of 611, 643, and 674 MPa, respectively, all
satisfying the tensile strength requirements for engineering structures.
• From the SEM results, the presence of micro-voids and dimples confirmed the ductile mode
of fracture.
• The small HAZ and the beneficial effects of rapid solidification in the fusion zone were demonstrated in the improved mechanical properties of the laser welds. The fusion zone microstructure demands further investigations using TEM. Also, there is a need to conduct a detailed study on the fractures behaviour and welding defects of dissimilar jointed materials.
Acknowledgments: The authors are grateful to Universiti Malaysia Pahang (UMP), Pekan, Malaysia, for the financial support given under grant no. RDU150378 and GRS 1503107.
Author Contributions: Ghusoon Ridha Mohammed and Mahadzir Ishak conceived the design, designed the
experiments, analysed the data; performed the experiments and wrote the paper; Syarifah Nur Aqida Syed Ahmad and Hassan Abdulrssoul Abdulhadi provided the reagents, materials and analysis tools.
Conflicts of Interest:The authors declare no conflict of interest. The funding sponsors had no role in the design of the study, data collection, analyses of the data, writing of the manuscript, and the decision to publish the results.