2018
Identification and QTL mapping of physiological
drivers of soybean yield under contrasting
management systems using high-throughput
phenotyping
Race Heith Higgins
Iowa State University
Follow this and additional works at:https://lib.dr.iastate.edu/etd
Part of theAgriculture Commons, and thePlant Sciences Commons
This Dissertation is brought to you for free and open access by the Iowa State University Capstones, Theses and Dissertations at Iowa State University Digital Repository. It has been accepted for inclusion in Graduate Theses and Dissertations by an authorized administrator of Iowa State University Digital Repository. For more information, please [email protected].
Recommended Citation
Higgins, Race Heith, "Identification and QTL mapping of physiological drivers of soybean yield under contrasting management systems using high-throughput phenotyping" (2018).Graduate Theses and Dissertations. 16723.
by
Race Heith Higgins
A dissertation submitted to the graduate faculty
in partial fulfillment of the requirements for the degree of
DOCTOR OF PHILOSOPHY
Major: Plant Breeding
Program of Study Committee: Asheesh K. Singh, Major Professor
Thomas Lubberstedt Maria Salas Fernandez
Andrew VanLoocke Michael Castellano
The student author, whose presentation of the scholarship herein was approved by the program of study committee, is solely responsible for the content of this dissertation. The
Graduate College will ensure this dissertation is globally accessible and will not permit alterations after a degree is conferred.
Iowa State University
Ames, Iowa
2018
DEDICATION
This dissertation is dedicated to Tylor Schlader, my parents, and siblings, all who
TABLE OF CONTENTS
Page
LIST OF FIGURES ... vi
LIST OF TABLES ... viii
NOMENCLATURE ... x
ABSTRACT ... xi
CHAPTER 1. GENERAL INTRODUCTION ... 1
Dissertation Organization ... 1
Brief Literature Review for each chapter ... 1
Physiological drivers of soybean traits ... 1
Biomass partitioning and residue quality ... 4
QTL mapping of vegetative indices ... 6
CHAPTER 2. SEEDING RATE INFLUCENCE ON YIELD COMPONENTS OF DIVERSE SOYBEAN AND DETAILED PHENTOYPING TO ELUCIDATE YIELD RESPONSE... 9
Abstract ... 9
1. Introduction ... 10
2. Materials and methods ... 13
2.1. Plant Materials ... 13
2.2. Plant Measurements ... 14
2.3. Data and Analysis ... 15
3. Results ... 17
3.1. Genotype, Seeding rate, and Genotype x SR effects ... 18
3.2. Physiological drivers of soybean yield under contrasting seeding rates ... 19
4. Discussion ... 21
4.1. Genotype, Seeding rate, and Genotype x SR effects ... 21
4.2. Physiological drivers of soybean yield under contrasting seeding rates ... 23
5. Conclusions ... 26
References ... 27
Tables and figures ... 34
CHAPTER 3. UNCOVERING BIOMASS PARTITIONING AND RESIDUE QUALITY TRAITS FOR SOYBEAN IMPROVEMENT ... 45
Abstract ... 45
1. Introduction ... 46
2. Materials and methods ... 49
2.1 Plant Materials ... 49 2.2 Experimental Design ... 49 2.3 Plant Measurements ... 50 2.4 Data Analysis ... 51 3. Results ... 52 3.1 Biomass partitioning... 52 3.2 Residue quality ... 53 4. Discussion ... 54 4.1 Biomass partitioning... 54 4.2 Residue quality ... 55 5. Conclusion ... 56 Acknowledgments ... 58 References ... 58
Tables and figures ... 61
CHAPTER 4. LINKAGE MAPPING OF QTL FOR YIELD-RELATED VEGETATION INDICES IN A SOYBEAN NESTED ASSOCIATION MAPPING POPULATION ... 71
Abstract ... 71
Abbreviations ... 72
1. Introduction ... 72
2. Materials and Methods ... 75
2.1 Plant Materials and Field Trials ... 75
2.2 Phenotyping ... 76
2.3 Phenotypic Data Analysis ... 77
3. Results ... 79
3.1 Phenotypic Evaluation ... 79
3.2 Correlations Between Traits ... 80
3.3 Linkage Map Construction ... 80
3.4 QTL Analysis of Grain Yield and Vegetative Indices ... 81
4. Discussion ... 82
4.1 Correlations Between Traits and Yield ... 82
4.2 Yield and Vegetative Index QTL ... 83
4.3 Potential Application of QTL in Soybean Breeding ... 84
5. Conclusion ... 85
Acknowledgments ... 85
References ... 86
Tables and figures ... 92
CHAPTER 5. GENERAL CONCLUSIONS ... 107
REFERENCES ... 110
LIST OF FIGURES
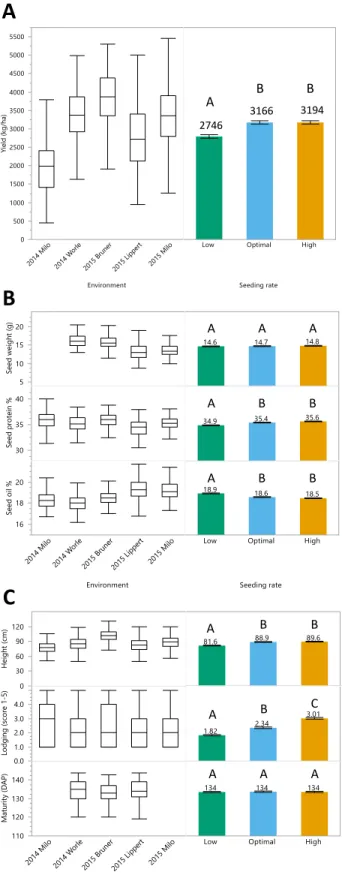
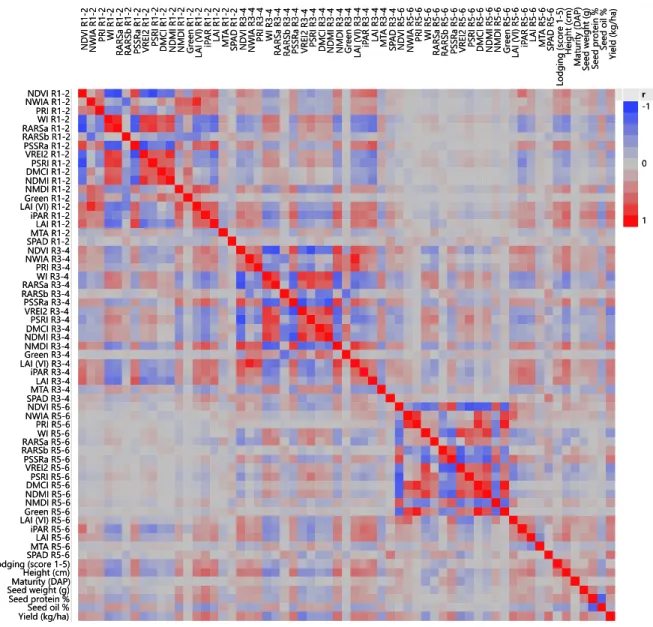
Page Figure 2.1 Boxplot distributions by environment and bar chart by seeding rate ... 37 Figure 2.2 Heatmap of Pearson correlations at three reproductive growth stages
between physiological traits, agronomic traits, seed components, and final yield. ... 38 Figure 2.3 Adaptive elastic net yield prediction for three seeding rates of low, optimal,
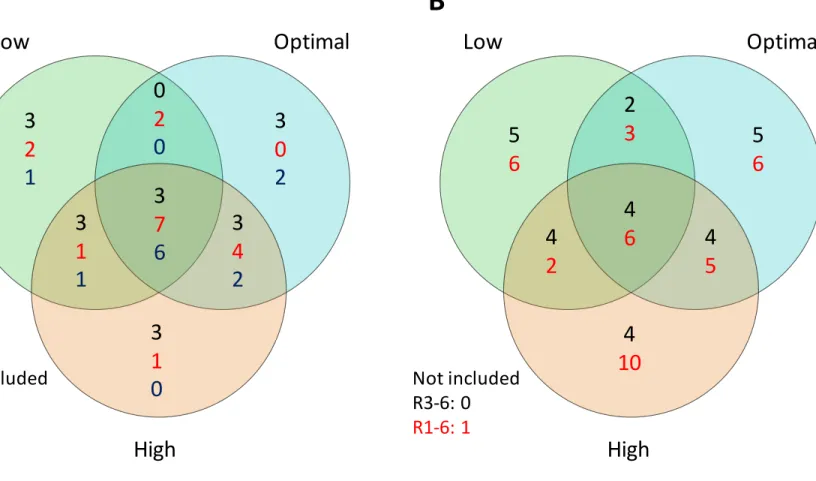
and high across reproductive growth stages ... 40 Figure 2.4 Venn diagram of shared and unique physiological traits selected by
adaptive elastic net models at three seeding rates ... 42 Figure 2.5 Frequency histogram of plant emergence for three target seeding rates of
low, optimal, and high in five replicated environments ... 43 Figure 2.6 Relationship between seed yield, seed oil percentage, and seed protein
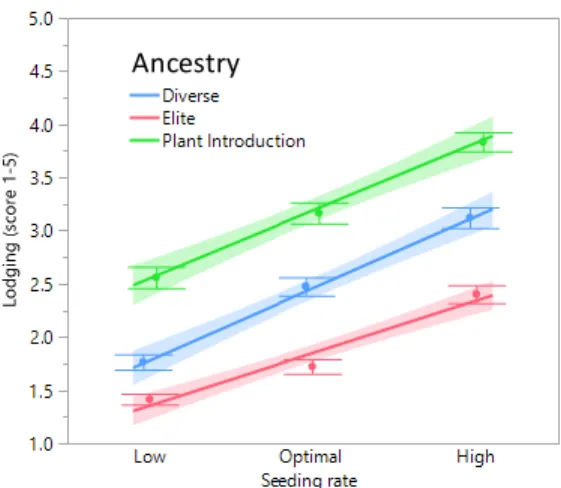
percentage for five locations. ... 43 Figure 2.7 Mean lodging scores for three seeding rates of low, optimal, and high and
three ancestry categories of elite, diverse, and plant introduction. ... 44 Figure 2.8 Feature selection stability for 10 repeated 5 k-fold cross-validations of
adaptive elastic net models. ... 44 Figure 3.1 Flow diagram of biomass sample collection and partitioning ... 62 Figure 3.2 Boxplots of a) biomass weight (g) by experiment year-location and growth
stage and b) average C:N ratio by experiment year-location. ... 63 Figure 3.3 Biomass component dry weights by reproductive growth stage and
genotype. ... 65 Figure 3.4 Biomass component percentages by reproductive growth stage and
genotype. ... 66 Figure 3.5 Plot of a) weighted C:N ratios by biomass composition for all soybean
genotypes of the final residue biomass excluding seed and b) mean seed
yield of the previously ordered genotypes by C:N ratio ... 69 Figure 3.6 Curvilinear relationship between nitrogen harvest index and harvest index. ... 70 Figure 4.1 Boxplot distribution of vegetation indices and yield by environments
Figure 4.2 Heatmap of Pearson’s correlations between vegetation index and yield
BLUPs by growth stage. ... 97 Figure 4.3 Bar chart of Pearson’s correlations between vegetative index BLUPs and
grain yield BLUPs ... 98 Figure 4.4 Genetic linkage map of chromosomes 1, 3, 10, and 18 with QTL for
vegetation indices and yield ... 100 Figure 4.5 Genetic linkage map of soybean chromosomes 1-20 with marker names. ... 101
LIST OF TABLES
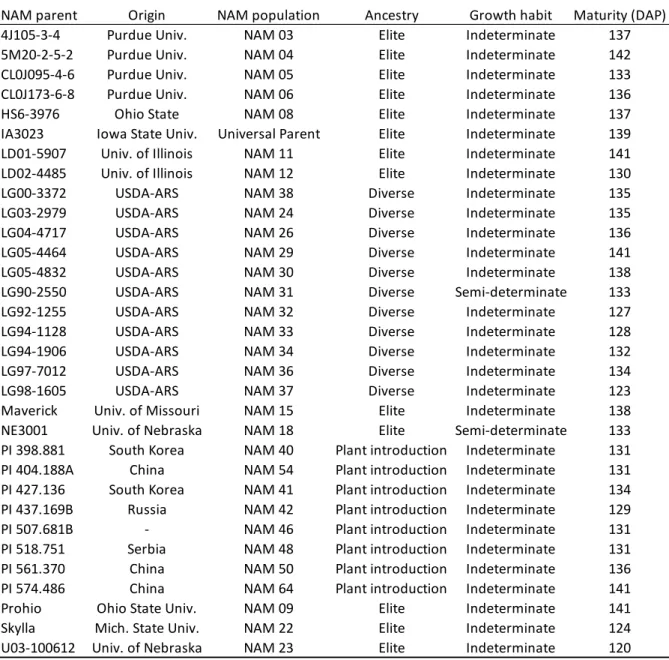
Page Table 2.1 Origin, population number, and maturity grouping of the soybean NAM
parental genotype subset assessed in this study. ... 34 Table 2.2 Summary of vegetation indices with abbreviation, general class type, and
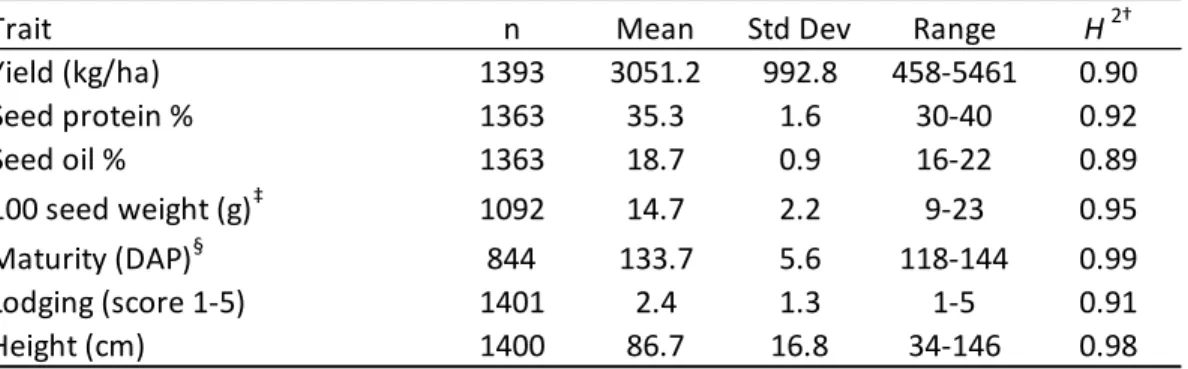
source. ... 35 Table 2.3 Yield, seed components, and agronomic trait summaries with count, mean,
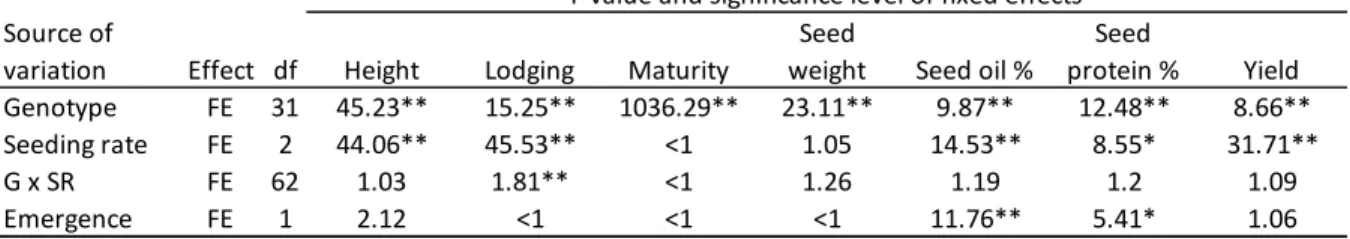
standard deviation, range, and Broad-sense heritabilities. ... 35 Table 2.4 ANOVA of yield, seed components, and agronomic traits of five
environments and three replications by genotype. ... 36 Table 2.5 ANOVA of yield, seed components, and agronomic traits of five
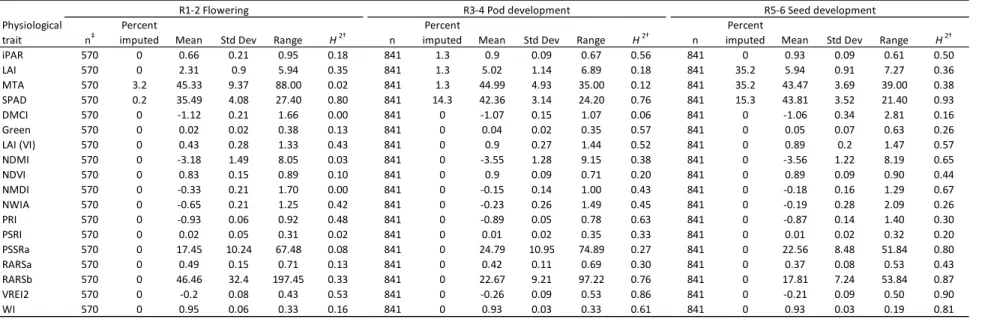
environments and three replications by ancestry. ... 36 Table 2.6 Summary data of physiological traits by growth stage ... 39 Table 2.7 List of physiological traits selected by adaptive elastic net regularized
regression ... 41 Table 3.1 Origin, population number, and maturity grouping of the soybean NAM
parental genotype subset assessed in this study. ... 61 Table 3.2 Mean, range, standard deviation, ANOVA genotype factor significance,
and heritability for biomass weights and percentage for three growth stages .... 64 Table 3.3 Pearson’s correlations and significance for biomass percentages, total
biomass weights, and agronomic traits at growth stages R1, R4, and R8. ... 67 Table 3.4 Pearson’s correlations and significance for seed weight and harvest index
with biomass percentages at growth stages R1, R4, and R8 and agronomic traits. ... 68 Table 3.5 Mean, range, standard deviation, ANOVA genotype factor significance,
and heritability for C:N ratios for three growth stages ... 68 Table 4.1 Summary of parental genotype information ... 92 Table 4.2 Summary of selected vegetation indices with abbreviation, general class
type, equation, and source. ... 92 Table 4.3 Summary of vegetation indices and yield ... 94 Table 4.4 Analysis of Variance and broad-sense heritabilities for vegetation indices
Table 4.5 Pearson’s correlations and p-values of vegetation index and yield BLUPs
by growth stage, ... 96 Table 4.6 Summary of soybean chromosomes ... 99 Table 4.7 Summary of QTL identified for five vegetation indices and yield ... 105 Table 4.8 List of 41 QTL reported for traits related to vegetation indices on
NOMENCLATURE
C:N ratio Carbon:nitrogen ratio
GY Grain yield
H2 Broad-sense heritability
MAS Marker-assisted selection
NAM Nested association mapping
QTL Quantitative trait locus/loci
RIL Recombinant inbred line
SoyNAM Soybean nested association mapping population
SR Seeding rate
ABSTRACT
Rapid characterization of physiological traits driving yield are becoming desirable
aides to breeding programs to increase the rate of genetic gain. Each chapter in this
dissertation investigates areas related to high-throughput phenotyping and physiological traits
driving soybean yield. Chapter 2 seeks to understand the response of diverse soybean
germplasm to seeding rate. An evaluation of final plot seed yield, seed protein percentage,
seed oil percentage, seed weight, height, maturity, and plant lodging revealed a significant
genotype x seeding rate interaction only for lodging, suggesting current soybean germplasm
and soybean of wide genetic ancestry respond similarly to seeding rate. Our second objective
was to identify physiological traits at multiple growth stages predicting yield response under
contrasting levels of seeding rate. Adaptive elastic net models characterized diverging traits
between seeding rates and determined chlorophyll traits as the leading predictors across
seeding rates. Chapter 3 quantifies biomass partitioning strategies and residue quality
determined through carbon:nitrogen (C:N) ratios in the same diverse panel of SoyNAM
genotypes in Chapter 2. Above-ground plant components were dissected at three
reproductive stages and revealed significant differences in biomass partitioning by R4.
Significant genetic variation in C:N residue quality was found with no apparent negative
relationship to final grain yield. Optimal biomass partitioning strategies for yield and
improved residue C:N ratios for whole-system nitrogen sustainability can be targeted for
yield improvement. Lastly, Chapter 4 includes a QTL mapping study of vegetative indices
used for yield prediction in Chapter 1 in four SoyNAM RIL populations derived from five of
the 32 parent NAM genotypes evaluated in Chapters 1 and 2. Five QTL were detected for
spanning chromosomes 1, 3, 10 and 18. These QTL can serve as aides to MAS in soybean
breeding and inform future studies aimed at dissecting the physiology of soybean grain yield.
The overall research provides insights on soybean biomass partitioning and evidence of the
presence of genetic variation in residue traits; physiological traits to predict yield in diverse
germplasm and row-density management systems; and genomic regions mapped to spectral
CHAPTER 1. GENERAL INTRODUCTION
Dissertation Organization
This dissertation is organized into five chapters. Chapter one provides a brief
literature review focused on the three individual experiments related to high-throughput
phenotyping and physiological traits related to soybean yield. Chapters two, three and four
describe original research and are written in manuscript format for submission to scientific
journals. Chapter two explores agronomic trait responses to seeding rate in diverse soybean
and identifies the underlying physiological traits driving yield under different seeding rates.
Chapter three investigates above-ground biomass partitioning strategies for yield and residue
quality determined through carbon:nitrogen (C:N) ratios for a whole-systems nitrogen
sustainability approach. Chapter four includes a QTL linkage study of vegetative indices
related to soybean yield calculated from remote sensing in a four RIL soybean nested
association mapping population. Lastly, chapter five is a summary of general conclusions.
The knowledge generated from characterization of diverse soybean germplasm in row
spacing treatments enables soybean breeders to utilize the opportunities for more informed
selection with the use of physiological drivers as additional predictor traits in early
generation of population development and selection; residue traits as additional economic
opportunity and selection target and spectral indices QTL for marker assisted selection.
Brief Literature Review for each chapter Physiological drivers of soybean traits
Soybean [Glycine max L. (Merr.)] is globally one of the most widely grown crops,
with the United States as the world's leading soybean producer and the second-leading
management decisions such as seeding rate for optimal economic return (Fawcett et al.,
2017). In response, plant breeders are challenged to create soybean cultivars adapted to new
environments (Chang et al., 2015; Zanon et al., 2016) and management practices (Wilson et
al., 2014; Grassini et al., 2015). Genetic gain and adaption is driven by genetic diversity, but
incorporating diverse germplasm into elite breeding programs presents challenges (Duvick,
1984). How germplasm will respond to various modern management practices such as
seeding rate will need to be addressed to facilitate future use in breeding programs.
One stress plants must overcome in any production environment is interplant
competition for needed resources like water, light, nutrients, and use of environmental
resources (Weiner and Thomas, 1986). Agronomic practices, such as seeding rate, determine
plant spatial arrangement and inter-plant stress, and soybeans respond to these conditions
with phenotypic plasticity. The observed phenomenon of phenotypic plasticity is the ability
of one genotype to produce more than one phenotype when exposed to different
environments. Several studies have confirmed phenotypic plasticity in soybean, both at
vegetative and reproductive stages (Egli, 1993; Carpenter and Board, 1997; Green-Tracewicz
et al., 2011), and specifically to seeding rate (Elmore, 1998; Board, 2000; Vega, 2000). Soybean’s recorded phenotypic plasticity to altered environments has traditionally made it
difficult to determine optimal seeding rates, as soybeans can produce relatively similar yields
from large changes in seeding rate (Carpenter and Board, 1997; Board, 2000; Edwards et al.,
2005). To achieve a clear understanding of soybean’s yield response to seeding rate requires
identifying the underlying causing physiological traits.
However, several physiological traits respond to various levels of seeding rate. Under
responded to increased plant density over time, but attributed genetic gain in newer cultivars
to greater light use efficiency. Lee et al. (2008) found achieving complete plant canopy
cover, and therefore maximizing light interception, at R1 produced maximum yield in
standard agronomic practices of optimal planting density in their experiment. At lower plant
populations, plant architecture is an important yield component and genetically determined.
Plant branching capacity under stress was an important yield determinant (Frederick et al.,
2001; Ferreira et al., 2016), and branching under low seeding rates was related to increased
yield (Suhre et al., 2014; Agudamu et al., 2016). Studies in general have addressed seeding
rate response to elite lines and their recent modern-adapted predecessors, leaving a gap in
knowledge for seeding rate response in diverse or un-adapted germplasm.
Numerous physiological traits in conjunction forecast soybean yield, and
high-throughput phenotyping platforms have enabled data collection on a greater spatial and
temporal scale (Araus and Cairns, 2014). Remote sensing is a promising tool that rapidly
and non-destructively collects phenotypes correlated to yield, and vegetative indices related
to chlorophyll content, carotenoids, vegetation, water content, and dry matter content are
used in soybean to predict yield (Ma et al., 2001; Bolton and Friedl, 2013; Johnson, 2014)
and measure plant response to stress (Carter, 1994; Nutter Jr et al., 2002; Huang et al., 2016).
In addition to vegetative indices, physiological traits leaf area index (LAI), mean tilt angle
(MTA), intercepted photosynthetically active radiation (iPAR), and estimated chlorophyll
content with a SPAD meter have been shown to correlate with soybean yield (Ma et al.,
1995; Board and Harville, 1996) and can be collected in a rapid manner that complements
the contribution of these traits together, over experiments and plant development stages,
would explain yield response under multiple seeding rates.
Biomass partitioning and residue quality
Decisions regarding crop choice revolve around profitability for the farmer, which is
influenced not singularly by a single season’s crop output, but by impact on the yield of the
succeeding crop seasons as well. It is important to include whole systems approach in
research studies, but as a first step, individual components including genotype responses and
traits need to be measured particularly for seed yield and other economic parts. Soybean
output has improved with greater soybean seed yields, and seed yield and its yield potential is
described by its harvest index, the ratio of seed yield to total biomass. The maximum harvest
index from small grains is estimated to be 0.6, and it was found that modern US Midwestern
soybean cultivars partitioned 60% of its biomass into seed, indicating that breeding has
already succeeded in maximizing harvest index in soybean (Zhu et al., 2010). Pedersen and
Lauer, (2004) found the harvest index for soybean ranged at 56.2 – 58.0% for elite soybean
cultivars in the Midwest, additionally implicating harvest index has been maximized.
Increased harvest index in soybean has resulted from increased seed yield with little increase
in total aboveground biomass (Morrison et al., 2000; Jin et al., 2010), but the relationship
between the composition of the total aboveground biomass to grain yield is unknown.
Srinivasan et al. (2016) showed evidence that modern crop genotypes produce more leaf than
is optimal, and removing leaves resulted in an 8% increase in yield. Identifying genotypes
with optimal biomass partitioning strategies could further advance soybean line development
where harvest index has been maximized and finding the reproductive growth stage when
differences in biomass partitioning first become evident can provide insight to when
Complementing increasing soybean output for greater season profitability and
decreasing input costs through reduced fertilizer requirements of the succeeding crop can be
achieved by improving soybean residue quality. Nitrogen (N), is essential for plant growth
and seed production (Lawlor, 2002) and is the main component of fertilizer. Ubiquitous
maize-soy cropping system in the US Midwest may particularly benefit, as improving the
amount and quality of the soybean residue can contribute to the yield increase of maize in the
succeeding season (Green and Blackmer, 1995) through increasing plant available nitrogen.
Gentry et al. (2013) found net soil nitrogen mineralization was the strongest predictor of
yield difference in continuous corn systems, where net mineralization of soil nitrogen is
influenced by both quality (C:N ratio) and quantity of residue from the previous crop (Gentry
et al., 2001). We hypothesize that soybeans may be further adapted to the maize-soy rotation
by improving the carbon-nitrogen (C:N) ratio in soybean residue, without penalizing grain
yield. Genotypic differences in C:N were found within multiple crop species between wild
and domesticated crops (García-Palacios et al., 2013), and significant genotypic variations in
stem nitrogen traits at maturity were found in modern soybean cultivars (Fritschi et al.,
2013). Dhanapal et al. (2015) further supported finding C:N ratio variation in a collection of
373 soybean genotypes at flowering (R2). A caveat to lower C:N ratios is the concern that
higher amounts of nitrogen in the vegetative plant organs results in less N remobilization to
the seed during grain fill, suggesting a yield penalty, but multiple studies have shown that
direct nitrogen uptake and accumulation during seed fill could be a more important factor for
high seed yield instead of N remobilization (Kumudini et al., 2001; Zhao et al., 2014).
relationship with soybean yield, along with two important seed quality factors, seed protein
and seed oil content.
QTL mapping of vegetative indices
Soybean grain yield is a complex quantitative trait, and maximum yield potential is
constrained by physiological and agronomic traits such as light interception, photosynthetic
capacity, and biomass partitioning (Monteith and Moss, 1977). Historically, the steady
increase in soybean grain yield has been attained through empirical selection for grain yield
over the past century. However, there is evidence that phenotyping for physiological traits, as
a complement to agronomic traits, may help in identifying selectable features that accelerate
breeding for yield potential (Araus and Cairns, 2014; Keep et al., 2016). Currently, the
soybean genetic base is narrow with low diversity, due to a genetic bottleneck after
introduction to the US (Rincker et al., 2014). Introgressing exotic germplasm into cultivars to
increase genetic diversity within domesticated crops has been used to enhance complex traits
such as yield (Tanksley and McCouch, 1997) and may have unknowingly introduced novel
genetic variation for yield-related physiological traits. In soybean, Thompson and Nelson
(1998) tested experimental lines derived from crossing North American cultivars with several
plant introductions, and several of these lines were incorporated into the soybean nested
association mapping (SoyNAM) parent panel, including LG90-2550 and LG94-1128 of this
study. An experimental population of high-yielding elite lines is enriched by including lines
of diverse ancestry because it increases morphological and genetic diversity.
Many changes in morphological and physiological traits in soybean have
accompanied changes in grain yield. Potential soybean yield is closely associated with plant
photosynthesis (Slattery et al., 2017) and chlorophyll concentration affects photosynthetic
energy (Gitelson et al., 2003; Koester et al., 2016). Changes in leaf relative water content
affect total water potential, osmotic potential, and turgor pressure, and therefore influence
whole-plant physiology. Only when there is sufficient turgor pressure can cells expand for
vegetative growth and stomata to open to incorporate carbon dioxide to be used in the Calvin
cycle. (Zygielbaum et al., 2012; Gray et al., 2016). Canopy water content is indicative of
canopy transpiration and determines radiation use efficiency and biomass accumulation in
soybean (Saryoko et al., 2018). Biomass accumulation has long been established as important
driver of potential yield, and is often estimated at leaf area index, or LAI (Ma et al., 1995;
Board and Harville, 1996). Although genetic improvement of physiological traits can
certainly lead to increased grain yield (GY), high-throughput, nondestructive measurements
are necessary to rapidly collect many phenotypes for large mapping populations.
Remote sensing is a promising tool that rapidly and non-destructively collects
vegetative indices related to chlorophyll content, carotenoids, vegetation, water content, and
dry matter content that are used in soybean to predict yield (Ma et al., 2001; Bolton and
Friedl, 2013; Johnson, 2014) and measure plant response to stress (Carter, 1994; Nutter Jr et
al., 2002; Huang et al., 2016). An enormous number of spectral reflectance indices have been
created to monitor vegetation health and productivity (Heinrich et al., 2011). Some indices
have served as the industry standard for analyzing canopy “greenness” and detection of
vegetation, such as the normalized difference vegetation index (Rouse Jr et al., 1974).
However, many different indices have been developed depending on the specific trait to be
monitored, and great advances in remote and proximal sensing technologies are currently
underway. One advance has been the development of hyperspectral reflectance instruments
users to calculate any number of desired spectral reflectance indices pertinent to a trait of
interest (Heinrich et al., 2011).
Quantitative trait loci (QTL) mapping is a key approach for understanding the genetic
architecture of yield components and physiological traits in crops. However, pinpointing
QTL can be hampered by relatively large QTL intervals due to the limited number of
markers. Nested association mapping is an alternative population design that was proposed to
increase the resolution of QTL mapping (Yu and Buckler, 2006). Nested association mapping
populations are developed by crossing multiple diverse founders to a common parent
followed by the development of recombinant inbred lines (RILs) or progenies in each family.
In comparison to traditional QTL mapping, which only uses limited genetic information from
two parents, NAM can increase genetic variation across contributing parental lines, increase
genetic resolution, reduce linkage disequilibrium, and control population structure through
design (Rafalski, 2010). The NAM design has been used successfully in soybean to map
QTL controlling a number of traits such as grain yield stability (Xavier et al., 2018) and
canopy coverage (Xavier et al., 2017). Rapid collection and identification of physiological
predictors driving yield is desirable to breeding programs because they are used as breeding
CHAPTER 2. SEEDING RATE INFLUCENCE ON YIELD COMPONENTS OF DIVERSE SOYBEAN AND DETAILED PHENTOYPING TO ELUCIDATE YIELD
RESPONSE
A paper in preparation for submission to Field Crops Research
R.H. Higgins, A.K. Singh
Highlights
• Soybean genotypes of diverse ancestry respond similarly to seeding rate in terms of yield, seed components, and agronomic traits.
• Yield prediction was highest when physiological trait predictors were measured over multiple reproductive growth stages, enabled through high-throughput phenotyping. • Selected physiological traits for future genetic improvement among and within seeding
rate treatments were identified through adaptive elastic net feature selection and ranking.
Keywords
Soybean; Seeding rate; Seed yield; High-throughput phenotyping; Remote sensing; Adaptive
elastic net
Abstract
Seeding rate impact on soybean [Glycine max L. (Merr.)] yield has steadfastly
remained a subject of agronomic research for decades. Expanding soybean production
sustains interest in management decisions like seeding rate, prompting incorporation of
soybean diversity for future adaptation and genetic gain. However, there is limited
objective of this study was to investigate how final plot seed yield, seed protein percentage,
seed oil percentage, seed weight, height, maturity, and plant lodging responds to seeding rate
in germplasm of diverse ancestries. Our second objective was to identify physiological traits
and the corresponding growth stage window predicting yield response under multiple levels
of seeding rate. A subset of the diverse SoyNAM parent panel consisting of 32 genotypes
was evaluated under three levels of seeding rate in standard yield plots. Replicated RCBD
experiments were grown in five environments in Central Iowa in 2014-2015. Physiological
traits of remote sensing vegetative indices, leaf area index (LAI), mean tilt angle (MTA),
intercepted photosynthetically active radiation (iPAR), and SPAD were measured in three
environments in 2015 over three reproductive growth stages of flowering (R1-2), pod
development (R3-4), and seed development (R5-6). Here we report a significant genotype x
seeding rate interaction was only detected for lodging, and not for yield, seed weight, seed oil
percentage, seed protein percentage, height, or maturity. These results suggest that current
soybean germplasm and soybean of wide genetic ancestry respond similarly to seeding rate
and implies introgression of diverse material may not detrimentally affect yield in response
to seeding rate variations. In addition, physiological traits predicting the yield response
among and within seeding rates were selected and ranked by adaptive elastic net, with
chlorophyll traits determined as the leading predictors across seeding rates. The
characterization of diverging traits between the seeding rate yield models provides targets for
soybean improvement for varied seeding rate practices.
1. Introduction
Soybean [Glycine max L. (Merr.)] is globally one of the most widely grown crops,
with the United States as the world's leading soybean producer and the second-leading
management decisions such as seeding rate for optimal economic return (Fawcett et al.,
2017). In response, plant breeders are challenged to create soybean cultivars adapted to new
environments (Chang et al., 2015; Zanon et al., 2016) and management practices (Grassini et
al., 2015; Wilson et al., 2014). Genetic gain and adaption is driven by genetic diversity, but
incorporating diverse germplasm into elite breeding programs presents challenges (Duvick,
1984). How germplasm will respond to various modern management practices such as
seeding rate will need to be addressed to facilitate future use in breeding programs.
Interplant competition introduces stress environments for plants due to competition
for resources: water, light, nutrients, and environmental resources (Weiner and Thomas,
1986). Agronomic practices, such as seeding rate, determine plant spatial arrangement and
inter-plant stress, and soybeans respond to these conditions with phenotypic plasticity, the
ability of one genotype to produce more than one phenotype when exposed to different
environments. Several studies have confirmed phenotypic plasticity in soybean, both at
vegetative and reproductive stages (Carpenter and Board, 1997; Egli, 1993; Green-Tracewicz
et al., 2011), and specifically to seeding rate (Board, 2000; Elmore, 1998; Vega, 2000). Soybean’s recorded phenotypic plasticity to altered environments has traditionally made it
difficult to determine optimal seeding rates, as soybeans can produce relatively similar yields
from large changes in seeding rate (Board, 2000; Carpenter and Board, 1997; Edwards et al.,
2005). To achieve a clear understanding of soybean’s yield response to seeding rate requires
identifying the underlying causing physiological traits.
However, several physiological traits respond to various levels of seeding rate. Under
increased seeding rates, De Bruin and Pedersen (2009) found soybean yield has not
to greater light use efficiency. Lee et al. (2008) found achieving complete plant canopy
cover, and therefore maximizing light interception, at R1 produced maximum yield. At lower
plant populations, plant architecture is an important yield component and genetically
determined. Plant branching capacity under stress was an important yield determinant
(Ferreira et al., 2016; Frederick et al., 2001), and branching under low seeding rates was
related to increased yield (Agudamu et al., 2016; Suhre et al., 2014). Studies in general have
addressed seeding rate response to elite lines and their recent modern-adapted predecessors,
leaving a gap in knowledge for seeding rate response in diverse or un-adapted germplasm.
Numerous physiological traits in conjunction forecast soybean yield, and
high-throughput phenotyping platforms have enabled data collection on a greater spatial and
temporal scale (Araus and Cairns, 2014). Remote sensing is a promising tool that rapidly
and non-destructively collects phenotypes correlated to yield, and vegetative indices related
to chlorophyll content, carotenoids, vegetation, water content, and dry matter content are
used in soybean to predict yield (Bolton and Friedl, 2013; Johnson, 2014; Ma et al., 2001)
and measure plant response to stress (Carter, 1994; Huang et al., 2016; Nutter Jr et al., 2002).
In addition to vegetative indices, physiological traits leaf area index (LAI), mean tilt angle
(MTA), intercepted photosynthetically active radiation (iPAR), and estimated chlorophyll
content with a SPAD meter have been shown to correlate with soybean yield (Board and
Harville, 1996; Ma et al., 1995) and can be collected in a rapid manner that complements
remote-sensing. Despite methods of more attainable multi-trait collection, it is unknown how
the contribution of these traits together, over experiments and plant development stages,
The objective of this investigation was to determine how germplasm of diverse
ancestries responds to seeding rate, by collecting final plot seed yield, seed protein
percentage, seed oil percentage, seed weight, height, maturity, and plant lodging. Our second
objective was to identify the physiological traits and corresponding growth stage window
predicting yield response under multiple levels of seeding rate. Here we report the results of
an ANOVA analysis on a subset of diverse genotypes from the SoyNAM parent population
under three seeding rates ranging from low to high. We further report which physiological
traits of remote sensing vegetative indices, LAI, MTA, iPAR, and SPAD were identified as
predictors of yield under three levels of seeding rate and three reproductive growth stages.
We aim to further understanding of soybean response to management practices to provide the
breeding and research community tools for yield improvement.
2. Materials and methods 2.1. Plant Materials
For this study, 32 of 41 parent genotypes of the soyNAM panel were selected to be
maturity groups II-III adapted to Central Iowa (Table 2.1). This panel was originally
designed to include a diverse range of germplasm (Stupar and Specht, 2013). Specifically,
genetic ancestry was elite public lines, high-yielding lines of diverse ancestry, or direct plant
introductions. As RIL populations are already developed, further characterization of the
parent panel provides a valuable resource, as the genomic and multi-environmental data for
the soybean nested association mapping dataset is public (Xavier et al., 2015).
Experiments were grown in Central Iowa at a total of five environments at Iowa State University’s experiment stations farm network sites. Planting dates in 2014 were 29 May and
13 May at Worle (41.99, -93.69) and Milo (41.35, -93.40), respectively; while in 2015,
-93.73), and 25 May at Bruner (42.01, -93.73). Plots were fourrows with 0.76 m row width
and 4.6 m long rows. Three fixed treatments of seeding rate, low= 20k plants ha-1, medium=57k plants ha-1 near commercial seeding rate, and high=93k plants ha-1 were
planted in a randomized complete block design with three replications at each location. Seeds
were treated with ApronMaxx® RTA® fungicide treatment to protect the seed during
germination, and plant emergence was measured for the two middle 0.91 m sections of each
yield plot.
2.2. Plant Measurements
Soybean seed yield and seed components protein percentage, oil percentage, and seed
weight were recorded for each location in 2014 and 2015. Approximately three hundred
grams of whole soybean seed was used to quantify seed protein and oil contents using near-infrared reflectance (NIR) spectroscopy (Infratec™ 1241 Grain Analyzer, FOSS) and seed
weights were averaged over a hundred-seed count weight. Before harvest at R8, agronomic
traits of plant height, lodging (score 1-5) and final plant maturity (days after planting, DAP)
were collected in all environments, except for two environments missing maturity and one
environment missing seed weight. Lodging was recorded on a scale from 1-5, with 1 as
upright and 5 as prostrate. Height was the average of two plants representative of the entire
plot from the middle two rows. Grain yield (GY) was harvested at each location for the
middle two rows of each plot with a two-row ALMACO plot combine. GY was determined
as weight of grain harvested per unit area (kg/ha).
High-throughput phenotyping trait physiological data were collected as
non-destructive repeated measures for three environments in 2015. The middle two rows of each
plot were phenotyped at three soybean reproductive growth stages: flowering (R1-2), pod set
recorded for one environment (Milo 2015), therefore this timepoint was excluded from
further analysis. All light measurements were performed at 1000 h to 1400 on clear days.
Leaf chlorophyll content was estimated using a Minolta SPAD-502 Plus chlorophyll meter
with data logger and sampled non-destructively on ten fully-expanded trifoliates in the upper
canopy. Intercepted photosynthetically active radiation (iPAR) was measured with a LI-191R
line quantum sensor (Li-Cor, Inc., Lincoln, NE) with below-canopy measurements
transecting the alley between the middle rows. iPAR was calculated as:
𝐹 = (1 − 𝐼0
𝐼𝑡) × 100%
where F is the fractional amount of radiation interception, Iois the measured incident PAR on
the surface of the ground, and Itis the radiant flux density on top of the canopy. LAI and
MTA were collected with a LAI-2200C plant canopy analyzer (Li-Cor, Inc., Lincoln, NE),
that simultaneously logged iPAR. A single above-canopy measurement with four to six
below-canopy measurements were made along spatially partitioned diagonal transects
between the middle two rows. A canopy gap test was performed as directed in the
LAI-2200C Instruction Manual and a minimum apparent clumping factor of 0.95 determined the
view cap size and number of below-canopy readings. Absolute reflectance remote sensing
data were measured using with a FieldSpec® 4 Hi-Res (ASD Inc., Boulder, CO), which
ranges from 350 to 2500 nm with a single nanometer resolution. A white reference panel
(Specralon® Labsphere Inc., North Dutton, NH) reading for remote-sensing and k-records
for LAI were collected at the beginning of each replication within all sites served as controls.
2.3. Data and Analysis
Plant emergence counts were standardized across seeding rates before use as a
with studentized residuals and Cook’s distance performed in JMP v. 13 (SAS Institute, Cary,
NC). Broad sense heritability for yield, seed components, agronomic traits, and physiological
traits were calculated as:
𝐻2 = σ𝐺 2 σ𝐺2 +σ𝐺𝑆𝑟2 𝑗 + σ𝐺𝐸 2 𝑘 + σ𝐺𝑆𝑟𝐸2 𝑗𝑘 + σ𝑒2 𝑗𝑘𝑟 where σ2
G is the genotypic variance, σ2GSr is the genotype x seeding variance, σ2GE is the
genotype x environment variance, σ2
GSrE is the genotype x seeding rate x environment
variance, σ2
e is the error variance, j is the number of seeding rates, k is the number of
environments, and r is the number of replications. The estimation of REML variance
components was performed in JMP with all effects as random. A mixed ANOVA with a
covariate term was conducted to assess the impact of the fixed effects genotype, seeding rate,
and the genotype x seeding rate interaction on yield, seed components, and agronomic traits.
Random effect terms included environment, genotype x environment, seeding rate x
environment, genotype x seeding rate x environment, and spatial nested terms range
(environment) and pass (environment).
SPAD values were filtered using R-package library (MIPHENO) (Bell et al., 2012)
and averaged for single value per plot, which is a median-based normalization method for
use in datasets where there are no explicit controls. LAI and MTA were estimated with
FV2200 software. ASD Spectra were processed using ViewSpec pro software, and single and
multiple wavebands of absolute reflectance were extracted with R software to calculate the
following vegetative indices (Table 2.2). The multivariate normal imputation utility in JMP
imputed missing physiological trait values. This algorithm uses least squares imputation.
agronomic traits were determined using the multivariate procedure of JMP. Yield prediction
and feature extraction was performed with the regularized regression technique adaptive
Elastic Net in JMP v. 13. Elastic Net alpha was set to 0.09, number of grid points = 150, and
minimum penalty fraction = 0. Yield prediction models were assembled with physiological
traits from growth stages R1-2, R3-4, R5-6, and combinations of R3-6 and R1-6. Models
including growth stage R1-2 consisted of two environments instead of three. Five-fold
validation was performed to avoid inflated estimates of predictive ability, and
cross-validation was repeated 10 times to assess feature selection stability.
3. Results
Mean seed yield pooled across five locations was 3051.22 kg ha-1, and the averages
of seed protein and oil concentration were 35.3% and 18.7%, respectively (
Table 2.3). Broad sense heritabilities calculated for yield, seed components, and
agronomic traits were high with a range from 0.89-0.99 (
Table 2.3). Environments ranked by seed yield from highest to lowest were 2015
Bruner, 2014 Worle, 2015 Milo, 2015 Lippert, and 2014 Milo (Figure 2.1A). There was no
noticeably better yielding year, but there was a strong individual environment effect
considering all locations were in Central Iowa. Although the range of values is large for all
traits, as expected from the diverse panel selected, the values follow a normal distribution,
excluding lodging score, which was skewed to the left (Figure 2.1A-C). The relationship
between seed yield and seed oil was positive, and both were negative with seed protein
(Figure 2.6), and these relationships are generally observed (Wilcox and Shibles, 2001). Plant
consistently varied more at higher seeding rates than lower. Almost entirely distinct clusters
reaffirmed seeding rate effects (Figure 2.5).
3.1. Genotype, Seeding rate, and Genotype x SR effects
A mixed ANOVA with a covariate of plant emergence was used to determine the
fixed treatment effects of yield, seed components, and agronomic traits of the pooled five
location dataset. Genotype was significant for all traits, and seeding rate was significant at
various levels of alpha for all traits excluding seed weight and maturity. The genotype x
seeding rate interaction was not significant for any trait but lodging (Table 2.4).
. Plant emergence appeared to influence seed composition traits protein and oil, but
no others (Table 2.4).
When determining which levels of seeding rate were significantly different from each
other, yield, seed protein, and protein percentage, and plant height revealed a similar pattern.
We found that the low seeding rate treatment was significantly different from optimal and
high treatment, but the optimal and high seeding rate treatment were no different from each
other. Yield, seed oil percentage, and height were greater in optimal and high seeding rates,
and lower in the low seeding rate. The inverse observation was true for seed protein
percentage, i.e., lower in optimal and high seeding rates, and higher in the low seeding rate.
Lodging was significantly different for each level of seeding rate and increased from low to
high seeding rate.
Lodging was the only trait to reveal a significant genotype x seeding rate interaction
effect. Genotypes were clustered by ancestry to show lodging was lowest in elite lines,
followed by diverse, and highest for plant introductions. An ANOVA substituting genotype
0.05 for lodging (Table 2.5). Yield was significantly different by ancestry, by seed traits oil
percentage, protein percentage, and seed weight were not (Table 2.5). Our results suggest
elite genotypes to be more resilient to lodging at a higher seeding rate (Figure 2.7).
3.2. Physiological drivers of soybean yield under contrasting seeding rates
Pearson correlations between traits confirmed high correlations of related vegetative
indices (Figure 2.2). Vegetative indices at R1-2 and R3-4 were more strongly correlated than
R3-4 and R5-6, and R1-2 and R5-6 did not display high correlation. Of the non-remote
sensing traits, iPAR and LAI were more strongly correlated with the vegetative indices
across all growth stages in contrast to SPAD or MTA. Yield appeared to be equally
correlated with physiological traits across growth stages (Figure 2.2).
Broad sense heritability, or repeatability, was generally found to increase over the
reproductive growth stages for most physiological traits, and the highest heritabilities were
found in chlorophyll-related traits, followed by foliage and water content traits (Table 2.6).
Regularized regression by the adaptive elastic net method was implemented for yield
prediction models for each seeding rate and repeated over reproductive growth stages and
combinations thereof. Overall, R2 values ranged from 0.44-0.55 for R1-2, 0.55-0.59 for
R3-4, and 0.52-0.64 for R5-6, increasing with later reproductive stages for all seeding rates. R2
values were greatest in the combination of all reproductive growth stages together, R1-6,
ranging from 0.77-0.82, followed by the combination of the latter two stages, R3-6, ranging
from 0.67-0.74. Yield prediction was similar between seeding rates at each growth stage, but
low seeding rate models were observed to be more predictive in most cases, apart from R3-4
(Figure 2.3). Physiological traits selected in the adaptive elastic net models were summarized
Table 2.7). Traits were reported if they were selected by a simple majority (greater than five)
of the ten-repeated five-fold cross-validations. Solution stability, the reoccurrence of terms
either selected or discarded by the model, was relatively high, with most traits entirely
excluded or retained (Figure 2.8). Models by seeding rate and growth stage were further
compared and summarized for feature overlap. Traits that were specific to one seeding rate
were found at each growth stage, excluding optimal R3-4 and high R5-6 (Figure 2.4A). The
likelihood that any given trait would be predictive across seeding rates increased at later
growth stages, as more traits were shared in predictive models (Figure 2.4A). In contrast,
when combining growth stages, the likelihood was equal for unique or shared for R3-6 and
greater for unique than shared for R1-6, the most predictive model. If any trait was shared in
the R1-6 model, it was most likely between all seeding rates, followed by high-optimal,
optimal-low, and lastly high-low (Figure 2.4B). SPAD collected during seed development
was the most predictive trait across seeding rates for the R5-6 and combined growth stages
(Table 2.7) SPAD was selected in R1-2 only for high seeding rate and for all seeding rates in
R3-4. In the R1-6 combined model, iPAR at flowering was the second most predictive trait
for low and optimal seeding rates, but less predictive for high. Of the highest ranked traits
selected for the three seeding rates in the R1-6 model, low seeding rate listed several
chlorophyll related remote sensing indices. The optimal seeding rate model was distinguished
with consecutive iPAR traits, and high included MTA at pod development (Table 2.7).
Overall, the highest ranked traits were shared among seeding rate models, and traits
4. Discussion 4.1. Genotype, Seeding rate, and Genotype x SR effects
In the following, we discuss the results from our mixed ANOVA analysis for the first
objective of this study. The large genotype effect and high trait heritabilities supported our
observation that the population subset from the SoyNAM parent panel was effectively
diverse. Efforts to include diverse genotypes outside the narrow genetic pool of elite cultivars
allows researchers to expand our understanding to a broader soybean base. The second
treatment of seeding rate followed genotype in magnitude of influence. It was purposefully selected to represent the extremes of low and high to overcome soybean’s known variable
response to seeding rate. Our overall observations of similar seeding rate response and no
significant genotype x seeding rate interaction for nearly all traits in this study supports the
claim that soybean, as of present, responds equally to seeding rate, regardless of ancestry.
Implications of seeding rate on yield and yield related traits is discussed below.
The response variable of highest importance in this study was seed yield. A yield
plateau was expected and observed at optimal seeding rate in this study because it is a
general observation in elite germplasm. Our results suggest an anticipated yield plateau at
optimal seeding rate can be further extended to germplasm of diverse and plant introduction
ancestry. Importantly, inclusion of diverse germplasm in breeding programs may not
negatively impact yield potential at higher seeding rates. A lack of genotype x seeding rate
interaction in our study conflicts with significant interactions previously reported (Gan et al.,
2002; Suhre et al., 2014). Ablett et al. (1991) and Beuerlein (1988) found that determinant
types had a greater yield response to increased seeding rates than indeterminate or
semi-determinate types, but no determinant types were included in our panel. Therefore, this may
(2014) found a genotype x seeding rate interaction at lower seeding rates between soybean
lines of indeterminate growth and contributed this to compensatory yield on plant branches.
Either branching ability and compensatory pod set were equal among our genotypes, or more
likely, other mechanisms of yield potential left uncharacterized compensated for yield under
low seeding rates. Moreover, a lack of significant genotype x seeding rate interaction for
yield suggests when germplasm enhancement programs use diverse collections to obtain
parental materials, they will witness a yield response to seeding rate no different from elite
materials.
Our data revealed seeding rate does not affect seed traits equally, in view that seed
weight was not influenced by seeding rate while seed oil and protein were impacted.
Environment has some bearing on seed size (Borrás et al., 2004), but it can also be relatively
stable, considering stable seed size QTL were identified across environments (Kato et al.,
2014) and nutrient treatments (Hacisalihoglu et al., 2017). In contrast to seed weight, seed
traits protein and oil concentration were significantly influenced by seeding rate and the only
traits affected by plant emergence. Bellaloui et al. (2014) and Cober et al. (2005) found that
protein concentration increased and oil concentration decreased with increasing seeding rate,
supporting our results that seed composition traits are highly responsive to plant spacing.
Because oil and protein response to seeding rate was similar for all genotypes in this study,
farmers and producers may better estimate protein potential in consideration of seeding rate,
since some regions have been shown to produce near insufficient protein percentage
(Rotundo et al., 2016). We suggest that future cultivars may need to be evaluated at lower
Lodging potential determines yield potential by affecting photosynthetic ability,
mechanical harvest losses, and disease pressure (Ustun et al., 2001) and positively correlates
with plant height. In the current study, plant height increased with seeding rate and plateaued
at optimal, but interestingly, lodging continued to increase past optimal seeding rate with no
increase in height. Traits, e.g. stem thickness, not measured in this study, may have
contributed to lodging, as thinner stems have been observed in high seeding rates (Lueschen
and Hicks, 1977). Our observation that elite lines maintain low lodging compared to soybean
lines of diverse or plant introduction ancestry supports previous observations that recent
cultivars withstand lodging at higher plant densities (Rincker et al., 2014). A caveat for
incorporation of diverse material into elite breeding programs includes increased lodging,
most noticeable at higher seeding rates.
Noting environmental or genetic factors influencing maturity is essential, because
extended maturity increases soybean yield potential. Soybean maturity is primarily
determined by photoperiod, and neither shade stress (Egli, 1997) nor seeding rate in three
genotypes (Gan et al., 2002) were found to have an effect on physiological maturity. These
former studies suggest a maturity response to seeding rate is unlikely, and that is what we
observed. However, Cober et al. (2005) found higher plant populations resulted in earlier
plant maturity, implying while not detected in this study, maturity differences due to seeding
rate may exist in other environments. Measuring maturity response to increased seeding rate
will need to be further evaluated in more environments, as a shortened growing season will
have implications for yield potential.
4.2. Physiological drivers of soybean yield under contrasting seeding rates
The second objective of this study was to identify physiological trait predictors of
yield. Infinite combinations of vegetative indices and their variations are used to forecast and
predict crop traits (Bendig et al., 2015; Candiago et al., 2015; Kross et al., 2015), but
vegetation indices in this study were selected to minimize the amount of pairwise correlation
over growth stages. This minimization was important, because in the presence of strong
correlation, traditional methods of feature selection, such as stepwise regression and
generalized regression technique lasso, are not ideal. Feature selection is aided by
independence between measured variables, because when a group of variables among which
pairwise correlations are high, often one variable from the group is selected at random (Zou
and Hastie, 2005). As our results indicated many traits were correlated, particularly among
the remoting-sensing indices, we opted to implement adaptive elastic net, an extension of
lasso, for our feature selection and yield prediction. This method encourages a grouping
effect, where strongly correlated predictors tend to be in or out of the model together (Zou
and Hastie, 2005). Therefore, our choice of method for feature selection facilitated
identification of important physiological traits predicting yield under any given seeding rate.
Soybean yield was predicted at individual growth stages and reached significant
levels, noticeably at later reproductive growth stages. However, assuming yield formation
cannot be determined from any single growth stage, combinations of growth stages would
provide greater yield prediction accuracy, as evidenced in our study. Wang et al. (2014)
similarly found improved yield prediction in wheat using multi-temporal remote sensing
data. We show yield prediction from a single growth stage is possible and suggest measuring
traits at later reproductive periods for increased prediction. At single growth stage
collections, traits were more likely to be equally predictive for yield across seeding rates,
Only combining growth stages and increasing the coefficient of determination made obvious
traits that predicted yield under one seeding rate and not another. A comprehensive
utilization of multiple growth stages is therefore emphasized for future studies.
The leading physiological traits predicting yield for the most predictive models were
summarized in this study. SPAD is an indirect measurement of leaf chlorophyll and we found
it to be the most predictive trait for all seeding rates at seed fill, R5-6. It is not surprising that
chlorophyll related traits were ranked the leading yield predictors, for the reason that
chlorophyll content has been demonstrated to linearly increase with cultivar year of release
(Koester et al., 2016). Several of the remote sensing indices in this study are also used for
prediction of chlorophyll content. However, these indices may still be sensitive to the
combined response of several vegetation and environmental properties, such as canopy
shadows and background soil reflectance (Haboudane et al., 2002). Furthermore, broad-sense
heritabilities of the chlorophyll indices were lower than SPAD. Crain et al. (2017) observed
an increase of trait heritability on a given day was a good indication of how well that dataset
correlated to yield, suggesting increasing trait heritability would increase prediction.
Progressing from SPAD to chlorophyll vegetation indices would be ideal for increased
throughput of data collection. As our SPAD values were averaged over ten individual
measurements and remote sensing from a single measurement, we theorize increasing our
replications of spectral measurements would increase heritabilities. We hypothesize
heritabilities increased at later reproductive growth stages for remote sensing traits because
of a greater canopy to background soil ratio.
After chlorophyll content, our selected feature light interception (iPAR) at flowering,
yield (Board and Harville, 1993). We suggest future studies could gravitate towards
remote-sensing for measurement collection, in that our leading traits can be substituted with remote
sensing indices. However, we caution using remote sensing alone on the grounds that Glenn
et al. (2008) argued vegetative indices should be used simply as a measurement of canopy
light absorption rather than as a surrogate for detailed features of canopy architecture.
Remote-sensing may be limited in predicting in high seeding rates as mean tilt angle was the
second ranked predictor, unless future improvements in estimating MTA from remote
sensing are achieved. Overall, our most predictive seeding rate models shared common
leading traits, indicating improvement of these physiological traits will lead to increased
performance across seeding rates.
5. Conclusions
In this study, genotype and seeding rate interactions for yield, seed components, and
agronomic traits were evaluated, and adaptive elastic net models identified the underlying
physiological traits predicting yield response to three levels of seeding rate. A significant
genotype x seeding rate interaction was only detected for lodging, and not for yield, seed
weight, seed oil percentage, seed protein percentage, height, or maturity. These results
suggest that current soybean germplasm and soybean of wide genetic ancestry respond
similarly to seeding rate and implies introgression of diverse material may not detrimentally
affect yield response to seeding rate. In addition, physiological traits predicting the yield
response within and across seeding rates were summarized, with chlorophyll traits
determined as the leading predictors across seeding rates in this study. Our further
characterization of diverging traits between the seeding rate yield models will provide the
research community targets for soybean improvement for current and future seeding rate
germplasm to understand the mechanisms underlying yield response to seeding rate is an
important direction for future research and soybean improvement.
Acknowledgments
We sincerely appreciate the members of Singh Soybean Group at Iowa State
University (ISU), particularly Kyle Parmley, for assistance with phenotyping; and Dr. Jim
Rouse and staff of the Iowa Crop Improvement Association for initially assisting with project
implementation with field planting. We thank Dr. Somak Dutta for his feedback on statistical
analyses. We are thankful to ISU, Iowa Soybean Association, Monsanto Chair in Soybean
Breeding at ISU, and the R. F. Baker Center for Plant Breeding at ISU for financial support.
Race Higgins was supported by the Monsanto Chair in Soybean Breeding, Iowa Soybean
association and R. F. Baker Center for Plant Breeding. The funders had no role in study
design, data collection and analysis, decision to publish, or preparation of the manuscript.
References
Ablett, G.R., Beversdorf, W.D., Dirks, V.A., 1991. Row width and seeding rate performance of indeterminate, semideterminate, and determinate soybean. J. Prod. Agric. 4, 391– NP.
Agudamu, Yoshihira, T., Shiraiwa, T., 2016. Branch development responses to planting density and yield stability in soybean cultivars. Plant Prod. Sci. 19, 331–339. https://doi.org/10.1080/1343943X.2016.1157443
Araus, J.L., Cairns, J.E., 2014. Field high-throughput phenotyping: the new crop breeding frontier. Trends Plant Sci. 19, 52–61. https://doi.org/10.1016/j.tplants.2013.09.008
Bell, S.M., Burgoon, L.D., Last, R.L., 2012. MIPHENO: data normalization for high throughput metabolite analysis. BMC Bioinformatics 13, 10.
Bellaloui, N., Mengistu, A., Walker, E.R., Young, L.D., 2014. Soybean seed composition as affected by seeding rates and row spacing. Crop Sci. 54, 1782–1795.
Bendig, J., Yu, K., Aasen, H., Bolten, A., Bennertz, S., Broscheit, J., Gnyp, M.L., Bareth, G., 2015. Combining UAV-based plant height from crop surface models, visible, and
near infrared vegetation indices for biomass monitoring in barley. Int. J. Appl. Earth Obs. Geoinformation 39, 79–87. https://doi.org/10.1016/j.jag.2015.02.012
Beuerlein, J.E., 1988. Yield of indeterminate and determinate semidwarf soybean for several planting dates, row spacings, and seeding rates. J. Prod. Agric. 1, 300–303.
Blackburn, G.A., 1998. Spectral indices for estimating photosynthetic pigment
concentrations: a test using senescent tree leaves. Int. J. Remote Sens. 19, 657–675.
Board, J., 2000. Light interception efficiency and light quality affect yield compensation of soybean at low plant populations. Crop Sci. 40, 1285–1294.
Board, J.E., Harville, B.G., 1996. Growth dynamics during the vegetative period affects yield of narrow-row, late-planted soybean. Agron. J. 88, 567–572.
Board, J.E., Harville, B.G., 1993. Soybean yield component responses to a light interception gradient during the reproductive period. Crop Sci. 33, 772–777.
Boegh, E., Soegaard, H., Broge, N., Hasager, C.B., Jensen, N.O., Schelde, K., Thomsen, A., 2002. Airborne multispectral data for quantifying leaf area index, nitrogen
concentration, and photosynthetic efficiency in agriculture. Remote Sens. Environ. 81, 179–193.
Bolton, D.K., Friedl, M.A., 2013. Forecasting crop yield using remotely sensed vegetation indices and crop phenology metrics. Agric. For. Meteorol. 173, 74–84.
Borrás, L., Slafer, G.A., Otegui, M.E., 2004. Seed dry weight response to source–sink manipulations in wheat, maize and soybean: a quantitative reappraisal. Field Crops Res. 86, 131–146. https://doi.org/10.1016/j.fcr.2003.08.002
Candiago, S., Remondino, F., De Giglio, M., Dubbini, M., Gattelli, M., 2015. Evaluating multispectral images and vegetation indices for precision farming applications from UAV images. Remote Sens. 7, 4026–4047.
Carpenter, A.C., Board, J.E., 1997. Branch yield components controlling soybean yield stability across plant populations. Crop Sci. 37, 885–891.
Carter, G.A., 1994. Ratios of leaf reflectances in narrow wavebands as indicators of plant stress. Remote Sens. 15, 697–703.
Chang, W.-S., Lee, H.-I., Hungria, M., 2015. Soybean Production in the Americas, in: Principles of Plant-Microbe Interactions. Springer, Cham, pp. 393–400. https://doi.org/10.1007/978-3-319-08575-3_41
Chappelle, E.W., Kim, M.S., McMurtrey, J.E., 1992. Ratio analysis of reflectance spectra (RARS): an algorithm for the remote estimation of the concentrations of chlorophyll
a, chlorophyll b, and carotenoids in soybean leaves. Remote Sens. Environ. 39, 239– 247.
Cober, E.R., Morrison, M.J., Ma, B., Butler, G., 2005. Genetic Improvement Rates of Short-Season Soybean Increase with Plant Population. Crop Sci. 45, 1029.
https://doi.org/10.2135/cropsci2004.0232
Crain, J., Reynolds, M., Poland, J., 2017. Utilizing High-Throughput Phenotypic Data for Improved Phenotypic Selection of Stress-Adaptive Traits in Wheat. Crop Sci. 57, 648–659. https://doi.org/10.2135/cropsci2016.02.0135
De Bruin, J.L., Pedersen, P., 2009. New and Old Soybean Cultivar Responses to Plant Density and Intercepted Light. Crop Sci. 49, 2225.
https://doi.org/10.2135/cropsci2009.02.0063
Duvick, D.N., 1984. Genetic diversity in major farm crops on the farm and in reserve. Econ. Bot. 38, 161–178.
Edwards, J.T., Purcell, L.C., Karcher, D.E., 2005. Soybean Yield and Biomass Responses to Increasing Plant Population among Diverse Maturity Groups. Crop Sci. 45, 1778. https://doi.org/10.2135/cropsci2004.0570
Egli, D.B., 1997. Cultivar maturity and response of soybean to shade stress during seed filling. Field Crops Res. 52, 1–8.
Egli, D.B., 1993. RELATIONSHIP OF UNIFORMITY OF SOYBEAN SEEDLING EMERGENCE TO YIELD. J. Seed Technol. 17, 22–28.
Elmore, R.W., 1998. Soybean cultivar responses to row spacing and seeding rates in rainfed and irrigated environments. J. Prod. Agric. 11, 326–331.
Fawcett, J., Sievers, J., DeJong, J., Rossiter, L., 2017. On-Farm Corn and Soybean Planter Trials. Farm Prog. Rep. 2016, 112.
Fehr, W.R., Caviness, C.E., Burmood, D.T., Pennington, J.S., 1971. Stage of development descriptions for soybeans, Glycine max (L.) Merrill. Crop Sci. 11, 929–931.
Ferreira, A.S., Junior, B., Antonio, A., Werner, F., Zucareli, C., Franchini, J.C., Debiasi, H., Ferreira, A.S., Junior, B., Antonio, A., Werner, F., Zucareli, C., Franchini, J.C., Debiasi, H., 2016. Plant density and mineral nitrogen fertilization influencing yield, yield components and concentration of oil and protein in soybean grains. Bragantia 75, 362–370. https://doi.org/10.1590/1678-4499.479
Frederick, J.R., Camp, C.R., Bauer, P.J., 2001. Drought-stress effects on branch and mainstem seed yield and yield components of determinate soybean. Crop Sci. 41, 759–763.
Gan, Y., Stulen, I., van Keulen, H., Kuiper, P.J.C., 2002. Physiological response of soybean genotypes to plant density. Field Crops Res. 74, 231–241.
https://doi.org/10.1016/S0378-4290(01)00212-X
Gitelson, A.A., Kaufman, Y.J., Merzlyak, M.N., 1996. Use of a green channel in remote sensing of global vegetation from EOS-MODIS. Remote Sens. Environ. 58, 289–298.
Glenn, E.P., Huete, A.R., Nagler, P.L., Nelson, S.G., 2008. Relationship Between Remotely-sensed Vegetation Indices, Canopy Attributes and Plant Physiological Processes: What Vegetation Indices Can and Cannot Tell Us About the Landscape. Sensors 8, 2136–2160.
Grassini, P., Torrion, J.A., Yang, H.S., Rees, J., Andersen, D., Cassman, K.G., Specht, J.E., 2015. Soybean yield gaps and water productivity in the western US Corn Belt. Field Crops Res. 179, 150–163.
Green-Tracewicz, E., Page, E.R., Swanton, C.J., 2011. Shade Avoidance in Soybean Reduces Branching and Increases Plant-to-Plant Variability in Biomass and Yield Per Plant. Weed Sci. 59, 43–49. https://doi.org/10.1614/WS-D-10-00081.1
Haboudane, D., Miller, J.R., Tremblay, N., Zarco-Tejada, P.J., Dextraze, L., 2002. Integrated narrow-band vegetation indices for prediction of crop chlorophyll content for
application to precision agriculture. Remote Sens. Environ. 81, 416–426. https://doi.org/10.1016/S0034-4257(02)00018-4
Hacisalihoglu, G., Burton, A.L., Gustin, J.L., Eker, S., Asikli, S., Heybet, E.H., Ozturk, L., Cakmak, I., Yazici, A., Burkey, K.O., 2017. Quantitative trait loci associated with soybean seed weight and composition under different phosphorus levels. J. Integr. Plant Biol.
Hardisky, M.A., Klemas, V., Smart, M., 1983. The influence of soil salinity, growth form, and leaf moisture on the spectral radiance of. Spartina Alterniflora 77–83.
Huang, Y., Yuan, L., Reddy, K.N., Zhang, J., 2016. In-situ plant hyperspectral sensing for early detection of soybean injury from dicamba. Biosyst. Eng. 149, 51–59.
https://doi.org/10.1016/j.biosystemseng.2016.06.013
Johnson, D.M., 2014. An assessment of pre-and within-season remotely sensed variables for forecasting corn and soybean yields in the United States. Remote Sens. Environ. 141, 116–128.
Kato, S., Sayama, T., Fujii, K., Yumoto, S., Kono, Y., Hwang, T.-Y., Kikuchi, A., Takada, Y., Tanaka, Y., Shiraiwa, T., 2014. A major and stable QTL associated with seed weight in soybean across multiple environments and genetic backgrounds. Theor. Appl. Genet. 127, 1365–1374.