Munich Personal RePEc Archive
Bayesian Value-at-Risk Backtesting: The
Case of Annuity Pricing
Leung, Melvern and Li, Youwei and Pantelous, Athanasios
and Vigne, Samuel
Monash Business School, Monash University, Australia, Hull
University Business School, University of Hull, U.K., Monash
Business School, Monash University, Australia, Trinity Business
School, They University of Dublin, Ireland
November 2019
Online at
https://mpra.ub.uni-muenchen.de/101698/
Bayesian Value-at-Risk Backtesting: The Case of Annuity Pricing
Melvern Leunga, Youwei Lib, Athanasios A. Pantelousa,∗, Samuel A. Vignec a
Department of Econometrics and Business Statistics, Monash Business School, Monash University, Australia
b
Hull University Business School, University of Hull, U.K.
c
Trinity Business School, They University of Dublin, Ireland
Abstract
We propose a new Unconditional Coverage test for VaR-forecasts under a Bayesian framework that significantly minimise the direct and indirect effects of p-hacking or other biased outcomes in decision-making, in general. Especially, after the global financial crisis of 2007-09, regulatory demands from Basel III and Solvency II have required a more strict assessment setting for the internal financial risk models. Here, we employ linear and nonlinear Bayesianised variants of two renowned mortality models to put the proposed backtesting technique into the context of annuity pricing. In this regard, we explore whether the stressed longevity scenarios are enough to capture the experiences liability over the foretasted time horizon. Most importantly, we conclude that our Bayesian decision theoretic framework quantitatively produce a strength of evidence favouring one decision over the other.
Keywords: Bayesian decision theory; Value-at-Risk; Backtesting; Annuity pricing; Longevity risk
1. Introduction and Motivation
Over the past few decades, the popularity of Value-at-Risk (VaR) has increased significantly among practitioners for measuring and managing risk in the insurance and financial services in-dustries. However, a risk measure is only as good as it is able to accurately predict future risks accordingly, and thus, to measure its accuracy we need to develop effective backtest procedures. These processes should allow the possibility to validate a risk measure given its out-of-sample fore-casts and actual realized results (Christoffersen and Pelletier, 2004), such as those found using VaR.1 By definition, the VaR is the q-quantile of a Profit/Loss distribution, and a backtesting
∗Corresponding author
Email addresses: [email protected](Melvern Leung),[email protected](Youwei Li),
[email protected](Athanasios A. Pantelous ), [email protected](Samuel A. Vigne)
1While VaR is a widely used risk measure in finance, and in several decision-making processes in general, however other risk measures such as Stressed-trends and Expected Shortfall can also be backtested. The results presented in this study can be extended in several other directions, however we will address them in our future research.
mechanism is to determine whether the required coverage q is indeed achieved. In practice, the idea of backtesting as explained by Kupiec (1995) is a type of “reality check” to identify whether risk measurement models are able to accurately determine the risk exposures experienced.
After the global financial crisis of 2007-09, regulatory demands from Basel III and Solvency II have required a very strict assessment for internal financial risk models, respectively for banks and insurance companies (Drenovak et al., 2017). Kupiec (1995) was the pioneer of backtesting, whereby sequences of ones and zeros are determined by whether the risk-measure forecasts is able to capture the actual realized returns. A likelihood ratio test is then constructed to test if the proportion of ones and zeros correctly represents the required coverage. Although there has been a large emphasis on VaR forecasting in literature (e.g., Berkowitz and O’Brien, 2002, Glasserman et al., 2002, Christoffersen, 2009, Nieto and Ruiz, 2016), the backtesting literature has since gained traction after the development of the Unconditional Coverage (UC) backtest by Kupiec (1995), these include the works from Christoffersen (1998), Ziggel et al. (2014) and Wied et al. (2016).
With the recent developments of Bayesian statistical techniques, there is an increasing motion towards the use of a Bayesian decision framework in hypothesis testing. In particular, Harvey (2017) mentions the importance and how to implement a Bayesian test in concurrence of the standard Null Hypothesis Significance Testing (NHST), as means of comparisons between hypotheses. The issue as stated and convincingly discussed in the American Finance Association president’s address Harvey (2017) is that hypothesis testing, which is a significant tool used extensively in the finance literature, and its testing procedures are based on the critical assumption that the null hypothesis is true, and the alternative hypothesis is indirectly inferred. However, the idea of p-value has caused some scepticism among researchers, since non-rejected null hypotheses can simply be removed after the testing procedure in order to obtain a significant result in for example regression analysis. This formed the basis of the idea ofp-hacking and biased outcomes as noted by Harvey (2017).
The Bayesian testing began when Berger and Sellke (1987) developed the idea ofBayes Factor (BF) to determine a ratio of evidence, and recently, this idea has been applied extensively in different scientific fields. Overall, the Bayesian test has many advantages in the realm of testing, it allows a measure of evidence towards one hypothesis in comparison to another using direct inference, and there is no arbitrary cut-off point. Most importantly, using Bayes rule, we are able to obtain the probability of a hypothesis being correct given the dataset. The idea behind a Bayesian backtesting framework is to alleviate the use of frequentistp-values, and instead focus on the BF (or Posterior odds) which expresses conclusions based on a ratio rather than those expressed
indirectly via a confidence interval andp-value. We can conduct inference using sampling properties of our posterior distribution rather than on large sample asymptotic approximations to the null distribution.
Our paper contributes to the literature in three distinctive ways. Firstly, we propose a new Bayesian framework for the UC VaR backtest. This framework allows for the inclusion of prior knowledge to be used in the decision making step which deviates from standard testing procedures under the frequentist framework. We first state the assumptions used by the UC test, then develop the Bayesian decision theoretic framework surrounding these assumptions. Further, the flexibility of the Bayesian framework can also be tailored to one-tail testing, as opposed to the two-tail tests presented in Kupiec (1995), this permits the capability to separately test whether the VaR-model underestimated or overestimated a required VaR-exceedance criteria. Most importantly, our Bayesian VaR backtesting framework developed in this study is highly flexible, and easy to implement due to the Bayesian conjugacy property which allows a closed-form expression of the posterior. What is more, in the case where Bayesian conjugacy does not exist, we employ recent econometric advancements in Bayesian estimation which also allows for numerical approximations such asMonte-Carlo Markov Chain (MCMC) methods. Furthermore, as a robustness test, varying prior distributions were used to ensure the decision is coherent among varying hyper-parameters.
Secondly, since 2016, Solvency II was established with the aim of ensuring insurance companies meet their obligations to policyholders (e.g., Eckert and Gatzert, 2018).2 The idea behind this notion is that the company is required to meet its obligation payments with a probability of 99.5% over 12 months (Hari et al., 2008). However, Pillar 1 allows room for internal models in terms of assessing the financial stability of the insurance company, they have the choice to either use the capital requirements laid by the supervisory regulators or keep capital reserves based on their own risk-based models. The supervisory regulator uses a mortality shock based model which has been criticized, see for instance, Plat (2011), for its over-estimation of longevity trend risk. Moreover, they apply risk measures such as VaR and also longevity-trend stress test scenarios in order to evaluate the solvency capital requirement. In the present paper, we employ the linear and nonlinear variants of the Lee and Carter (1992) (LC) and the Cairns et al. (2006) (CBD) model which are two renowned mortality models in the corresponding literature. Then, we develop Bayesian estimation methods for the mortality models utilizing the Extended Kalman Filter (EKF) and the MCMC
2This regulation contains three pillars, and our focus in this paper is on pillar 1, where it contains the risk based solvency capital requirements.
techniques.
Finally, we develop the idea of backtesting in annuity liabilities which has two main advan-tages (Leung et al., 2018). Firstly, the backtesting framework allows us to measure the ability for mortality models to capture longevity risk associated with annuity itself. Secondly, it allows the ability to determine models most suitable for longevity risk applications.3 Our focus is on the long term longevity trend risk, and in this case a longevity stress test scenarios would be most suitable. This mainly stems from the fact that longevity trend risk exacerbates over a longer period, and as such a one-year VaR would most likely be unsuitable. Thus, under a longevity stress trend scenario, it is crucial that a suitable backtesting method is developed to determine if the under-lying longevity risks associated with a pricing instrument are actually captured by the mortality model used. In essence, the backtesting procedure is determined by the outcome of whether the specified mortality model will be able to produce a forecast such that with probability of 99.5% obligated payments from an annuity can be met. Although our focus is on the immediate annuity with contingent payments based on the policyholders lifespan, we should emphasise here that the backtesting framework we develop can also be extended to measure accuracy of any type of risk measures.
The paper is organised as follows. Section 2 and Appendix A focus on developing the VaR Bayesian backtesting framework for the novel Unconditional Coverage test. Section 3 explains the estimation procedure of the Bayesian mortality models under a state-space representation setting. A particular interest is paid to the nonlinear dynamics when modelling (central) death rates rather than the crude mortality estimates. Section 4 and Appendices B and C (see also, the extensive SI provided) contain the empirical results of fitted LC and CBD model, as well the Bayesian forecast-ing method algorithms used in the paper. Section 5 applies the Bayesian backtestforecast-ing framework developed to a 99.5% longevity stressed scenarios under an immediate annuity calculation. We determine clearly which model produces the most favourable results under a longevity stressed scenario implementing the Solvency II regulation. Finally, Section 6 concludes the paper.
2. A Bayesian Backtesting Tool
Financial risk model evaluation plays a major part in risk management, and typically this evaluation process is called backtesting procedure4 which tries to measure the accuracy of the risk
3More discussion about life annuities can be found in Supplementary Information (SI) Section 1.
models promised coverage. For instance, a VaR model tries to define a conditional quantile (or coverage) of the return distribution. To evaluate the effectiveness of the VaR model, we can backtest it and determine whether the required coverage rate is met. This is usually accomplished by using ex-post returns on ex-ante VaR forecasts. In this Section, we propose a new UC backtest for VaR-forecasts under a Bayesian framework which is a cornerstone in this paper.
2.1. The Bayesian Framework
Before we proceed with the new UC backtest, let us consider two hypotheses,H0andH1, we wish to test. Under the standard NHST framework, inference is normally conducted onP(y|Hi), i= 0,1,
however applying Bayes rule, we obtain the following relation,
π(Hi|y) =
π(y|Hi)π(Hi)
π(y) ,
where π(y) is the marginalizing constant to ensure P(Hi|y) is a proper probability distribution,
and finally the point of interest, the posterior odds ratio, is given by,
π(H0|y) π(H1|y) = π(y|H0)π(H0) π(y|H1)π(H1) = BF01 π(H0) π(H1) , (2.1)
where BF01 = ππ((yy||HH10)) is commonly referred to as the BF, and ππ((HH01)) is known as the prior odds. BF01 measures the change in evidence when going from the prior to posterior odds. In the decision making process where both hypotheses are given equal weighting, the testing framework focuses solely on BF01, thus a higher positive value for BF01impliesπ(H0|y)> π(H1|y), and concludes an increased support for H0.
Consider now a point null hypothesis{H0 =θ0}and a composite alternative hypothesis{H16=
θ0}. The Bayesian framework then assigns a prior distribution over both hypotheses. Let y := {y1, ..., yn} be a vector of n observations, the likelihood function of the observed data is given by
l(y|θ), whereθis the parameter of interest. Then, for a given prior,π(θ), our posterior distribution is given by,
π(θ|y) = l(y|θ)π(θ)
π(y) . (2.2)
The prior specifications will be as follows: “under H0, we assign the (point mass) prior π(θ) =θ0, whereas for H1, we assign a prior distribution over the parameter space required”. The decision to accept H0 is denoted by “a0” and the decision againstH0 is denoted by “a1”. Overall, for a given loss function,L[ai;θ], i= 0,1,H0 is rejected when the expected posterior loss forH0 is sufficiently
larger than the expected posterior loss under H1. The expected posterior loss for theith decision is given by, Eπ(θ|y)[L(θ, ai)] = Z θ L[ai; θ]π(θ|y)dθ, fori= 1,2 (2.3)
and we will reject H0 when,
Z
θ
(L[a0; θ]− L[a1; θ])π(θ|y)dθ >0. (2.4)
If we choose to employ a zero-one loss function5,
L[a0; θ] = 0 ifθ=θ0, 1 ifθ6=θ0, (2.5)
withL[a1; θ] = 1− L[a0; θ]. Given equal probability of theH0 and H1 occurring, that isπ(H0) =
π(H1) = 0.5, we will have the following decisions to make. For the first decision, whenθ=θ0, we will accept H0 with decision a0, and the second decision, a1, occurs when θ6=θ0. To tabulate the decision outcome more formally:
Choose: a0, if θ=θ0, a1, ifθ6=θ0.
Combining Eqs. (2.3), (2.4) and (2.5), rejection of theH0 will occur when,
R θL[a0; θ]π(θ|y)dθ R θL[a1; θ]π(θ|y)dθ = R l(y|θ=θ0) θl(y|θ)π(θ)dθ <1, (2.6)
where the quantity R l(y|θ=θ0)
θl(y|θ)π(θ)dθ
is the BF01.6 Further, note that the marginalizing constant π(y) from Eq. (2.2) disappears in Eq. (2.6), since it appears in both the numerator and denominator. TheBayesianversion of theLikelihood Ratio Test (BLRT) was pioneered by Li et al. (2014), where instead of having a 0−1 loss function which corresponds to BF01, they used a continuous loss
5A zero-one loss function is a commonly chosen loss function used in Bayesian hypothesis testing, this is simply due to its binary outcome, and is equivalent to either rejecting(a1) or accepting(a0) the null hypothesis.
6The range of values that BF
01can take represents different levels of evidence which supports the null or alternative hypothesis, in Table 1 of Goodman (2001) the strength of evidence against the null hypothesis for a given BF is shown.
difference function, defined by
∆L[H0;θ] =−2 [log(π(y|θ0))−log(π(y|θ))],
under a continuous loss difference function, rejection ofH0 occurs when
Z
θ
∆L[H0;θ]π(θ|y)dθ >0,
and the Bayesian test statistic is given by,
TBLRT(y, θ) = −2 Z θ [log(π(y|θ0))−log(π(y|θ))]π(θ|y)dθ + 1. (2.7)
The main difference between the BLRT and BF01 is that the BLRT focuses on averaging over the (log)posterior distribution, whereas BF01 averages over the prior distribution. Li et al. (2014) also found that TBLRT(y, θ) has an asymptotic χ2(1)-distribution, and a convenient property of the BLRT statistic is that if the integral in Eq. (2.7) has no analytical form, it can be approximated via an MCMC, TBLRT(y, θ) =−2 M X i=1 log(π(y|θ0))−log(π(y|θi)) /M + 1, (2.8)
where irepresents the ith MCMC draw, and M corresponds to the number of MCMC iterations.
In this case, we can produce Bayesianised p-values via
p=P(χ2(1)≤TBLRT).
2.2. A New Unconditional Coverage Backtest
The statistical backtest for VaR developed by Kupiec (1995) tests whether a risk model truly generated the correct coverage using the LRT. In this section, we formulate a novel approach of the UC backtest using the Bayesian decision theoretic framework developed in the previous section.
Let y denote the daily observed asset or portfolio return time series yt fort ∈(1, . . . , T), and
the VaR as P(yt ≥V aRt|Ft−1(p)) = p. To produce interval forecasts for each observation, we let
with coveragep. Let us define an indicator variable where, Ip(t) = 1, ifyt∈(−∞, Ut|Ft−1(p)) 0, otherwise, (2.9)
whereFt−1 corresponds to the information setFt−1:={Ip(1), . . . ,Ip(t−1)}.
In laymen terms, if the observed daily return,yt, is not greater than the expected lower bound,
yt > Ut|Ft−1(p), then we conclude that the VaR forecasts are violated at time t and we assign a
value of 1. Kupiec (1995) examines whether the average non-violations shown in Eq. (2.9) occurs at the required coveragep, mathematically,
E " (1/T) T X t=1 Ip(t) # =P(Ip(t) = 1) =p, ∀t. (2.10)
This also implies that eachIp(t)∼Be(p), whereBe(p) represents the Bernoulli distribution with
probability p success. Let Ip :={Ip(t) :t∈(1, ..., T)}, and let m1 and m0 denote the number of one and zero occurrences in Ip respectively. Then Ip will be a vector of size T =m1+m0. Our aim is to determine whether or notE[Ip(t)] =p∗, for some predetermined probabilityp∗ and since,
Ip(t)∼Be(p) ∀t, the joint likelihood function will be given by,
l(I|p) =pm1(1−p)m0. (2.11)
The Bayesian framework starts by assigning priors onp. Under theH0 :=p=p∗ with an assigned point mass prior. Under the alternative H1 :=p6=p∗, sincep has a support between (0,1), we use a Beta prior distribution which mimics the support between 0 and 1. Formally, let
π(p) = 1 ifp=p∗, Beta(a, b), ifp6=p∗.
The priors chosen here are non-informative and conjugate to the posterior, hence the posterior loss distribution will be mainly data driven and have a closed form expression.
Lemma 2.1. The BF for the UC backtest is given by, BF01=
(p∗)m1(1−p∗)m0
β(a+m1, b+m0)
For a proof of Lemma 2.1 see Appendix A.1. Then using the derived BF01 from Eq. (2.1), the decision to reject theH0 will occur when,
BF01=
(p∗)m1(1−p∗)m0
β(a+m1, b+m0)
<1, (2.12)
whereβ corresponds to theβ-function. For the BLRT statistic, we can use Eq. (2.7) instead of the simulation method presented in Eq. (2.8). The following Theorem provides an analytical form for the BLRT statistic for the UC backtest, which is extremely useful in what follows.
Theorem 2.1. The analytical form for the BLRT statistic for the UC backtest is given by,
TBLRT(y, p) =−2[Aπ0−Bπ1] + 1, (2.13) where, Aπ0 =m1log(p ∗) +m 0log(1−p∗), Bπ1 =m1(ψ(a+m1)−ψ(a+m1+b+m0))−m0(ψ(b+m0)−ψ(a+m1+b+m0)),
and ψ corresponds to the digamma function.
For a proof of Theorem 2.1 see Appendix A.2. Let CBLRT be determined using a required tail significance from aχ2(1)-distribution, then the decision to rejectH0will occur whenTBLRT(y, p)>
CBLRT. A more formal representation for the test outcomes is shown in Table 1.
Table 1: Criteria for the rejection or acceptance of theH0
Reject H0 Do not reject H0
BF01 (p ∗)m1(1−p∗)m0 β(a+m1,b+m0) <1 (p∗)m1(1−p∗)m0 β(a+m1,b+m0) >1 TBLRT TBLRT > CBLRT TBLRT < CBLRT
3. Bayesian Model Estimation and Forecasting
Government interventions such as the introduction of Solvency II regulation has required insur-ance companies to strictly manage their reserves to reduce the risk of insolvency. Thus it becomes a crucial aspect for insurance services companies to not over or under compensate the required reserves which is contingent on the underlying mortality assumptions. This is particularly impor-tant to pension providers where management of pension payments are crucially dependent many risk factors including longevity risk (e.g., Konicz and Mulvey, 2015). In this Section, we develop
the Bayesian modelling estimation7 and forecasting procedures for applying the new backtesting technique developed in the previous section for the annuity liability experience in the insurance industry.
3.1. Preliminaries
One of the more renowned models in mortality modelling is the Lee and Carter (1992) model, which is commonly used as tool for mortality estimation and forecasting due to its simplistic model nature (Deb´on et al., 2008). Another widely accepted mortality model is the Cairns et al. (2009) model which offers accuracy of mortality rates for higher ages and non-age specific parameters. A possible downfall of the estimation procedure is that it requires two steps approach: firstly, a point estimation stage is produced, secondly a fitting stage is then conducted on the latent dynamics.
In this paper, we focus on a Bayesian estimation of both a linear variant of the LC and CBD mod-els, and a nonlinear variant based on Poisson and Binomial distributed death counts, respectively. A Kalman Filter alongside a Metropolis-Within-Gibbs sampler embedded in a MCMC algorithm will be used and this benefits two folds. Firstly, the Kalman Filter is a one-step procedure and is able to retain the state dynamics without the need for an extra fitting procedure, and secondly, we are able to retain the MCMC draws for posterior inference and parameter risk analysis.
Let µx(t) denote the force of mortality for an individual agedx at timet. Under the piecewise
constant force of mortality assumption we have,
µx+s(t+s) =mx,t for 0≤s <1 andx∈N,
with qx,t = 1−e−mx,t, where qx,t represents the 1-year death probability for an individual aged x
at timet. Denote the crude central death rate and crude death rate as,
˜
mx,t=
dx,t
Ex,t
, q˜x,t = 1−e−m˜x,t, (3.1)
wheredx,t is the number of deaths recorded at age xduring yeart, andEx,t is the total population
at agex during yeart. TheN-year survival rate of a person agedx at timetcan be calculated as
Sx(t, N) = N Y n=1 (1−qx+n,t+n) = exp − N X n=1 mx+n,t+n ! . (3.2)
7Arguments and some necessary details about the Bayesian state-space model estimation procedure can be found in SI Section 1.1.
Further, we work in a discrete-time modelling environment. Let us assume x ∈ {x1, . . . , xn} and
t∈ {t1, . . . , tT}, where x1 represents the initial age of the dataset, xn represents the ultimate age
of our dataset, t1 represents the initial year, tT corresponds to the final year used, for simplicity
we will represent t1= 1, ..., tT =T, where T is the time horizon.
In the next section we will introduce the idea of MCMC and Bayesian model estimation, for more information regarding a general Bayesian modelling framework see SI Section 1.1.
3.2. The Lee-Carter model
Letyx,t := ln(mx,t)8, then the LC model assumes that the central mortality rate is governed by
the following process,
yt =α+βκt+εt, (3.3)
where yt := {yx,t :x ∈(x1, ..., xn)}; α′ := {αx :x ∈(x1, ..., xn)} and β′ := {βx :x∈ (x1, ..., xn)}
are age dependent variables, κt captures the time dynamics of the population common through
all ages, and εt ∼ N(0,Inσ2ε). Here, In represents the n×n identity matrix and a random walk
with drift process will be used to model the latent state dynamics to facilitate the state-space formulation,
κt=κt−1+δ+ωt, (3.4)
where ωt ∼ N(0, σω2) and δ represents the drift term of the process, furthermore ωt and εt are
assumed to be independent. It is shown in Lee and Carter (1992) that the parametrization in Eq. (3.3) is not unique, which means that for a particular likelihood maximization there is an indefinite number of solutions to the maximum likelihood estimate. To rectify this situation Lee and Carter (1992) imposed the constraints, Pxn
x=x1βx = 1, and PT
t=1κt = 0. In our case we will
also follow these constraints. For more information regarding the LC model, we refer to SI Section 1.2.
3.2.1. Linear variant
The LC model in linear state-space form is given by
yt =α+βκt+εt, εt ∼N(0,Inσ2ε) (3.5)
κt=κt−1+δ+ωt, ωt∼N(0, σ2ω), (3.6)
8As the central mortality rate cannot be observed, we can instead model the crude central mortality rate given by Eq. (3.1).
with the static model parameter vector ΘLC={α,β, δ, σ2ω, σε2}. Recall that in the Bayesian setting,
our aim is to draw samples from the joint posterior densityπ(κ1:T,ΘLC|y1:T),using Gibbs sampling,
our MCMC procedure consists of 1. Initialise ΘLC= Θ(0)LC. 2. Fori= 1, . . . , M,
(a) sample κ(1:i)T from π(κ1:T|Θ(LCi−1),y1:T),
(b) sample Θ(LCi) fromπ(ΘLC|κ(1:i)T,y1:T).
A sample of the conditional distributionπ(κ1:tT|ΘLC,y1:tT) can be obtained via forward-backward
sampling using Kalman filtering (Carter and Kohn, 1994). To draw samples fromπ(ΘLC|κ1:(i)tT,y1:tT),
we assume the following conjugate prior distributions:
π(δ)∼N(µθ, σθ2),
π(σ2ε)∼I.G(aε, bε)9, π(σω2)∼I.G(aω, bω)
π(αx)∼N(µα, σα2), π(βx)∼N(µβ, σβ2) for x∈ {(x1, ..., xn).
The prior distributions were chosen such that when multiplied by the likelihood function, the resulting posterior distribution will be of the same family; this is known as the conjugacy property and it facilitates the Gibbs sampling procedure. In the case where no conjugacy is involved, the Metropolis-Hastings (MH) algorithm can be applied. The full conditional posterior distribution for ΘLC are as follows10: π(αx|y,κ,β, σ2ε)∼N µασε2+σ2α T P t=1 (ytx−βxκt)(σ2αT+σε2)−1,(σα2T+σε2)(σ2ασε2)−1 π(βx|y,κ,α, σ2ε)∼N (µβσε2+σβ2 T P t=1 (yx t −αx)κt)(σ2β T P t=1 (κ2t+σε2))−1,(σβ2σε2)(σβ2 T P t=1 (κ2t +σε2))−1 π(σ2 ε|y,κ,β,α)∼I.G(aε+T n2 , bε+12 T P t=1 n P x=1 (yx t −(αx+βxκt))2) π(δ|y,κ, σ2ω)∼N (µδσω2 +σδ2 T P t=1 (κt−κt−1))(σδ2σω2)−1, (σδ2σω2)(T σδ2+σω2)−1 π(σ2ω|y,κ, δ)∼I.G(aω+T2, bω+ (κt−(κt−1+δ))2)
9TheI.G.represents the Inverse Gamma distribution.
3.2.2. Nonlinear variant
For the Poisson model estimation under a Bayesian state-space framework, we use a Gibbs sampler, the EKF and a MH, embedded in an MCMC algorithm. Let first assume that the number of deaths Dx,t follows a Poisson distribution with rateEx,tmx,t, where log(mx,t) is assumed to be
the standard LC model. We have,
P(Dx,t = dx,t) = exp−Ex,tmx,t(E x,tmx,t)dx,t dx,t! , log(Ex,tmx,t) = h N Lα+ log(Ex,t) N Lβ i 1 N Lκt , N Lκt=N Lκt−1+N Lδ+N Lωt, N Lωt∼N(0,N Lσω2).
Let our static model parameter vector be defined as ΘPLC = {N Lα, N Lβ, N Lδ, N Lσ2ω, N Lσβ2}, then
our MCMC algorithm is as follows: 1. Initialise ΘPLC= Θ(0)PLC. 2. Fori= 1, . . . , M,
(a) Apply the EKF forκ(i)using the function EKF-LCκt(N Lα(
i),
N Lβ(
i), N Lδ(i),
N L(σ2ω)(i)).
(b) Using the function MH-LC κt((N Lκ∗)(
i), N Lκ( i), N Lα( i), N Lβ( i), N Lδ(i), N L(σ2ω)(i)) produce draws from π(κ|Θ(PLCi−1),y1:T).
(c) Using the function MH-LC β(N Lκ(
i), N Lα( i), N Lβ( i), N Lδ(i), N L(σω2)(i), (N Lσ2β)(i)) produce
draws from π(κ|ΘPLC(i−1),y1:T) for κ(i).
(d) Gibbs sampling for Θ(PLCi) from π(ΘPLC|κ(i),y1:T).
A sample of the conditional distribution π(κ1:tT|ΘPLC,y1:tT) is obtained via forward-backward
sampling using the EKF and the MH algorithm. The full MCMC algorithm is shown in Appendix B. To draw samples fromπ(ΘPLC|N Lκ1:(i)tT,y1:tT), we assume the following conjugate prior distributions:
π(N Lδ)∼N(µδ, σδ2),
π(N Lσω2)∼I.G(aω, bω), π(N Lσ2β)∼I.G(aβ, bβ)
π(N Lαx)∼LogGamma(aα, bα), π(N Lβx)∼N(µβ, σ2β) for x∈ {(x1, ..., xn).
Non-informative priors were chosen to ensure the posterior distribution is mainly data driven. The conditional posterior distribution for ΘPLC are as follows11:
π(N Lαx|y, N Lβ, N Lκ)∼LogGamma(aα+ PT t=1dx,t, bα+PTt=1Ex,texp(N Lβx N Lκt)), π(N Lσβ2|y, N Lβ)∼I.G aβ+ N2, bβ+12N LβN Lβ ′, π(N Lδ|y, N Lκ, N Lσω2)∼N (µδ N Lσ2ω+σδ2 T P t=1 (N Lκt−N Lκt−1))(σδ2N Lσ2ω)−1, (σ2δN Lσω2)(T σδ2+N Lσ2ω)−1 , π(N Lσ2 ω|y, N Lκ, N Lδ)∼I.G(aω+ T 2, bω+ (N Lκt−(N Lκt−1+N Lδ))2),
the sampling procedure forπ(N Lβx|y,N Lκ,ΘPLC) was accomplished via a Random Walk MH
algo-rithm (see SI Algoalgo-rithm 3).
3.3. The Cairns-Blake-Dowd model
The CBD model has a wide variety of applications ranging from actuarial pricing, longevity derivative pricing and mortality predictions. Cairns et al. (2006) proposed to model the dynamics of the true 1-year death rates as follows
qx,t = eκ1,t+κ2,t(x−x¯) 1 +eκ1,t+κ2,t(x−x¯), or equivalently ln qx,t 1−qx,t =κ1,t+κ2,t(x−x¯), (3.7)
where ¯x =n−1Pixi and the latent period factor κt := [κ1,t, κ2,t]′ is a multivariate random walk
with drift process with non-trivial variance-covariance structure:
κt=θ+κt−1+ωt, ωt ∼N(0,Σ), (3.8)
where θ := [θ1θ2]′ is the drift vector,and Σ is a 2×2 covariance matrix. For a more detailed analysis of the CBD model see SI Section 1.4
3.3.1. Linear variant
Since the true death probabilities, qx,t, are unobservable, we can instead model the observable
crude death probabilities, ˜qx,t, estimated using Eq. (3.1), which allows the CBD model to directly
follow a linear structure shown in Eqs. (3.7) and (3.8). For convenience, let ΘCBD = (θ1, θ2, σ2ν,Σ)
denote the static parameter vector for the CBD model in Eq. (3.7) and with the introduction of an error component. Let yx,t := ln(˜qx,t/(1−q˜x,t)), then the CBD model in linear state-space
representation is given by yx1,t .. . yxn,t = 1 (x1−x¯) .. . ... 1 (xn−x¯) κ1,t κ2,t + νx1,t .. . νxn,t , νx1,t .. . νxn,t ∼ N(0,Inσ2ν), (3.9) κ1,t κ2,t = θ1 θ2 + κ1,t−1 κ2,t−1 + ω1,t ω2,t , ω1,t ω2,t ∼N(0,Σ), (3.10)
whereInrepresents then×nidentity matrix. Eqs. (3.9) and (3.10) correspond to the measurement
equation and the state equation respectively. A measurement error term, νx,t, was included in
Eq. (3.9) to facilitate the linear Gaussian state-space model estimation. Since model (3.9) and (3.10) belongs to the class of linear and Gaussian state-space models, we can perform MCMC estimation of the model utilizing a multivariate Kalman filter. Similar to the case in the LC model, our aim is to draw samples from the joint posterior densityπ(κ1:T,ΘCBD|y1:T) using Gibbs
sampling which is as follows: 1. Initialise ΘCBD= Θ(0)CBD. 2. Fori= 1, . . . , M,
(a) sample κ(1:i)T fromπ(κ1:T|Θ(CBDi−1),y1:T),
(b) sample Θ(CBDi) from π(ΘCBD|κ(1:i)T,y1:T).
A sample fromπ(κ1:T|ΘCBD,y1:T) can be obtained via a multivariate forward-backward sampling.
To draw samples from the full conditional posterior distributions, we assume the following priors for ΘCBD, π(σ2ν)∼I.G(aν, bν), π(θi)∼N(µθi,Σθi), i= 1,2, π(Σ|(σ2 1, σ22))∼I.W (ν+ 2)−1,2ξ diagσ12 1 ,σ12 2 , π(σ2k)indep∼ I.G12,A1 k , k= 1,2,
where I.W corresponds to the Inverse Wishart distribution, Ak are hyper-parameters, and the
notation indep∼ corresponds to “independently distributed”. For more information for the MCMC algorithm and posterior derivations, see Leung et al. (2018). Using the prior distributions described above, the posterior distributions for the static parameters are given by:
π(σ2ν|y,κ)∼I.G(aν +T n2 , bν+12 T P t=1 n P x=1 (yx,t−(κ1,t+ (x−x¯)κ2,t))2),
π(θ|y,κ,Σ)∼N(Σ−θ1+nΣ−1)−1Σθ−1µθ+nΣ−1PTt=1[κt−κt−1] , Σ−θ1+TΣ−1−1, π(σ2 k|Σ) i.i.d ∼ I.G(ξ+2T, ξ[Σ−1] kk+(A1 k)2) for k∈(1,2), π(Σ|σ2 1, σ22,y,κ,θ)∼I.W(ξ+T+n−1,2ξ×diag(σ12 1 ,σ12 2 ) +PTt=1[κt−θ] [κt−θ]′), where [Σ−1]
kkdenotes the (k, k) element of [Σ−1]. Derivations of these posteriors are provided in SI
Section 1.5. The choice of a hierarchical prior for Σ is to circumvent the issue of the Inverse-Wishart prior leading to a biased estimator for the correlation coefficient when the variances are small.12 3.3.2. Nonlinear variant
The Binomial model for the number of deaths is used for the CBD model due to its canonical link with the generalized dynamic linear model in mortality modelling. Instead of using the crude death rates, we use the observed number of deaths, and assume it follows aB(n, p), withn= Ex,t,
p=qx,t, and logit(qx,t) is defined as in Eq. (3.7). The nonlinear state-space framework is given as
follows: P(Dx,t = dx,t) = Ex,t dx,t qx,tdx,t(1−qx,t)Ex,t−dx,t, logit(qx,t) =h1 (x−x¯) i N Lκ1,t N Lκ2,t , N Lκ1,t N Lκ2,t = N Lθ1 N Lθ2 + N Lκ1,t−1 N Lκ2,t−1 + ω1,t ω2,t , ω1,t ω2,t ∼N(0,N LΣ).
With the static model parameter vector ΘBCBD = {N Lθ1,N Lθ2,N LΣ}, the MCMC algorithm is as
follows:
1. Initialise ΘBCBD= Θ(0)BCBD. 2. Fori= 1, . . . , M,
(a) Apply the EKF forN Lκ
(i)
1:T using the function EKF κt(N Lθ(
i−1),
N LΣ(
i)).
(b) Using the function MHκt(κ∗1·, κ∗2·, N Lκ1·, N Lκ2·, N Lθ,N LΣ) produce draws from π(N Lκ1:T|Θ
(i−1)
BCBD,y1:T).
(c) Gibbs sampling for ΘBCBD(i) from π(ΘBCBD|κ1:(i)T,y1:T),
where, N Lκ∗1· := N Lκ∗1,1:T and N Lκ∗2· := N Lκ∗2,1:T. A sample from π(N Lκ1:T|ΘCBD,y1:T) can be
obtained via an EKF with MH algorithm. To draw samples from the posterior distributions,
π(ΘBCBD|κ1:(i)T,y1:T), we assume the following priors for ΘBCBD,
π(N Lθi)∼N(µθi,Σθi), i= 1,2, π(N LΣ|(σ21, σ22))∼I.W (ν+ 2)−1,2ξdiagσ12 1, 1 σ2 2 , π(σ2k)indep∼ I.G12,A1 k k= 1,2.
Using the prior distributions described above, the posterior distributions for the static parameters are given by:
π(N Lθ|y,κ,N LΣ)∼N (Σ−1 θ +nN LΣ−1)−1 Σθ−1µθ+nN LΣ−1 PT t=1[N Lκt−N Lκt −1] , Σ−1 θ +TN LΣ−1 −1 , π(σ2k|N LΣ) i.i.d ∼ I.G(ξ+2T, ξ[N LΣ−1]kk+(A1 k)2) for k∈(1,2), π(N LΣ|σ12, σ22,y,N Lκ,N Lθ)∼I.W(ξ+T+n−1,2ξ×diag( 1 σ2 1, 1 σ2 2)+ PT t=1[N Lκt−N Lθ] [N Lκt−N Lθ] ′),
where [N LΣ−1]kk denotes the (k, k) element of [N LΣ−1]. Derivations of these posteriors are provided
in SI Appendix 1.5. The choice of a hierarchical prior for Σ is to circumvent the issue of the inverse-wishart prior leading to a biased estimator for the correlation coefficient when the variances are small13. Details for the MCMC algorithm including EKF are provided in Appendix C.
4. Empirical Results
In this section, we compare the results obtained from estimating the LC and the CBD models under the linear and nonlinear variants. We used the Human Mortality Database for the following list of countries: Australia, United Kingdom, Italy, France, Spain, New Zealand, Sweden, Germany, and Russia aged 50 to 95 total population, across time periods 1950−2000. For countries where the mortality data does not date back to 1950, the most earliest year was used instead. A total of 20,000 MCMC iterations are conducted, and the first 5,000 was used as the burn-in period. Hyper-parameters were chosen to be non-informative, such that our posterior distribution will be mainly data driven. The hyper-parameter specifications are shown in SI Table 1, and they were identical for all countries. The Geweke statistic is a tool used in Bayesian statistics to determine whether the last iterations of the MCMC draws from the full conditional posteriors are different from the
first half of the iterations, if there is no statistical evidence of a difference we say that the chain has reached a stationary state. The Geweke Statistic shown in SI Tables 2 to 19, indicated that most parameters reached a stationary state with a 95% confidence. Furthermore, the trace-plots shown in SI Figures ?? and 11 indicates no apparent signs of serial correlation, and once again confirming our hypothesis that the chain has reached convergence. For more details on the LC and CBD parameter implications see SI Section 1.6.1.
4.1. K-step ahead forecasting
In this section we provide the algorithm to produce aK-step ahead forecast for both the linear and nonlinear variants of the LC and CBD models. Under the Bayesian method of forecasting, we utilize our posterior draws which retain information about our parameter uncertainty to produce ourK-step ahead forecasts. The method to produce the forecasts for the LC and CBD model varies in the dimension of the variance-covariance matrix and drift term. Let us start by denotingkas the
kthstep ahead forecast, this is consistent with the notion used in Algorithms 1 and 2. Furthermore,
let m denote the mth iteration from the MCMC, whereM is the number of kept iterations after
the burn-in period. For the parameter estimation results and convergence statistics see SI Section 1.7.
Algorithm 1 BayesianK step ahead forecasting for the LC model
1: fork= 1, ..., K do 2: for i= 1, ...M do 3: κi T+k ∼N(κiT+(k−1)+δi,(σω2)i) 4: log( ˜mix,T+k)∼N(αix+βixκiT+k(σε2)i) (Linear) 5: mi x,T+k= exp(αix+βxiκiT+i) (Nonlinear) 6: end for 7: end for
Algorithm 2 BayesianK step ahead forecasting for the CBD model
1: fork= 1, ..., K do 2: for i= 1, ...M do 3: κiT+k∼N(κiT+(k−1)+θi,(σ2ν)i) 4: logit(˜qiT+k)∼N((x−x¯)κiT+(k −1),(σ 2 ε)i) (Linear) 5: qi T+k= exp((x−x¯)κi T+k) 1+exp((x−x¯)κi T+k) (Nonlinear) 6: end for 7: end for
For both Algorithms 1 and 2, the latent states are taken from the Forward Filtering Backward Sampling (FFBS) algorithm, where the model static parameters are taken from Gibbs sampling at
the mth iteration. SI Section 1.7 shows a 10-step ahead forecast ofκ
t from the LC model and κt
from the CBD model. The 10-year ahead mortality forecasts for ages 50-90 in increments of 10 years over the years 2000 till 2010 was also produced. For example, m(90, t) will correspond to the mortality rate for the age 90 of a specified country across the time horizon of 2000 till 2010.
5. The backtesting of stressed longevity trends
In this section, we apply a stress test procedure on the longevity trend with the aim of capturing longevity risk. In essence the idea is to obtain a liability estimate by stressing the mortality forecasts at the 0.5% interval, this in turn will trigger an increased in the liability estimate conditioned on improvements in life expectancy. Assume now we have a $1 continuously paid temporary annuity
to a person currently aged x for the next N years. Let the price of a zero coupon bond which matures in T years be denoted as B(0, T), we then have the liability for a $1 annuity paid to a
person aged xat time tfor the nextN years to be,14
Lx(N) = N
X
n=1
B(0, n)Sx(t, n). (5.1)
We intentionally choose to not use market based annuity rates since besides longevity risk the premium will include company dependent factors such as profits and expenses. Eq. (5.1) will only be affected by longevity improvements over time and as such allows us to focus on longevity trend risk. First, let N be determined by our limiting age set at ω = 95, for example if x = 55 then
N = ω−x. Using our forecast intervals obtained in section 4.1, a mean and upper bound on
Lx(N) was obtained. Denote the mean of Lx(N) as Lmeanx (N) = E[Lx(N)] and the upper bound
as Lupperx (N), where Lupperx (N) is calculated using the 0.5% quantile of the mortality forecasts15
applied to Eq. (3.2), and thus would represent the liability estimated at the upper 99.5% quantile. In order to generate our out-of-sample forecasts, we used ages x1 = 50 till xn=ω= 95, where
the period of interest is from year 2001 till 2010. The forecasts was obtained using the methods described in section 4.1 applied to J = 9 different countries. Lastly, we obtain the following set:
{(Lmeanx (N), Lxupper(N)) :x∈(50, ...,95)}.
The capital requirement is a ratio which determines the extra capital amount needed to be held at time t for someone aged x, given that mortality is stressed at the 0.5% level. It is determined
14Here,B(0, t) := ( 1 1+i)
t
(a) Average over countries of the Percentage of extra capital required across ages 50−95.
(b) Average difference of Realised annuity and the upper 99% predicted annuity liabil-ity across ages 50−95 under both Lee-Carter model variants Figure 1: LC model using, CapR = Lupperx (N) Lmean x (N) −1 ×100%. (5.2)
Figures 1 and 2 represent the percentage of extra capital required for a 99% mortality stressed scenario. It is interesting to note that the linear and nonlinear variant of the LC model produced similar capital requirements and average difference across all countries for the realised annuity and 99.5% upper bound. Whereas on the contrary, the nonlinear CBD model produced largely varying results. The graph for the extra capital amount shows that the linear CBD model required a larger amount for all ages when compared with its nonlinear counterpart. Furthermore, we see that the average difference across all ages shows that it peaks for the higher age groups, this indicates that the linear CBD model overestimates the upper 99.5% annuity price. The findings can be summarized as follows. Firstly, the linear and nonlinear LC models show similar structures in the extra capital required and average difference of the upper annuity liability compared with the realised one, thus not much difference can be seen between the two models. The linear CBD model seems to over estimate the annuity liabilities and hence has the highest peak for the average difference curve, this is also reflected in the larger extra capital required to ensure a 99.5% of the annuity obligation can be met.
(a) Average over countries of the Percentage of extra capital required across ages 50−95.
(b) Average difference of Realised annuity and the upper 99% predicted annuity liability
across ages 50−95 under both CBD model
variants
Figure 2: CBD model
longevity scenarios were enough to capture the experienced liability over the forecasted time horizon from 2001 till 2013. Our aim is to test whether the “hits” (whenI= 1) follows a Be(p∗) distribution, where p∗ represents the quantile of interest, in our case we are interested in a longevity stressed scenario at the upper 99.5%, thus the probability of violations should bep∗ = 0.005. A backtesting procedure using BF and BLRT test statistic shown in Eqs. (2.12) and (2.13) will be used to determine the strength of evidence for the null and alternative models. This procedure statistically examines whether the frequency of exceptions for N-year annuity liabilities is in line with the regulations of Solvency II. That is, whether companies are able to hold reserves capable of sustaining the liabilities in the long term. In this section we define “long term” to be capped atωyears, however this assumption can be relaxed. Letj represent a country used in Section 4 and denotejL∗x(N) for
x∈(50, ...,95) as the sample path of our realised liabilities. Let us create an indicator variable,Ixj
where for a given interval forecast (jLmeanx (N), jLupperx (N)), we have
Ipj(x) = 1, ifjL∗x(N)∈(jLmeanx (N), jLupperx (N)), 0, ifjL∗x(N)∈/(jLupperx (N), jLupperx (N)). (5.3)
We wish to test for Ip(x)∼Be(p∗). Let Ip∗ :={Ipj(t) :j∈(1, ..., J), x∈(50, ...,95)}, and let m1
vector of size T =m1+m0, and the joint likelihood function will be given by,
l(Ip|p) =pm1(1−p)m0. (5.4)
We assign the point mass prior underH0 :p=p∗ and under the alternativeH1 :=p6=p∗ we use a Beta(1,1) prior distribution which is a uniform over (0,1). Let
π(p) = 1 ifp=p∗, Beta(1,1), ifp6=p∗. with, BF01= (p∗)m1(1−p∗)m0 β(a+m1, b+m0) .
For the BLRT statistic we find TBLRT(y, θ) = −2[Aπ0 −Bπ1] + 1 as defined in Eq. (2.13), with
p∗ = 0.005, a = 0.5, and b = 0.5. Appendix Table 3 shows the violations across age groups and countries, and also results of the extra capital required and difference from realised annuity liability.16
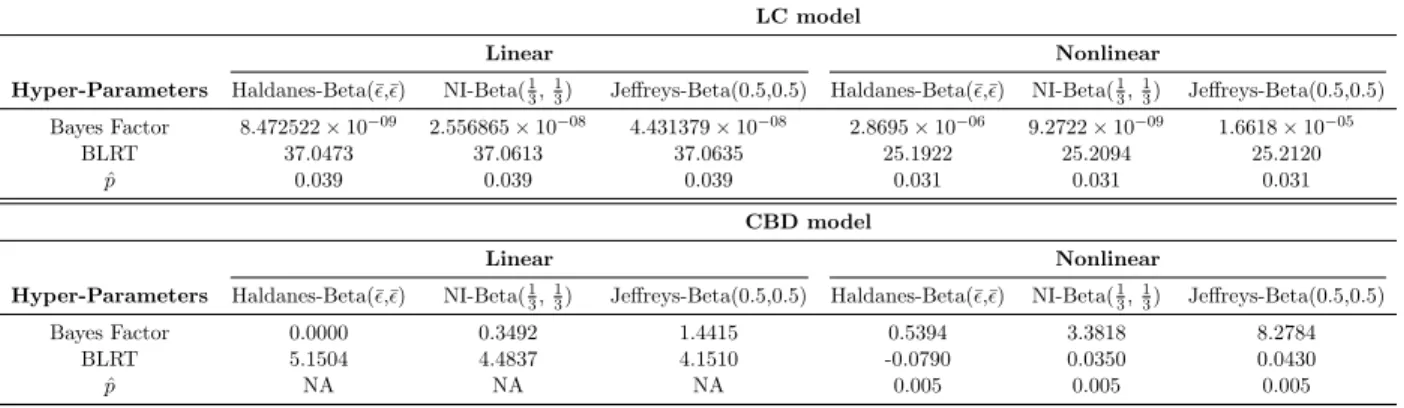
Table 2 contains the BF and BLRT statistic for each variant of the LC and CBD model by tallying the “ones” from Appendix Table 3. A higher value for BF01 represents evidence favouring
H0, meaning that indeed the violations occur at frequency ofp∗. For values smaller than 1, it shows evidence towards H1, that violations do not follow a frequency of p∗. For the BLRT statistic, we compare it against the χ2-distribution with 1 degrees of freedom. At the 5% region, the critical value (CBLRT) is 2.841. A variety of prior specifications was conducted as a means of robustness check, however the goal of choosing a diffuse prior still applies. Besides the Beta(0.5,0.5) distribution corresponding to Jeffreys Prior, the Beta(¯ǫ,¯ǫ) known as Haldane’s prior and the Neutral-Information (NI) Beta(13,13) prior was also used.17
Furthermore, we can back-solve BF01to obtain an implicit ˆp, which represents the true frequency rate implied by the model. ˆpcan be found by,
ˆ p= min p∈(0,1) (p)m1(1−p)m0 β(a+m1, b+m0) . (5.5)
16For the full table of results see SI Section 2.
Table 2: Derived BF and BLRT under the linear and nonlinear LC and CBD models across varying prior hyper-parameter specifications.
LC model
Linear Nonlinear
Hyper-Parameters Haldanes-Beta(¯ǫ,¯ǫ) NI-Beta(1
3,13) Jeffreys-Beta(0.5,0.5) Haldanes-Beta(¯ǫ,¯ǫ) NI-Beta(13,13) Jeffreys-Beta(0.5,0.5)
Bayes Factor 8.472522×10−09 2.556865×10−08 4.431379×10−08 2.8695×10−06 9.2722×10−09 1.6618×10−05 BLRT 37.0473 37.0613 37.0635 25.1922 25.2094 25.2120 ˆ p 0.039 0.039 0.039 0.031 0.031 0.031 CBD model Linear Nonlinear
Hyper-Parameters Haldanes-Beta(¯ǫ,¯ǫ) NI-Beta(1
3,13) Jeffreys-Beta(0.5,0.5) Haldanes-Beta(¯ǫ,¯ǫ) NI-Beta(13,13) Jeffreys-Beta(0.5,0.5)
Bayes Factor 0.0000 0.3492 1.4415 0.5394 3.3818 8.2784
BLRT 5.1504 4.4837 4.1510 -0.0790 0.0350 0.0430
ˆ
p NA NA NA 0.005 0.005 0.005
As we observe in Table 2, the outcomes of both test statistics and ˆp is shown. Both the LC models presented with a rejection of H0 under the BF and BLRT, meaning that a frequency of p∗ was rejected. In particular since the BF can be compared between models, we see that the nonlinear version of the LC model presents as a stronger model compared with its linear variant due to its larger BF, with its resulting ˆpcloser top∗. The nonlinear CBD model performed the best out of the group, this can be seen from the BF and BLRT statistic giving evidence forH0 and the BF being the largest of the models. Its implicit ˆp of 0.005 in Table 2 also shows that the model achieved the correct mortality coverage. It is interesting to note that although the linear CBD model was not able to achieve the correct coverage, it was due to it having no violations across all countries and ages. This meant that the linear CBD model overestimated the mortality rate and was able to capture the realised longevity liability in all cases. From a pricing perspective, although the linear variant of the CBD model captured all realised liabilities under its mortality forecasts, the liability estimates over the long run would over compensate for more than 0.5% under the longevity stress trend scenario. In a scenario where we are trying to minimize the capital required in order to achieve a 0.5% coverage, the nonlinear CBD model out-performed all models. With varying prior specifications, the test outcomes said mostly consistent. Under Jeffreys prior, the linear CBD model also seemed to not reject the H0 hypothesis, however if we compare that to the nonlinear CBD model, it is over 8 times more likely to not reject the H0. As pointed out by Li et al. (2014), the BLRT seems to have the least deviations with prior changes, mainly due to its loss function being averaged over the posterior rather than the prior distribution as in the BF.
6. Conclusion
In this paper we develop a new approach to backtesting under the Bayesian paradigm which can be an excellent tool for decision and policy makers and its demonstrated effectiveness establishes its excellent potential for a much broader area of applications. We utilized tools from Bayesian decision theory to determine test outcomes from the UC test and as an application we used annuity liabilities in a longevity stressed scenario from two renowned mortality models, the LC model and CBD model. To keep the framework aligned in the Bayesian paradigm, we chose to undergo a Bayesian model estimation in the linear and nonlinear state-space framework. Using the dynamic linear model structure, we modelled the central death counts using the Poisson distribution under the LC model and Binomially distributed death rates using the CBD model. We show that their nonlinear variants benefited more so when backtested under the UC test.
As a natural extension of our work, one could consider the multivariate version of our newly proposed backtest which would have to account for possible correlations in VaR-violations across different types of annuities and time. Moreover, we want to develop a set of tests of i.i.d. VaR-violations, and of course, of conditional coverage under the same Bayesian decision theoretic frame-work. As these issues are beyond the scope of the present paper, we will address them in our future research.
Acknowledgement The authors would like to thank the participants at the Quantitative Fi-nance and Risk Analysis (QFRA) 2019 and seminars at Boston University, University of Liverpool, Monash University and Shanghai University for helpful comments. Any remaining errors are ours.
References
Berger, J. O. and Sellke, T. (1987). Testing a point null hypothesis: The irreconcilability ofpvalues and evidence. Journal of the American Statistical Association, 82(397):112–122.
Berkowitz, J. and O’Brien, J. (2002). How accurate are value-at-risk models at commercial banks? The Journal of Finance, 57(3):1093–1111.
Cairns, A., Blake, D., and Dowd, K. (2006). A two-factor model for stochastic mortality with parameter uncertainty: Theory and calibration. Journal of Risk and Insurance, 73(4):687–718. Cairns, A. J., Blake, D., Dowd, K., Coughlan, G. D., Epstein, D., Ong, A., and Balevich, I. (2009).
A quantitative comparison of stochastic mortality models using data from england and wales and the united states. North American Actuarial Journal, 13(1):1–35.
Campbell, S. D. (2007). A review of backtesting and backtesting procedures. Journal of Risk, 9(2):1–18.
Carter, C. K. and Kohn, R. (1994). On Gibbs sampling for state space models. Biometrika, 81(3):541–553.
Christoffersen, P. (2009). Value–at–risk models. In Handbook of Financial Time Series, pages 753–766. Springer.
Christoffersen, P. and Pelletier, D. (2004). Backtesting value-at-risk: A duration-based approach. Journal of Financial Econometrics, 2(1):84–108.
Christoffersen, P. F. (1998). Evaluating interval forecasts. International Economic Review, 4(39):841–862.
Deb´on, A., Montes, F., and Puig, F. (2008). Modelling and forecasting mortality in Spain.European Journal of Operational Research, 189(3):624 – 637.
Drenovak, M., Rankovi´c, V., Ivanovi´c, M., Uroˇsevi´c, B., and Jelic, R. (2017). Market risk man-agement in a post-Basel II regulatory environment. European Journal of Operational Research, 257(3):1030–1044.
Eckert, J. and Gatzert, N. (2018). Risk-and value-based management for non-life insurers under solvency constraints. European Journal of Operational Research, 266(2):761–774.
Fung, M. C., Peters, G. W., and Shevchenko, P. V. (2017). A unified approach to mortality mod-elling using state-space framework: characterisation, identification, estimation and forecasting. Annals of Actuarial Science, 11(2):343–389.
Glasserman, P., Heidelberger, P., and Shahabuddin, P. (2002). Portfolio value-at-risk with heavy-tailed risk factors. Mathematical Finance, 12(3):239–269.
Goodman, S. N. (2001). Of p-values and bayes: a modest proposal. Epidemiology, 12(3):295–297.
Hari, N., De Waegenaere, A., Melenberg, B., and Nijman, T. E. (2008). Longevity risk in portfolios of pension annuities. Insurance: Mathematics and Economics, 42(2):505–519.
Harvey, C. R. (2017). Presidential address: the scientific outlook in financial economics. The Journal of Finance, 72(4):1399–1440.
Konicz, A. K. and Mulvey, J. M. (2015). Optimal savings management for individuals with defined contribution pension plans. European Journal of Operational Research, 243(1):233–247.
Kupiec, P. H. (1995). Techniques for verifying the accuracy of risk measurement models. The Journal of Derivatives, 3(2):73–84.
Lee, R. D. and Carter, L. R. (1992). Modeling and forecasting us mortality.Journal of the American Statistical Association, 87(419):659–671.
Leung, M., Fung, M. C., and O‘Hare, C. (2018). A comparative study of pricing approaches for longevity instruments. Insurance: Mathematics and Economics, 82:95 – 116.
Li, Y., Zeng, T., and Yu, J. (2014). A new approach to bayesian hypothesis testing. Journal of Econometrics, 178:602–612.
Nieto, M. R. and Ruiz, E. (2016). Frontiers in VaR forecasting and backtesting. International Journal of Forecasting, 32(2):475–501.
Plat, R. (2011). One-year value-at-risk for longevity and mortality. Insurance: Mathematics and Economics, 49(3):462–470.
Wied, D., Weiß, G. N., and Ziggel, D. (2016). Evaluating value-at-risk forecasts: A new set of multivariate backtests. Journal of Banking & Finance, 72:121–132.
Ziggel, D., Berens, T., Weiß, G. N., and Wied, D. (2014). A new set of improved value-at-risk backtests. Journal of Banking & Finance, 48:29–41.
Appendix A Bayesian Testing
A.1 Proof of Lemma 2.1
When testing two hypotheses, H0 and H1, where H0 is a point null hypothesis and H1 is a composite hypothesis, the BF is given by,
l(y|θ=θ0)
R
θπ(y|θ, H1)π(θ|H1)dθ
Under the UC backtest assumptions, the sequence of ones and zeros are assumed to follow a Bernoulli distribution, hence the likelihood function for the data corresponds to,
l(I|p) =
m
Y
i=1
pyi(1−p)1−yi =pm1(1−p)m0,
where m is the number of data points, m1 represents the number of “ones” in the data, likewise
m0 corresponds to the number of “zeros”. The null hypothesis is defined as p=p∗ for a given p∗, and the alternative hypothesis as p6=p∗. With the following prior specifications forp:
π(p) = 1 ifp=p∗, Beta(a, b), ifp6=p∗.
We derive an analytical form for the BF due to the conjugate property of the Beta-Binomial distribution, i.e., l(y|p=p∗) R p6=p∗l(y|θ)π(θ)dθ = (p ∗)m1(1−p∗)m0 R p6=p∗pm1(1−p)m0Beta(a, b)dp = (p ∗)m1(1−p∗)m0 β(m1+a, m0+b)Rp6=p∗ pm1+a−1(1−p)m0+b−1 β(m1+a,m0+b) dp = (p ∗)m1(1−p∗)m0 β(m1+a, m0+b) .
A.2 Proof of Theorem 2.1
To derive the analytical form for the BLRT for the UC test, we begin with the test statistic,
TBLRT(y, θ) =−2 Z θ log(l(y|θ0))π(θ|y)dθ | {z } (1) − Z θ log(l(y|θ))π(θ|y)dθ | {z } (2) + 1.
Here, it can be shown that integral (1) can be decomposed to the following:
Z θ log(l(y|θ0))π(θ|y)dθ= Z θ log((θ∗)m1(1−θ∗)m0)θ a+m1−1(1−θ)b+m0−1 β(a+m1, b+m0) dθ =m1log(θ∗) +m0log(1−θ∗). (A.1)
Now, expanding integral (2), we have: Z θ log(l(y|θ))π(θ|y)dθ = Z θ [m1log(θ) +m0log(1−θ)] θa+m1−1(1−θ)b+m0−1 β(a+m1, b+m0) dθ. Z θ m1log(θ) θa+m1−1(1−θ)b+m0−1 β(a+m1, b+m0) dθ= m1 β(a+m1, b+m0) Z θ log(θ)θa+m1−1(1−θ)b+m0−1dθ = m1 β(a+m1, b+m0) Z θ ∂θa+m1−1 ∂a (1−θ) b+m0−1dθ = m1 β(a+m1, b+m0) ∂β(a+m1, b+m0) ∂a =m1∂log(β(a+m1, b+m0)) ∂a =m1∂log(Γ(a+m1)) ∂a − m1∂log(Γ(a+m1+b+m0)) ∂a =m1(ψ(a+m1)−ψ(a+m1+b+m0)). (A.2) Z θ m0log(1−θ) θa+m1−1(1−θ)b+m0−1 β(a+m1, b+m0) dθ= Z θ m0log(1−θ) θa+m1−1(1−θ)b+m0−1 β(a+m1, b+m0) dθ = m0 β(a+m1, b+m0) Z θ log(θ)θa+m1(1−θ)b+m0dθ = m0 β(a+m1, b+m0) Z θ ∂θa+m1−1 ∂a (1−θ) b+m0−1dθ = m0 β(a+m1, b+m0) ∂β(a+m1, b+m0) ∂a =m0∂log(β(a+m1, b+m0)) ∂a =m0∂log(Γ(a+m1)) ∂a − m1∂log(Γ(a+m1+b+m0)) ∂a =m0(ψ(b+m0)−ψ(a+m1+b+m0)). (A.3)
Combing Eqs. (A.1), (A.2), and (A.3), we retrieve the analytical form for th BLRT statistic.
TBLRT(y, θ) =−2[m1log(θ∗) +m0log(1−θ∗)−(m1(ψ(a+m1)−ψ(a+m1+b+m0))+
as required.
Appendix B MCMC Algorithm for the Lee-Carter Poisson model
(i) Set initial values for the parameter vector (α0, β0,κ0, δ0, (σ2
ω)0, (σβ2)0).
(ii) Conditional on (α(i−1), β(i−1), δ(i−1)), apply the EKF and Backward Smoother shown in Algorithm 1 of SI to obtainκ∗ as the candidate for step (iii).
(iii) Simulate κ(i) using the MH step for κt shown in Algorithm 2 of SI, the candidate draw is
taken from step (ii) to obtain the density f∗ and κ(i−1) is used to compute the density f.
(iv) Simulate β(i) using the MH step for βx shown in Algorithm 3 of SI.
(v) Drawα(i)from the transformed posterior LogGamma(aα+Ptdx,t, bα+PtEx,texp(βx(i−1)κ(ti−1))).
(vi) Drawδ(i)from its posterior distributionN(µ, σ2), withµ= 1/( 1
100+(σ2T−1 ω)(i−1))(1/((σ 2 ω)(i−1))) P t(κ (i) t − κ(ti−)1) and,σ2 = (1001 +(σ2T−1 ω)(i−1))(1/(σ 2 ω)(i−1)).
(vii) Draw (σ2β)(i) from its posterior distributionI.G(aβ+n/2, bβ+ (1/2)ββ′).
(viii) Draw (σ2 ω)(i) from I.G(aω+ (T −1)/2, bω+ (1/2)Pt((κ (i) t −κ (i) t−1)−δ(i))2). (ix) Conditional on κ(i),α(i),β(i−1),(σ2
ω)(i),(σβ2)(i), simulate β(i) using Algorithm 3 with tuning
parameterσ2x.
Appendix C MCMC Algorithm for the CBD Binomial model
(i) Set initial values for the parameter vector (κ01,κ02, θ0, Σ0).
(ii) Conditional on (θ(i−1), Σ(i−1)), apply the EKF and Backward Smoother shown in Algorithm 4 of SI to obtain κ∗ as the candidate for step (iii).
(iii) Simulate κ(i) using the MH step for κshown in Algorithm 5 of SI. The candidate draw,κ∗,
is taken from step (ii) to obtain the densityf∗ andκ(i−1) is used to compute the density f.
(v) Draw θ(i) from its posterior distributionπ(θ(i)|y,κ1(i),κ(2i),Σ(i−1)).
(vi) Draw Σkk(i) from its posterior distribution π(Σ(kki)|y,κ1(i),κ(2i),θ(i)) for k∈1,2.
(vii) Draw Σ(i) from its posterior distribution π(Σ(i)
Appendix D Annuity Liability Results
Table 3: Table showing the percentage of extra capital required, difference from realised annuity, and the indicator variablejIpx(N) over
all countries used under the linear and nonlinear LC and CBD models.
LC model: Linear variant
Australia United Kingdom Italy France Spain New Zealand Sweden Germany Russia x CapR(%) ∆R jIxp(N) CapR(%) ∆R jIpx(N) CapR(%) ∆R jIxp(N) CapR(%) ∆R jIpx(N) CapR(%) ∆R jIpx(N) CapR(%) ∆R jIxp(N) CapR(%) ∆R jIpx(N) CapR(%) ∆R jIpx(N) CapR(%) ∆R jIxp(N) 62 1.0871 0.0345 0 1.3976 -0.0027 1 1.4167 0.0346 0 1.3211 0.0754 0 1.6937 0.1345 0 1.2647 0.0457 0 0.7653 0.0139 0 1.1181 0.0007 0 2.9916 0.1953 0 63 1.1863 0.0400 0 1.5136 -0.0126 1 1.5539 0.0459 0 1.4437 0.0793 0 1.8621 0.1560 0 1.3784 0.0342 0 0.8516 0.0229 0 1.2135 -0.0093 1 2.9308 0.0746 0 64 1.2891 0.0432 0 1.6438 -0.0277 1 1.7054 0.0484 0 1.5849 0.0882 0 2.0546 0.1594 0 1.4972 0.0355 0 0.9434 0.0225 0 1.3135 0.0030 0 2.8399 0.1390 0 65 1.4045 0.0434 0 1.7866 -0.0260 1 1.8837 0.0725 0 1.7383 0.1028 0 2.2676 0.1615 0 1.6369 0.0540 0 1.0441 0.0450 0 1.4354 0.0105 0 2.7367 0.1525 0 66 1.5266 0.0409 0 1.9488 -0.0182 1 2.0850 0.0875 0 1.9075 0.1149 0 2.5059 0.1859 0 1.7883 0.0644 0 1.1604 0.0651 0 1.5661 0.0700 0 2.6445 0.1601 0 67 1.6674 0.0451 0 2.1263 -0.0152 1 2.2985 0.1191 0 2.1026 0.1409 0 2.7705 0.1993 0 1.9546 0.0775 0 1.2778 0.0583 0 1.7244 0.0553 0 2.5420 0.0837 0 68 1.8089 0.0494 0 2.3145 -0.0063 1 2.5403 0.1292 0 2.3119 0.1550 0 3.0570 0.2183 0 2.1262 0.1207 0 1.4140 0.0878 0 1.8940 0.0893 0 2.5299 0.1208 0 78 3.6317 0.1937 0 4.8381 0.3167 0 6.0905 0.4478 0 5.3598 0.3220 0 6.3595 0.3362 0 4.3679 0.3027 0 3.3127 0.2586 0 4.6747 0.2946 0 4.5228 -0.0945 1 79 3.7922 0.2315 0 5.1090 0.3803 0 6.4520 0.4760 0 5.7091 0.3397 0 6.5175 0.3137 0 4.6064 0.4092 0 3.4933 0.3098 0 5.0275 0.3529 0 4.9417 -0.0125 1 83 4.4613 0.3334 0 5.9857 0.4174 0 7.6583 0.5039 0 6.7247 0.3379 0 6.6271 0.2436 0 5.6131 0.4988 0 4.1458 0.3883 0 6.1867 0.2771 0 7.3121 -0.0343 1 89 3.3419 0.2215 0 4.3346 0.2995 0 5.5666 0.2744 0 4.8763 0.2055 0 3.4448 -0.0029 1 4.5050 0.3767 0 3.2734 0.2785 0 5.2542 0.1695 0 11.1593 0.1917 0 90 3.0166 0.1994 0 3.8785 0.2400 0 5.0126 0.2081 0 4.3462 0.1607 0 2.9596 -0.0044 1 4.1780 0.3092 0 2.9890 0.2129 0 4.9491 0.1366 0 11.0033 0.1582 0 91 2.7074 0.1729 0 3.4274 0.2243 0 4.3573 0.1942 0 3.7929 0.1780 0 2.3229 -0.0517 1 3.8098 0.2965 0 2.6991 0.2141 0 4.4998 0.1203 0 11.6785 0.1490 0 93 2.0600 0.1206 0 2.4038 0.1287 0 2.9633 0.1280 0 2.5141 0.1001 0 1.6598 -0.0240 1 2.8808 0.2030 0 2.0125 0.1506 0 3.4585 0.0721 0 8.3450 0.1345 0 94 1.6045 0.0888 0 1.8104 0.0776 0 2.2519 0.0757 0 1.8733 0.0527 0 1.3483 -0.0252 1 2.2760 0.1381 0 1.5699 0.0976 0 2.7775 0.0496 0 6.5192 0.0965 0
LC model: Nonlinear variant
Australia United Kingdom Italy France Spain New Zealand Sweden Germany Russia x CapR(%) ∆R jIxp(N) CapR(%) ∆R jIxp(N) CapR(%) ∆R jIpx(N) CapR(%) ∆R jIxp(N) CapR(%) ∆R jIpx(N) CapR(%) ∆R jIpx(N) CapR(%) ∆R jIpx(N) CapR(%) ∆R jIpx(N) CapR(%) ∆R jIpx(N) 63 1.2695 0.0503 0 1.7360 -0.0052 1 1.6612 0.0471 0 1.5021 0.0803 0 2.0136 0.1692 0 1.4916 0.0420 0 1.0001 0.0261 0 0.8158 -0.0071 1 3.4137 0.0808 0 64 1.3791 0.0545 0 1.8832 -0.0182 1 1.8260 0.0508 0 1.6402 0.0890 0 2.2261 0.1744 0 1.6240 0.0450 0 1.1102 0.0267 0 0.8634 0.0025 0 3.2759 0.1433 0 65 1.4949 0.0559 0 2.0537 -0.0133 1 2.0143 0.0753 0 1.8048 0.1044 0 2.4505 0.1777 0 1.7636 0.0643 0 1.2315 0.0505 0 0.9456 0.0114 0 3.1094 0.1537 0 66 1.6245 0.0554 0 2.2286 -0.0037 1 2.2267 0.0908 0 1.9833 0.1172 0 2.7054 0.2038 0 1.8948 0.0736 0 1.3728 0.0714 0 1.0541 0.0751 0 2.9430 0.1604 0 91 2.3049 0.1302 0 3.2832 0.1903 0 4.3565 0.1690 0 3.6473 0.1583 0 1.9845 -0.0045 1 3.6316 0.2798 0 2.5641 0.1658 0 1.8977 0.0736 0 10.3803 0.1823 0 93 1.7617 0.0904 0 2.2035 0.1038 0 2.8844 0.1119 0 2.4057 0.0867 0 1.3278 -0.0075 1 2.9968 0.2011 0 1.8977 0.1172 0 1.3124 0.0389 0 7.7978 0.1469 0 94 1.4047 0.0676 0 1.6078 0.0588 0 2.1721 0.0629 0 1.7553 0.0420 0 1.0020 -0.0190 1 2.4746 0.1397 0 1.5227 0.0749 0 1.0246 0.0259 0 6.0321 0.1054 0 63 1.2695 0.0503 0 1.7360 -0.0052 1 1.6612 0.0471 0 1.5021 0.0803 0 2.0136 0.1692 0 1.4916 0.0420 0 1.0001 0.0261 0 0.8158 -0.0071 1 3.4137 0.0808 0 76 3.3241 0.1787 0 4.8855 0.3000 0 5.6138 0.4152 0 4.8224 0.3075 0 6.3248 0.4009 0 3.9225 0.2331 0 3.3571 0.2020 0 2.9556 0.2970 0 2.7350 -0.0271 1 78 3.6884 0.1930 0 5.4783 0.3447 0 6.4470 0.4454 0 5.5334 0.3251 0 7.0404 0.4116 0 4.4158 0.2503 0 3.8241 0.2429 0 3.4005 0.3212 0 3.3081 -0.1337 1 79 3.8234 0.2251 0 5.7610 0.4048 0 6.8284 0.4707 0 5.8599 0.3392 0 7.2263 0.3956 0 4.6646 0.3493 0 4.0534 0.3223 0 3.6003 0.3748 0 3.8562 -0.0345 1 80 3.9549 0.2345 0 6 0.3577 0 7.1986 0.4754 0 6.1692 0.3513 0 7.4181 0.4106 0 4.7713 0.3364 0 4.2201 0.3082 0 3.7534 0.3606 0 4.2202 -0.0017 1 83 4.3148 0.2917 0 6.5218 0.4124 0 7.9736 0.4780 0 6.8316 0.3269 0 7.3116 0.3324 0 5.4876 0.4766 0 4.5474 0.3669 0 3.9718 0.2714 0 6.4005 -0.0374 1
CBD model: Nonlinear variant
Australia United Kingdom Italy France Spain New Zealand Sweden Germany Russia x CapR(%) ∆R jIxp(N) CapR(%) ∆R jIpx(N) CapR(%) ∆R jIxp(N) CapR(%) ∆R jIpx(N) CapR(%) ∆R jIxp(N) CapR(%) ∆R jIpx(N) CapR(%) ∆R jIxp(N) CapR(%) ∆R jIxp(N) CapR(%) ∆R jIpx(N) 70 3.1158 0.0927 0 3.7519 0.1045 0 4.1374 0.1496 0 3.5182 0.0263 0 4.6068 0.1828 0 3.2907 0.1245 0 2.1797 -0.0052 1 1.7275 0.0502 0 7.9876 0.0733 0 82 11.7376 0.5207 0 12.3340 0.3435 0 15.3102 0.7242 0 12.1693 0.5594 0 15.0026 0.7515 0 11.7768 0.6471 0 8.0685 0.2912 0 5.5538 -0.0247 1 14.4498 0.5227 0