VOL.31,NO.3, 199–211
An optimal containership slot allocation for liner
shipping revenue management
SHIN-CHAN TING*
Department of Shipping and Logistics Management, Kai Nan University, Taoyuan, Taiwan, ROC
GWO-HSHIUNG TZENG
Department of Business Administration, Kai Nan University, Taoyuan, Institute of Technology Management, National Chiao Tung University, Hsinchu, Taiwan, ROC
In the competitive liner shipping market, carriers may utilize revenue manage-ment systems to increase profits by using slot allocation and pricing. In this paper, related research on revenue management for transportation industries is reviewed. A conceptual model for liner shipping revenue management (LSRM) is proposed and a slot allocation model is formulated through mathematical programming to maximize freight contribution. We illustrate this slot allocation model with a case study of a Taiwan liner shipping company and the results show the applicability and better performances than the previous allocation used in practice.
1. Introduction
Since liner shipping is a capital-intensive industry, the liner companies must invest large sums on vessels and containers. With the current fiercely competitive market, freight rates cannot be increased, and it is costly to reposition empty containers due to trade imbalances. Liner companies have difficulty generating reasonable profits and even run deficits. Therefore, operators should enhance service route planning and ship scheduling over the long term. In addition, they should build revenue management systems to increase more profits by using slot allocation and pricing.
Revenue management (RM), alternatively known as yield management (YM), can be defined as the integrated management of price and inventory to maximize the profitability of a company. It is also defined as the application of disciplined tactics that predict consumer behaviour at the micro-market level and optimize product availability and price to maximize revenue growth [1]. The effectiveness of RM is in focusing on revenue and then using the basic techniques of RM to convert market uncertainty to probability, and probability to revenue gain. For example, the airline industry has invested millions of dollars in sophisticated revenue management systems that have brought hundreds of millions of dollars in benefits. RM enables the airlines to sell the right service to the right customer, at the right time for the right price, to achieve the highest amount of revenue possible. Today all major US
Maritime Policy & ManagementISSN 0308–8839 print/ISSN 1464–5254 online#2004 Taylor & Francis Ltd
http://www.tandf.co.uk/journals DOI: 10.1080/0308883032000209553
airlines utilize RM systems, and airlines around the world also practice revenue management or are actively exploring these techniques for their companies.
To build RM systems for the liner shipping companies, a conceptual model for liner shipping revenue management (LSRM) is proposed. A slot allocation model is formulated through mathematical programming to maximize freight contribution. We illustrate this model with a case study of a Taiwan liner shipping company and the results show the applicability and better performances than the previous alloca-tion used in practice.
This paper proceeds as follows. Section 2 reviews some related research on revenue management for transportation industries. Section 3 presents some major cost problems of the liner shipping industry and a model of LSRM is developed. Section 4 formulates a containership slot allocation model through mathematical programming. A case study and discussions are in Section 5, followed by concluding remarks.
2. Related studies
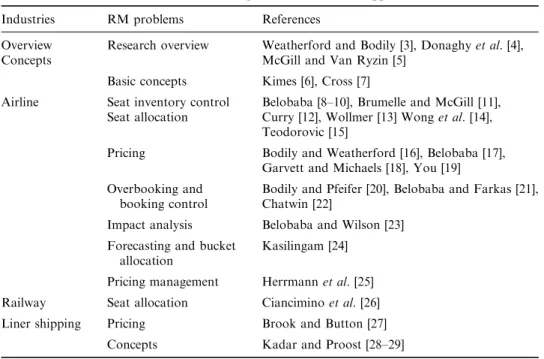
Related RM research and a list of transportation industries in which it is applied are shown in table 1. In transportation industries, space or capacity is the most perish-able inventory. When freight carriers depart from service places at certain timing, there will be no revenue from unused space. There are several common character-istics in transportation industries that are necessary for successfully using revenue management: perishability, fixed capacity, high capacity variable costs, demand and market segmentation, advance sales and bookings, stochastic demand, historical sales data, and forecasting capabilities [2]. These characteristics are also found in liner shipping operations. While previously used as a powerful tool for
transporta-Table 1. Revenue management research and applications.
Industries RM problems References
Overview Concepts
Research overview Weatherford and Bodily [3], Donaghyet al.[4],
McGill and Van Ryzin [5]
Basic concepts Kimes [6], Cross [7]
Airline Seat inventory control
Seat allocation
Belobaba [8–10], Brumelle and McGill [11], Curry [12], Wollmer [13] Wonget al. [14], Teodorovic [15]
Pricing Bodily and Weatherford [16], Belobaba [17],
Garvett and Michaels [18], You [19] Overbooking and
booking control
Bodily and Pfeifer [20], Belobaba and Farkas [21], Chatwin [22]
Impact analysis Belobaba and Wilson [23]
Forecasting and bucket allocation
Kasilingam [24]
Pricing management Herrmannet al. [25]
Railway Seat allocation Cianciminoet al. [26]
Liner shipping Pricing Brook and Button [27]
tion service operations, there is considerable potential to utilize revenue management for the liner shipping industry.
Most RM research has dealt with airline revenue management because the airlines have the longest history of developing and implementing RM systems. RM research for airlines focuses on three main areas: seat inventory control, pricing and over-booking or over-booking control (see table 1). In the shipping industry, Brook and Button [27] explore factors influencing the rates charged by liner shipping firms. Kadar and Proost [28–29] introduce RM systems to the liner shipping industry to overcome the fiercely competitive market environment. In light of the above literature and interviewing the persons who are in charge of slot allocation and pricing at liner companies in Taiwan, compared to the airline yield management, most liner companies are still using RM systems that are far from comprehensive, dynamic, computerized and integrated. Therefore, a lot of room is left for improving liner shipping revenue management and utilizing RM techniques to refine their operation.
3. Liner shipping revenue management (LSRM)
In this section, some major problems of the liner shipping industry are analysed and a conceptual LSRM model is proposed.
3.1. Major problems of the liner shipping industry
Viewing this industry overall, some major problems regarding cost and revenue issues are summarized as follows:
3.1.1. Cost-reduction and freight rate competition. The business of this industry is now entirely cost-reduction, which in turn depends upon generating supply. Increasing the vessel capacity supply helps carriers’ lower ceilings by forcing down per-unit costs. The problem is that to attract more cargo, individual carriers must provide additional capacity. So it is hardly surprising that many trades are plagued with overcapacity, fierce competition and low rates. The result is a vicious circle: cutting costs; increasing space supply; building bigger ships; creating over-capacity; competing by reducing freight rates; suffering from low rates; cutting costs. This vicious circle speeds up because of (a) undifferentiated services; (b) fuzzy brand recognition; (c) low switching costs and weak loyalty; and (d) break-up of conferences.
3.1.2. Wrong marketing and pricing strategy. Kadar and Proost [28] tracked the ships allocated to the nine main routes and calculated TEU miles deployed. The results show that between 1990 and 1995 average capacity utilization was fairly stable at about 75%, with fluctuations in seasonal demand producing peak utilization figures near 80%. Actual effective capacity utilization was higher at 85% 89%, when some additional factors are taken into account. This indicates the main problem of this industry, capacity utilization better than other industries but carriers still struggle with low-return operations.
Agents, persons in charge of pricing and sales representatives lower the prices on the spot market, and to attract needed cargo tonnage every time demand goes down in a market. Many liner companies focus on short-term performance improvement by trying to control load factors. An increase in capacity utilization is usually viewed
as a remedy for declining yields. A downward spiral of lower and lower yields is triggered by lowering prices to generate more demand.
Clearly, pricing and revenue are directly linked: revenue equals pricelifts, which means that price determines revenue. Assuming that we are acting in a very simple market model, there are principally two ways to react in the market: either we change the price and cope with the reaction in terms of more or less demand by adjusting the capacity availability; or we influence the capacity availability and have to assess the necessary reaction in terms of prices. Most carriers simply use the low-rate policy to assure space utilization. This resulted in the space supply increase and lower rates.
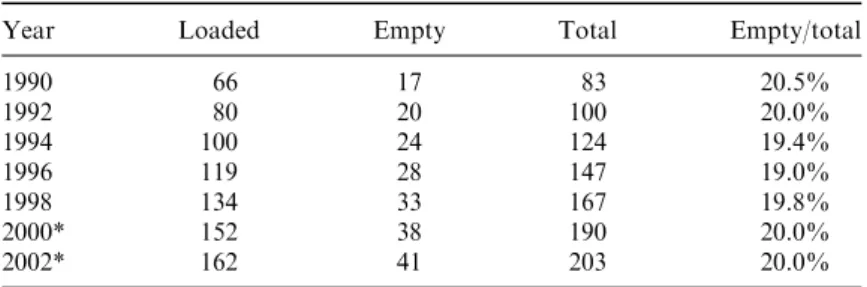
3.1.3. Empty container repositioning problems. Repositioning empty containers is costly for liner carriers, and recent increases in container flow imbalances in the main trades, especially the transpacific and Asia/Europe trades, have highlighted this problem. A detailed analysis of the world container flow (see table 2) shows a continuously worsening situation. Storing and repositioning such massive and increasing volumes of empty containers is growing more costly, and the need for empty repositioning remains one of the container carriers’ biggest problems. The problems not only result in losing revenue opportunities and increasing container handling and storage costs, but bring some negative effects on marketing strategies, e.g. low rates, container one-way free use, that erode revenue even further.
3.2. Components and functions of LSRM
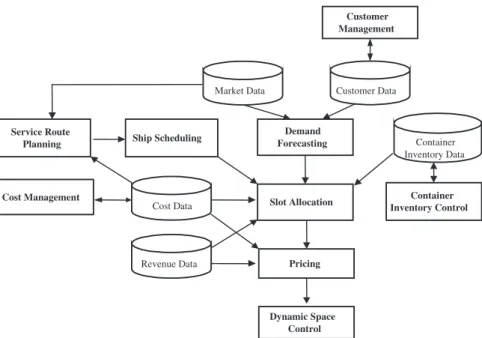
Liner carriers require dramatic changes in operational practices to face this tough and fluctuating market. To provide them with a good solution to build RM systems, a conceptual LSRM model is proposed. The LSRM is concerned with the integrated operation of long-term customer management, cost management, route planning and ship scheduling, as well as short-term cargo demand forecasting, container inventory control, slot allocation, pricing and dynamic space control.
An LSRM system is shown in figure 1. There are two major components: (a) long-term planning, which can assist with longer long-term customer management, cost management, market monitoring, service route planning and ship scheduling; and (b) short-term operations, which can assist with voyage revenue optimization in terms of demand forecasting, slot allocation, pricing, container inventory control and dynamic space control. Ideally, such a system should be integrated with freight revenue, cost, container inventory database and accounting systems.
Table 2. World container movements (in million TEUs).
Year Loaded Empty Total Empty/total
1990 66 17 83 20.5% 1992 80 20 100 20.0% 1994 100 24 124 19.4% 1996 119 28 147 19.0% 1998 134 33 167 19.8% 2000* 152 38 190 20.0% 2002* 162 41 203 20.0% Source: [30] Notes: *¼estimates.
Computerized liner shipping operations frequently have a critical start on RM implementation because its computerized information can be incorporated into the RM system to provide decision support information regarding market, customer, container inventory, cost and revenue. A complete LSRM system would provide operational functions as follows in the following section.
3.2.1. Long-term planning
(1) Customer management. A customer database records the customers’ basic data, booking data, cargo distribution and volume. This provides the information necessary to maintain service contracts and to forecast demand.
(2) Cost management. There must be a powerful database recording every item of costs including fixed and variable costs. Variable costs, in particular, should be tracked with detailed records of every shipment including truck, feeder and railway costs, container handling costs, terminal and depot stow-age costs, commission, tally costs and cargo claim costs. The variable costs of all service point pairs are needed to accurately calculate the freight’s marginal contribution.
(3) Service route planning and ship scheduling. This function provides the deci-sion support to plan new service routes and to modify or integrate the current service network so that the company can maximize the shipment potential. To choose the calling ports and rotation, market information is required, including global/regional economic and trade development, as well as container flow between port pairs. Meanwhile, the personnel in charge of operation or planning can deploy the fleet by the terminal/berth windows and maintain punctuality of schedule.
Pricing Demand Forecasting Container Inventory Control Slot Allocation Dynamic Space Control Customer Management Cost Management Service Route
Planning Ship Scheduling
Market Data Customer Data
Cost Data
Revenue Data
Container Inventory Data
3.2.2. Short-term operations
(1) Demand forecasting. By using the data on market, customers and historical booking, this subsystem can provide estimates of advance sales and report exceptions for each demand segment to decision-makers.
(2) Container inventory control. In this subsystem, there is a container inventory database, which records and provides all the locations and numbers of con-tainers, both owned and leased. It provides support for making right deci-sions to handle container reposition, on-hire and off-hire, so as to provide customers with the containers they need and to reduce container handling and storage costs.
(3) Slot allocation. Slot allocation is the process of determining the space to be allocated to different legs, markets and customers on a given voyage based on their demand, cargo marginal contribution, container inventory and prof-itability. This subsystem supports right decisions of slot allocation to maxi-mize freight contribution.
(4) Pricing. Based on information regarding costs, local market sales, demand pattern (e.g. distribution, time, volume, delivery condition), this subsystem provides tactical pricing decision support to make the space sell at the right price, to the right customer and at the right loading port, as well as to maximize the contribution and utilization of the vessel capacity.
(5) Dynamic space control. When a voyage is starting, the space usage is dynamic, and there should be differences from pre-allocation. This sub-system provides functions to monitor the booking and lifting situation, dynamically re-allocating space to prevent unused space.
4. Optimal containership slot allocation model
To build and solve a model optimizing space utilization, which covers the decisions of all the components of LSRM systems, fully utilizes historical data to forecast cargo demand, and dynamically adjusts its pricing and allocation decisions with the evolving booking data is out of the question. Most airlines and researchers approach revenue management for the first step by dealing with seat allocation problem flight by flight. In this paper, the slot allocation problem is chosen to be the first approach to build the LSRM systems. RM concepts and mathematical programming techniques are applied to formulate an optimal containership slot allocation model. The other components are left for further research and being integrated with the proposed slot allocation model.
4.1. Problem description and assumptions
Most liner carriers usually allocate the available space according to the agents’ space requests and cargo demands, with less consideration being given to marginal con-tribution, storage and repositioning costs for empty containers caused by trade imbalances, cargo weight and values. Therefore, available space cannot be effectively allocated to maximize the freight contribution.
Even for a single voyage leg, the slot allocation problem is very complex. On the same voyage, there is much different cargo demand with various origin– destination (O–D) legs each of which generates a different amount of
contribu-tion. For major liner carriers practicing hub-port operations, every voyage to the hub-port can have containers destined to almost all of its side ports and inland points; every voyage from the hub-port can have containers departing from almost all of its side ports and inland points. In addition, every O–D leg has several different freight rates. Therefore, there can be hundreds of rate/O–D combinations for each voyage, each having its contribution to the carrier. The essential factor in determining the slot allocation is cargo demand. Cargo demand is not deterministic but its trend is reflected in past records, so it can be estimated for the current voyage.
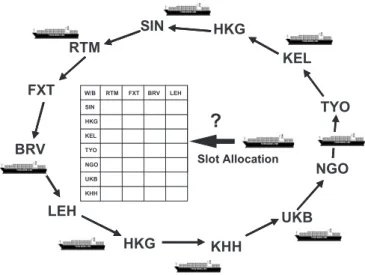
Figure 2 shows a Far East–Europe route rotation, calling at Singapore (SIN), Hongkong (HKG), Keelung (KEL), Tokyo (TYO), Nagoya (NGO), Kobe (UKB) and Kaohsiung (KHH) in Asia, as well as Rotterdam (RTM), Felixstowe (FXT), Bremerhaven (BRV) and Le Havre (LEH) in Europe. The company deployed eight full-container vessels on this service route to provided weekly service for every calling port. The slot allocation problem is how do carriers allocate the available vessel space (i.e. slots) to every origin (i.e. loading port) to destination (i.e. discharging port) pair leg efficiently and effectively to maximize the total freight contribution from the whole voyage. This model deals with the slot allocation problem voyage by voyage.
The following assumptions are imposed for the model:
(1) The average freight rates of each origin–destination port pair have been estimated.
(2) The average variable cost of each origin–destination port pair has been accurately estimated.
(3) The minimum/maximum cargo demand of each origin–destination port pair has been estimated.
(4) There are four major types of containers (i.e. 20’ dry container, 20’ reefer container, 40’ dry container and 40’ reefer container).
(5) The inter-port cargo demand will not be taken into account.
RTM BRV FXT LEH HKG UKB KHH SIN HKG KEL TYO NGO KEL TYO NGO HKG SIN UKB KHH Slot Allocation W/B RTM FXT BRV LEH
?
4.2. Model formulation 4.2.1. Notation
Indices
i¼Index of loading port,i¼1, 2,. . .,m. j¼Index of discharging port,j¼1, 2,. . .,n.
k¼Index of container type, k¼1 for 20’ dry container; k¼2 for 20’ reefer container;k¼3 for 40’ dry container;k¼4 for 40’ reefer container.
f¼Index of slots for loaded containers. e¼Index of slots for empty containers. Decision variables
xfi jk¼Slot allocating number of k-type loaded containers shipped from loading portito discharging portj.
xeijk¼Slot allocating number ofk-type empty containers shipped from loading port ito discharging portj.
Parameters
MCijk¼Marginal contribution of each k-type container delivered from loading portito discharging portj.
MCi jk ¼FRi jkVCi jk ð1Þ
FRi j k¼Freight revenue of eachk-type container delivered from loading portito discharging portj.
VCi j k¼Variable costs of each k-type container delivered from loading portito discharging port j, the variable costs include truck, feeder and railway costs, container handling costs, terminal and depot stowage costs, com-mission, tally costs and cargo claim costs.
ECi j k¼Repositioning cost of eachk-type empty container delivered between port
i and port j, with costs including inland transport/feeder cost, handling cost and holding cost.
IFi j k¼Imbalance factors ofk-type container flow from loading portito dischar-ging portj. IFi j k¼ ðFi jkFj ikÞ=Fi jk if Fi jk >Fj ik, 0 if Fi jk Fj ik: ð2Þ
Fi j k¼Thek-type container flow from loading portito discharging portjduring a period of time.
CP¼The operational capacity of the vessel (unit: TEU, twenty-foot equivalent units).
DW¼The deadweight tonnage of the vessel (unit: ton).
Wi jkf ¼The average total weight (tons) of eachk-type loaded container delivered from loading port ito discharging portj.
Wke¼The tare weight (tons) of eachk-type empty container. RF¼The maximun reefer plug number of the vessel.
FE¼The maximun number of 40’ containers loaded by the vessel.
DLi j k¼The minimun contractedk-type slot number of the agent at portito portj. DUi j k¼The maximumk-type slot number of cargo demand at portito portj. CIj k¼The repositioning demand ofk-type containers to be supplied portj.
4.2.2. Objective function. The objective function of the model is to maximize the total freight contribution (freight revenue minus variable cost) from the shippment. This is represented in equation (3).
MaxZ¼X m i¼1 Xn j¼1 X4 k¼1 ðMCi jk IFi jkECi jkÞxi jkf ECi jkxei jk ð3Þ 4.2.3. Constraints
(a)Vessel capacity constraints
There are two major restrictions on the vessel capacity, one represented in equation (4) so that all the allocated slots for loaded and empty containers cannot exceed the vessel operational capacity; and the other represented in equation (5) so that the total weight of loaded and empty containers cannot exceed the vessel deadweight tonnage. Xm i¼1 Xn j¼1 X2 k¼1 ðxfi jkþxei jkÞ þ2X m i¼1 Xn j¼1 X4 k¼3 ðxfi jkþxei jkÞ CP ð4Þ Xm i¼1 Xn j¼1 X4 k¼1 ðWi jkf xfi jk þWkexei jkÞ DW ð5Þ
(b)Vessel specification constraints
There are two major restrictions on the vessel specification, one represented in equation (6) so that all the slots for loaded reefer containers cannot exceed the number of the vessel equipped reefer plugs; and the other represented in equation (7) so that the total slots of 40’ loaded and empty containers cannot exceed the designed 40’ container space of the vessel.
Xm i¼1 Xn j¼1 X k¼2, 4 xi jkf RF ð6Þ Xm i¼1 Xn j¼1 X k¼3, 4 ðxi jkf þxei jkÞ FE ð7Þ
(c)Cargo demand constraints
As the minimum contract volume with agents and pre-booking accounts, and maxi-mum cargo demand, the slots allocated to each O–D leg must be set between the interval of lower bound and upper bound of cargo demand. These are represented in equations (8) and (9).
xi jkf DLi jk for alli,jandk: ð8Þ xi jkf DUi jk for alli,jandk: ð9Þ
(d)Repositioning container demand constraints
Represented as equation (10), the total slots for loading empty containers must be greater than the repositioning demand ofktype containers to be supplied portj.
Xm i¼1
xei jk CIj k for alljandk: ð10Þ
(e)Variable integer constraints
The final constraint is integrality restrictions on the decision variables, as represented in equation (11).
xfi jk,xei jk integer for all i,j andk: ð11Þ
5. Case study and discussions
An Asia–Europe service route of a liner company in Taiwan (see figure 2) is used as a case study. The company deployed eight full-container vessels on this service route to provided weekly service for every calling port. The specification of the vessels is 3,350 TEU operational capacity, 36,510 ton deadweight, equipped with 200 reefer plugs and 1,135 40’ maximum container slots. Cost, revenue and container inventory databases were imported to calculate the needed related model parameter data, freight revenue, variable costs, repositioning costs, container flow, repositioning demand and container inventory. The optimization software LINGO 6.0 is utilized to solve the model. For designing user-friendly input and output interfaces with LINGO 6.0, the indices of the model is reduced from three dimensions to two dimensions to import/export data from a MicrosoftÕExcel file and make allocation results understood easily by the persons in charge.
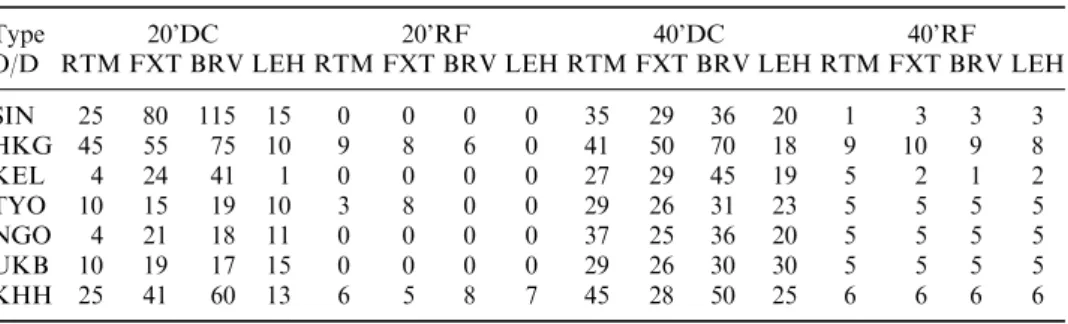
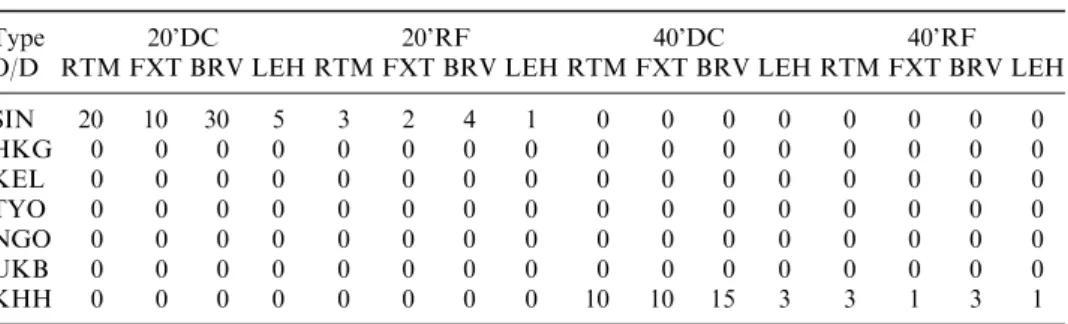
The optimal slot allocation of one westbound voyage is shown as table 3 and table 4. Table 3 shows slot allocation for carrying loaded containers, which can assist persons who control vessel space allocation to achieve the maximum freight con-tribution by allocating space more effectively and efficiently. Table 4 shows slot allocation for repositioning empty containers, which can provide persons who con-trol container inventory with the best decision support for minimum repositioning expenses.
Table 5 summarizes further relevant information to compare with past lifting and revenue data. The allocated number of four types of containers is aggregated in this table. As can be seen in table 5, the optimal slot allocation is quite different from those of the previous O–D allocation pattern. These differences are made due to our considering two factors simultaneously (i.e. unit marginal contribution and possible repositioning costs) to be included in the objective function, instead of solely considering unit revenue or unit marginal contribution. In addition to
Table 3. Slot allocation table (for loaded containers).
Type 20’DC 20’RF 40’DC 40’RF
O/D RTM FXT BRV LEH RTM FXT BRV LEH RTM FXT BRV LEH RTM FXT BRV LEH
SIN 25 80 115 15 0 0 0 0 35 29 36 20 1 3 3 3 HKG 45 55 75 10 9 8 6 0 41 50 70 18 9 10 9 8 KEL 4 24 41 1 0 0 0 0 27 29 45 19 5 2 1 2 TYO 10 15 19 10 3 8 0 0 29 26 31 23 5 5 5 5 NGO 4 21 18 11 0 0 0 0 37 25 36 20 5 5 5 5 UKB 10 19 17 15 0 0 0 0 29 26 30 30 5 5 5 5 KHH 25 41 60 13 6 5 8 7 45 28 50 25 6 6 6 6
differences between the allocation patterns, total amount of expected revenue, 3,808,661 USD derived from the model is greater than the past average revenue, 3,648,991 USD by 159,670 USD. Moreover, total amount of expected contribution, 2,779,040 USD (total marginal contribution minus total repositioning costs) derived from the model is greater than the past average contribution, 2,420,110 USD by 358,930 USD. The average unit marginal contribution minus repositioning costs (see R2 column in table 5) derived from the model is much greater than past allocation’s. Results show the model’s applicability and excellent performances in practice.
The total numbers of slot allocation are 2,956 TEUs for loaded containers and 167 TEUs for empty containers respectively, and expected space utilization is 93.2% (3,123 TEUs divided by the vessel’s operational capacity 3,350 TEUs), that represents the vessel space is not fully utilized. The expected deadweight utilization is almost 100%, which means the vessel capacity utilization is ‘down but not full’. To improve this situation, the marketing strategy to attract more lower weight cargo is proposed, e.g. offering preferable freight rates to the accounts which shipped more lower weight cargo. In this westbound voyage case, it should be noted that the above situation (‘‘down but not full’’) occurs in peak seasons or trades and it is assumed that there is enough demand to fill all the slots allocated to all legs. During slack seasons or trades, liner shipping companies may choose to leave some empty on some legs of the voyage in order to keep them available for more profitable legs or chartering out to other carriers and forwarders.
Table 5. Optimal slot allocation compared with past lifting.
Optimal slot allocation Past lifting
O/D RTM FXT BRV LEH Total R1 R2 RTM FXT BRV LEH Total R1 R2
SIN 97 144 193 61 495 1,081 811 101 157 143 51 452 1,111 750 HKG 154 183 239 62 638 1,312 863 110 183 198 54 545 1,302 810 KEL 68 86 133 43 330 1,207 905 100 95 112 95 402 1,277 830 TYO 81 85 91 66 323 1,502 1,051 78 77 91 66 312 1,478 1,040 NGO 88 81 100 61 330 1,256 939 70 70 80 40 260 1,277 874 UKB 78 81 87 85 331 1,473 1,124 50 60 70 75 255 1,481 1,003 KHH 133 114 180 82 509 1,279 996 155 140 172 90 557 1,352 895
Notes:R1 stands for average unit revenue (unit: USD per TEU),
R2 stands for average unit marginal contribution minus repositioning costs (unit: USD per TEU). Table 4. Slot allocation table (for empty containers).
Type 20’DC 20’RF 40’DC 40’RF
O/D RTM FXT BRV LEH RTM FXT BRV LEH RTM FXT BRV LEH RTM FXT BRV LEH
SIN 20 10 30 5 3 2 4 1 0 0 0 0 0 0 0 0 HKG 0 0 0 0 0 0 0 0 0 0 0 0 0 0 0 0 KEL 0 0 0 0 0 0 0 0 0 0 0 0 0 0 0 0 TYO 0 0 0 0 0 0 0 0 0 0 0 0 0 0 0 0 NGO 0 0 0 0 0 0 0 0 0 0 0 0 0 0 0 0 UKB 0 0 0 0 0 0 0 0 0 0 0 0 0 0 0 0 KHH 0 0 0 0 0 0 0 0 10 10 15 3 3 1 3 1
The results of sensitivity analysis show that IFi j k (imbalance factors) are relatively sensitive parameters because they affect empty container repositioning costs and real marginal contribution of loaded slot allocation. When deadweight tonnage of the vessel is not sufficient to load all containers, the parameters, Wi jkf (loaded container weight) are sensitive and result in a new optimal solution that allocates less slots to load heavier containers. This means the aim of fully utilizing capacity and high contribution can be improved by attracting more lower weight cargo demand.
6. Conclusions
In this paper, related research on revenue management for transportation industries is reviewed. A conceptual model of LSRM is proposed to provide carriers with reference solutions to build their RM systems. An optimal slot allocation model was formulated. The objective of the proposed slot allocation model is to maximize the total freight contribution instead of freight revenue, due to high variable costs in the liner shipping. We consider the possibility of a continuous worsening situa-tion of trade imbalances, so reposisitua-tioning costs should be included in the objective function.
The optimal slot allocation can be a guideline for distributing space to every calling port to achieve the most expected contribution, however, the persons in charge should keep watching space usage and adjust allocation to avoid unused space. According to the above discussions, cargo weight is the crucial factor to achieve better capacity utilization.
The concepts of the LSRM model and slot allocation model have been presented to the liner company and the results show the model’s applicability and excellent performances in practice. However, its implementation still needs a lot work, for example, to integrating with the related databases and pricing, as well as container inventory and dynamic slot control. In addition, computerization frequently has a critical start on LSRM implementation because computerized information can be incorporated into the RM systems to provide decision support information regard-ing markets, customers, container inventory, costs and revenue.
Liner shipping revenue management (LSRM) is an excellent research area with a high potential for developing new models and procedures to improve revenue, and provide decision support to liner shipping companies. Long-term service route planning and ship scheduling, as well as short-term pricing and dynamic space control problems provide the greatest opportunities in terms of future research. References
1. Cross, R. G., 1998, Trends in airline revenue management. In: Handbook of Airline Marketing, edited by G. F. Butler, M. R. Keller (New York: McGraw-Hill), pp. 303–318. 2. Kimes, S. E., 1989, The basics of yield management. Cornell Hotel and Restaurant
Administration Quarterly,30, 14–19.
3. Weatherford, L. R. and Bodily, S. E., 1992, A taxonomy and research overview of
perishable-asset revenue management: yield management, overbooking, and pricing.
Operations Research,40, 831–844.
4. Donaghy, K., McMahon, U. and McDowell, D., 1995, Yield management: an
over-view.International Journal of Hospitality Management,14, 139–150.
5. McGill, J. I. and VanRyzin, G. J., 1999, Revenue management: research overview
and prospects.Transportation Science33(2), 233–256. 6. Ibid. 2.
8. Belobaba, P. P., 1987, Airline yield management: an overview of seat inventory control. Transportation Science,21, 63–73.
9. Belobaba, P. P., 1989, Application of a probabilistic decision model to airline seat
inventory control.Operations Research,37, 183–197.
10. Belobaba, P. P., 1998, The evolution of airline yield management: fare class to
origin-destination seat inventory control. In: Handbook of Airline Marketing, edited by G. F. Butler and M. R. Keller (New York: McGraw-Hill), pp. 285–302.
11. Brumelle, S. L. and McGill, J. I., 1990, Allocation of airline seats between
stochas-tically dependent demand.Transportation Science,24, 183–192.
12. Curry, R., 1990, Optimal seat allocation with fare classes nested by origins and
destina-tions.Transportation Science,24, 193–204.
13. Wollmer, R. D., 1992, An airline seat management model for a single leg route when
lower fare classes book first.Operations Research,40, 26–37.
14. Wong, J. T., Koppelman, F. S. and Daskin, M. S., 1993, Flexible assignment approach
to itinerary seat allocation.Transportation Research,27B, 33–48.
15. Teodorovic, D., 1998, Airline network seat inventory control: a fuzzy set theory
approach.Transportation Planning and Technology,22, 47–72.
16. Bodily, S. and Weatherford, L., 1995, Perishable-asset revenue management: generic
and multiple-price yield management with diversion.Omega,23, 173–185.
17. Belobaba, P. P., 1998, Airline differential for effective yield management. In:Handbook of Airline Marketing, edited by G. F. Butler and M. R. Keller (New York: McGraw-Hill), pp. 349–361.
18. Garvett, D. and Michaels, L., 1998, Pricing parrying: a direction for quick, decisive,
and profit-maximizing pricing. In:Handbook of Airline Marketing, edited by G. F. Butler and M. R. Keller (New York: McGraw-Hill), pp. 333–348.
19. You, P. S., 1999, Dynamic pricing in airline seat management for flights with multiple
flight legs.Transportation Science,33, 192–206.
20. Bodily, S. and Pfeifer, P. E., 1992, Overbooking decision rules.Omega,20, 129–133.
21. Belobaba, P. P. and Farkas, A., 1999, Yield management impacts on airline spill
estimation.Transportation Science,33, 217–232.
22. Chatwin, R. E., 1999, Continuous-time airline overbooking with time-dependent fares
and refunds.Transportation Science,33, 182–191.
23. Belobaba, P. P. and Wilson, J. L., 1997, Impacts of yield management in competitive
airline markets.Journal of Air Transport Management,3, 3–9.
24. Kasilingam, R. G., 1996, Air cargo revenue management: characteristics and
complex-ities.European Journal of Operational Research,96, 36–44.
25. Herrmann, N., Muller, M. and Crux, A., 1998, Pricing and revenue management
can reshape your competitive position in today’s air cargo business. In:Handbook of Airline Marketing, edited by G. F. Butler, M. R. Keller (New York: McGraw-Hill), pp. 387–410.
26. Ciancimino, A., Inzerillo, G., Lucidi, S. and Palagi, L., 1999, A mathematical
programming approach for the solution of the railway yield management problem.
Transportation Science,33, 168–181.
27. Brook, M. R. and Button, K. J., 1996, The determinants of shipping rates: a north
Atlantic case study.Transport Logistics,1, 21–30.
28. Kadar, M. H. and Proost, D. D., 1997, Supply and demand in liner shipping. Containerisation International,30, 61–65.
29. Kadar, M. H. and Proost, D. D., 1997, Back to the basics for marketing, pricing and
selling.Containerisation International,30, 49–51.
30. Containerisation International Yearbook 1999, Business Communications Ltd, London, 1999.