UNF Digital Commons
UNF Graduate Theses and Dissertations Student Scholarship
2017
Performance Evaluation of Hadoop based Big Data
Applications with HiBench Benchmarking tool on
IaaS Cloud Platforms
Karthika Muthiah Ms.
This Master's Thesis is brought to you for free and open access by the Student Scholarship at UNF Digital Commons. It has been accepted for
Suggested Citation
Muthiah, Karthika Ms., "Performance Evaluation of Hadoop based Big Data Applications with HiBench Benchmarking tool on IaaS Cloud Platforms" (2017).UNF Graduate Theses and Dissertations. 771.
PERFORMANCE EVALUATION OF HADOOP BASED BIG DATA APPLICATIONS WITH HIBENCH BENCHMARKING TOOL ON IAAS CLOUD PLATFORMS
by
Karthika Muthiah
A thesis submitted to the School of Computing
in partial fulfillment of the requirements for the degree of
Master of Science in Computer and Information Sciences
UNIVERSITY OF NORTH FLORIDA SCHOOL OF COMPUTING
Copyright © 2017 by Karthika Muthiah
All rights reserved. Reproduction in whole or in part in any form requires the prior written permission of Karthika Muthiah or designated representative.
The thesis "Performance Evaluation of Hadoop Based Big Data Applications with HiBench Benchmarking Tool on IaaS Cloud Platforms” submitted by Karthika Muthiah in partial fulfillment of the requirements for the degree of Master of Science in Computer and Information Sciences has been
Approved by the thesis committee: Date
___________________________________ __________________ Dr. Sanjay P. Ahuja
Thesis Advisor and Committee Chairperson
___________________________________ __________________ Dr. Zornitza Prodanoff
___________________________________ __________________ Dr. Swapnoneel Roy
Accepted for the School of Computing:
___________________________________ __________________ Dr. Sherif Elfayoumy
Director of the School
Accepted for the College of Computing, Engineering, and Construction:
___________________________________ __________________ Dr. Mark A. Tumeo
Dean of the College Accepted for the University:
___________________________________ __________________ Dr. John Kantner
ACKNOWLEDGEMENT
I would like to take this opportunity to express my deepest gratitude to the people who supported me throughout the duration of this thesis. This thesis would not have been possible without the direction and support of my thesis advisor Dr. Sanjay P. Ahuja. I would also like to thank my committee members, Dr. Zornitza Prodanoff and Dr.
Swapnoneel Roy. I would also like to thank Dr. Sherif Elfayoumy, Dr. Mark Tumeo, Dr. William F. Klostermeyer and Mr. Jim Littleton for their feedback and valuable
suggestions.
Finally, I would like to thank my parents and my family members for their continuous support and encouragement during the process of achieving this important milestone. This thesis provided me a great learning experience about new and upcoming
CONTENTS
List of Figures ... ixx
List of Tables ... xii
Abstract ... xiii
Chapter 1: Introduction ... 1
-1.1 Cloud Platforms ... 3
1.1.1 Amazon Elastic Compute Cloud (Amazon EC2) ... 3
1.1.2 Microsoft Azure ... 5
1.2 Big Data Computation ... 7
1.2.1 Hadoop ... 7 1.2.2 MapReduce ... 9 1.3 Benchmarks ... 11 1.3.1 HiBench Benchmarks ... 11 1.3.1.1 Micro Benchmarks ... 12 1.3.1.2 SQL Benchmarks ... 13
1.3.1.3 Web Search Benchmarks ... 14
1.3.1.4 Machine Learning Benchmarks ... 14
Chapter 2: Literature Review ... 18
2.1 Studies using Big Data Benchmarks ... 18
2.2 Studies on performance analysis in Cloud Computing ... 20
2.3 Studies on EC2 services using open source benchmarks ... 21
Chapter 3: Research Methodology ... 23
Chapter 4: Testbed Setup ... 26
4.1 Creating Instance on Amazon EC2 Cloud Platform ... 26
4.2 Creating Instance on Microsoft Azure Cloud Platform ... 27
4.3 Hadoop setup ... 27
4.3.1 Prerequisites ... 28
4.3.2 Hadoop Installation ... 28
4.3.3 Creating cluster setup in Hadoop ... 28
4.4 HiBench Setup ... 30
4.4.1 HiBench Prerequisite ... 31
4.4.2 HiBench Installation ... 31
Chapter 5: Hardware and Software Specifications ... 32
5.1 Software Specifications ... 32
5.2 Hardware Specifications ... 32
Chapter 6: Results and Analysis ... 34
6.1 Micro Benchmarks ... 35
6.1.2 EC2 and Azure Performance for Sort ... 38
6.1.3 EC2 and Azure Performance for TeraSort ... 41
6.2 SQL Benchmarks ... 43
6.2.1 EC2 and Azure Performance for Aggregation ... 43
6.2.2 EC2 and Azure Performance for Join ... 46
6.2.3 EC2 and Azure Performance for Scan ... 50
6.3 Web Search Benchmarks ... 53
6.3.1 EC2 and Azure Performance for PageRank ... 53
6.4 Machine Learning Benchmarks ... 56
6.4.1 EC2 and Azure Performance for Bayesian Classification ... 56
6.4.2 EC2 and Azure Performance for K-Means Clustering ... 59
Chapter 7: Conclusions ... 62
7.1 Benchmark Results ... 62
7.2 Pricing Models ... 65
7.3 Future Research ... 66
References ... 68
Appendix A: Create Instance on Amazon EC2 ... 71
Appendix B: Create Instance on Microsoft Azure ... 76
Appendix C: Hadoop Prerequisites ... 81
Appendix D: Hadoop Installation and Configuration ... 84
Appendix F: HiBench Prerequisites ... 94
Appendix G: HiBench Benchmark Installation, Configuration and Execution ... 96
Appendix H: Amazon EC2 Screenshot ... 99
Appendix I: Microsoft Azure Screenshot ... 100
FIGURES
Figure 1: AWS EC2 Structure ... 4
Figure 2: Microsoft Azure Structure ... 6
Figure 3: Hadoop YARN Architecture ... 9
Figure 4: Hadoop MapReduce Architecture ... 11
Figure 5: Overview of multi-node cluster ... 30
Figure 6: WordCount - EC2 vs. Azure (1 GB) ... 36
Figure 7: WordCount – EC2 vs. Azure (100 GB) ... 36
Figure 8: WordCount – EC2 vs. Azure (1,000 GB) ... 37
Figure 9: Sort – EC2 vs. Azure (1 GB) ... 39
Figure 10: Sort – EC2 vs. Azure (100 GB) ... 39
Figure 11: Sort – EC2 vs. Azure (1,000 GB) ... 40
Figure 12: TeraSort – EC2 vs. Azure (1 GB) ... 42
Figure 13: TeraSort – EC2 vs. Azure (100 GB) ... 42
Figure 14: TeraSort – EC2 vs. Azure (1,000 GB) ... 43
Figure 15: Aggregation – EC2 vs. Azure (120,000 Pages) ... 45
Figure 16: Aggregation – EC2 vs. Azure (1,200,000 Pages) ... 45
Figure 17: Aggregation – EC2 vs. Azure (12,000,000 Pages) ... 46
Figure 18: Join – EC2 vs. Azure (120,000 Pages) ... 48
Figure 19: Join – EC2 vs. Azure (1,200,000 Pages) ... 48
Figure 21: Scan – EC2 vs. Azure (120,000 Pages) ... 51
Figure 22: Scan – EC2 vs. Azure (1,200,000 Pages) ... 51
Figure 23: Scan – EC2 vs. Azure (12,000,000 Pages) ... 52
Figure 24: PageRank – EC2 vs. Azure (500,000 Pages) ... 54
Figure 25: PageRank – EC2 vs. Azure (1,000,000 Pages) ... 54
Figure 26: PageRank – EC2 vs. Azure (10,000,000 Pages) ... 55
Figure 27: Bayes – EC2 vs. Azure (100,000 Pages) ... 57
Figure 28: Bayes – EC2 vs. Azure (500,000 Pages) ... 57
Figure 29: Bayes – EC2 vs. Azure (1,000,000 Pages) ... 58
Figure 30: K-Means – EC2 vs. Azure (20,000,000 Samples) ... 60
Figure 31: K-Means – EC2 vs. Azure (80,000,000 Samples) ... 60
Figure 32: K-Means – EC2 vs. Azure (100,000,000 Samples) ... 61
TABLES
Table 1: HiBench Benchmark and Metrics ... 16
Table 2:Amazon EC2 and Microsoft Azure Hardware Configuration ... 33
Table 3: WordCount: Response Time - EC2 vs. Azure ... 35
Table 4: WordCount: Throughput – EC2 vs. Azure ... 35
Table 5: Sort: Response Time – EC2 vs. Azure ... 38
Table 6: Sort: Throughput – EC2 vs. Azure ... 38
Table 7: TeraSort: Response Time – EC2 vs. Azure ... 41
Table 8: TeraSort: Throughput – EC2 vs. Azure ... - 41 -41 Table 9: Aggregation: Response Time – EC2 vs. Azure ... 44
Table 10: Aggregation: Throughput – EC2 vs. Azure ... 44
Table 11: Join: Response Time – EC2 vs. Azure ... 47
Table 12: Join: Throughput – EC2 vs. Azure ... 47
Table 13: Scan: Response Time – EC2 vs. Azure ... 50
Table 14: Scan: Throughput – EC2 vs. Azure ... 50
Table 15: PageRank: Response Time – EC2 vs. Azure ... 53
Table 16: PageRank: Throughput – EC2 vs. Azure ... 53
Table 17: Bayes: Response Time – EC2 vs. Azure ... 56
Table 18: Bayes: Throughput – EC2 vs. Azure ... 56
Table 19: K-Means: Response Time – EC2 vs. Azure ... 59
ABSTRACT
Cloud computing is a computing paradigm where large numbers of devices are connected through networks that provide a dynamically scalable infrastructure for applications, data and storage. Currently, many businesses, from small scale to big companies and
industries, are changing their operations to utilize cloud services because cloud platforms could increase company’s growth through process efficiency and reduction in
information technology spending [Coles16]. Companies are relying on cloud platforms like Amazon Web Services, Google Compute Engine, and Microsoft Azure, etc., for their business development.
Due to the emergence of new technologies, devices, and communications, the amount of data produced is growing rapidly every day. Big data is a collection of large dataset, typically hundreds of gigabytes, terabytes or petabytes. Big data storage and the analytics of this huge volume of data are a great challenge for companies and new businesses to handle, which is a primary focus of this paper.
This research was conducted on Amazon’s Elastic Compute Cloud (EC2) and Microsoft Azure platforms using the HiBench Hadoop Big Data Benchmark suite [HiBench16]. Processing huge volumes of data is a tedious task that is normally handled through traditional database servers. In contrast, Hadoop is a powerful framework is used to handle applications with big data requirements efficiently by using the MapReduce
algorithm to run them on systems with many commodity hardware nodes. Hadoop’s distributed file system facilitates rapid storage and data transfer rates of big data among the nodes and remains operational even when a node failure has occurred in a cluster. HiBench is a big data benchmarking tool that is used for evaluating the performance of big data applications whose data are handled and controlled by the Hadoop framework cluster. Hadoop cluster environment was enabled and evaluated on two cloud platforms.
A quantitative comparisonwas performed on Amazon EC2 and Microsoft Azure along
with a study of their pricing models. Measures are suggested for future studies and research.
Chapter 1 INTRODUCTION
According to the National Institute of Standards and Technology (NIST), Cloud Computing can be defined as “A model for enabling convenient, on-demand network access to a shared pool of configurable computing resources that can be rapidly provisioned and released with minimal management effort or service provider
interaction” [Mell11]. The chief characteristics and features of cloud computing include [Mell11]:
1. On-Demand and self-service, where consumers can automatically provision the computing capabilities like server time and network storage without consumers interaction.
2. Broad network access, where the computing capabilities are available over the network to the users and can be accessed via heterogeneous client platforms i.e., workstations, servers, laptops, mobiles, and tablets.
3. Resource Pooling, where computing resources are shared to serve many users with ease, and supports multi-tenancy within which different physical and virtual resources are dynamically allocated/de-allocated according to user demand.
4. Rapid Elasticity, where the allocation of computing resources should be elastic and change quickly as per user needs.
5. Measured Service, where cloud systems automatically optimize the resources usage by leveraging metering capability based on computing services offered such as storage, processing active users, bandwidth, etc. Transparency exists between providers and consumers as users can monitor, control and report to the providers about resource usage.
There are three service models provided on the cloud [Mell11]:
1. Infrastructure-as–a-Service(IaaS),where providers offer virtualized computing resources over the Internet as a service to the users. The service uses virtualized resources including virtual machines, storage, servers, network, load balancers, etc. In this model, only the infrastructure is available to users.
2. Platform-as-a-Service(PaaS), where providers offer the environment, i.e., hardware and software tools necessary for application development, as a service to the users. The environment includes operating systems, program runtime environment, database, web servers, etc. In this model, the infrastructure and platform are available to users. 3. Software-as–a-Service(SaaS), where providers offer the software application as a service to the users. Examples of software include salesforce.com, Gmail, Enterprise Resource Planning (ERP), etc. In this model, the infrastructure, platform, and application software are available to users [Mell11].
1.1Cloud Platforms
1.1.1 Amazon Elastic Compute Cloud (Amazon EC2)
Amazon Elastic Compute Cloud (Amazon EC2) is a web service offered by Amazon Web Service (AWS), which is an Infrastructure as a Service cloud platform. Amazon EC2 offers a scalable computing capacity, allows launching as many virtual servers as possible, and enables the configuration of security, networks, and storage. Each of these can be scaled up or down in the cloud as per customer needs. Amazon EC2 has pre-configured templates of instances called Amazon Machine Images (AMIs) that can be used to create new instances which contain the necessary components for a server, such as the operating system and other software. Secured access to instances is provided with the help of key pairs. The newly launched Amazon EC2 instances using AMI are created from an Amazon EBS (Elastic Block Store) snapshot, and the instance’s data are
permanently stored in an Amazon EBS volume. The basic structure of Amazon Web Service EC2 instance is shown in Figure 1.
Amazon EC2 offers various purchasing options for instances including: (i) On-Demand Instances, which allow consumers to pay hourly, based on their usage with no long-term commitments or upfront payments for the instances; (ii) Reserved Instances, which allow consumers to get a discounted price and lower hourly rates for the instance if they pay an upfront one-time payment and reserve it for one or three year terms; and (iii) Spot
maximum price they can afford for the instance. The spot price will never go beyond the maximum bid price and changes are based on demand and available supply of resources.
Some of the benefits of using Amazon EC2 services include the general agreement that these services are easy to use and allow application providers and vendors to quickly and securely host their applications [EC216]. They are flexible and enable the selection of an application platform, programming language, operating system, database, and services as needed. They are also cost-effective, as payment is processed on a per use basis, and provide reliable, scalable, and secured global computing infrastructure [EC216].
1.1.2 Microsoft Azure
Microsoft Azure offers a group of integrated cloud services that includes analytics, computing, database, mobile, networking, storage, and web services. Microsoft Azure supports the widest selection of options for operating systems, programming languages, tools, frameworks, databases, and devices [Azure16]. Microsoft Azure supports Windows server, Linux, SQL Server, Oracle and IBM software, and SAP applications. It provides a variety of storage services for different types of data, based on business needs. The storage elements include objects, files, tables, queues, and disks. Microsoft Azure offers network file shares in the cloud by using Server Message Block (SMB) protocol. Table storage is used for NoSQL data. For unstructured types of data, object or blob storage is used. Queue storage is used to store messages efficiently and securely, while premium storage that stores the data on the Solid State Drives (SSDs) is preferred for I/O intensive workloads like high performance and low latency blocks. Figure 2 shows the basic structure of Microsoft Azure’s virtual network system along with its load balancing and secured access capability provided to its remote users.
Features like integrated tools, pre-built templates and additional managed services that are available as options make the process of building and managing the enterprise, web, mobile, and Internet of Things applications much easier. Some of the benefits of using Microsoft Azure cloud include [Azure16]:
• Azure cloud is highly scalable which can provision up to petabyte (1024
• data can be accessed globally as the storage exists in more than one region,
• storage of data is automatically replicated and maintained as multiple copies so
they are highly available and durable even when any unexpected hardware failure occurs.
Microsoft Azure is secure as it offers typical authentication mechanisms, client and server-side data-at-rest encryption, and limits the access rights [AzureStorage17]. Users pay only for the resources consumed. It also supports the execution of enterprise
applications [Azure16].
1.2 Big Data Computation
Big Data applications involve the processing and storing of large volumes, typically hundreds of gigabytes, terabytes or petabytes of data and has become critical for cloud providers to provide on-demand computing instances and capacity for such big data storage and computation [BigData16]. The cloud platforms such as Amazon EC2 and Microsoft Azure can support these demands when Hadoop cluster of nodes with master-slave architecture is enabled in the cloud instances. Hadoop’s MapReduce algorithm has become the leading programming model for computation of big data applications in cloud computing.
1.2.1 Hadoop
Hadoopis an open source software framework that enables distributed storage and
processing of large data sets across clusters of commodity servers, and is a possible solution to big data storage and computation problems. Hadoop is designed to scale up from a single server to thousands of servers and hence can concurrently process large amounts of data to provide faster results. Hadoop runs applications in which data are processed concurrently using the MapReduce algorithm on different CPU nodes. The Hadoop framework is proficient in the development of applications running on clusters of computers that support a master–slave architecture where the master node controls and manages slave nodes [Hadoop16]. Figure 3 shows the Hadoop YARN (Yet Another Resource Negotiator) architecture, which is responsible for providing computational
resources (e.g. CPU, memory, etc.) needed for applications execution. The Resource Manager is the ultimate authority that arbitrates resources among all the applications in the system. The Node Manager is associated with per-machine is responsible for containers, monitoring their resource usage and reporting it to the resource manager [YARN16].
The Hadoop framework includes the following modules [Hadoop16]:
• Hadoop Common –libraries and other utilities files required to function by other
Hadoop modules.
• Hadoop Distributed File System (HDFS) – a distributed file system that stores data on
cluster machines that provide enormous aggregate bandwidth.
• Hadoop YARN – a platform responsible for managing compute and scheduling
resources among all applications running in a Hadoop cluster system.
• Hadoop MapReduce – a programming model used for processing of large dataset
concurrently.
The following are the benefits of using Hadoop in cloud platforms [Hadoop16]:
• Scalability – It can add servers to, and remove from, the cluster during run time as per need, so Hadoop continues to function without interruption.
• Open Source – Hadoop is an open source software developed using Java language
which is platform independent.
• Fault Tolerant – Hadoop libraries are designed to sense and handle failures and do not
• Highly Efficient – It is a highly efficient distributed system that distributes data and tasks automatically across machines.
Figure 3: Hadoop YARN Architecture [YARN16]
1.2.2 MapReduce
MapReduce is a job that splits the input dataset into independent chunks that are
processed by the map tasks in a parallel manner. The sorted outputs of the maps are fed as input to the reduce tasks. Both the input and output of the MapReduce job are stored in a file system. In the MapReduce file system, the large files are fragmented into smaller blocks of identical size and distributed across the cluster for storage. Each block is stored multiple times in different nodes in order to handle failures in the cluster. The
Shuffle phase, which is followed by the Reduce phase. The diagrammatic representation of the MapReduce architecture is shown Figure 4.
In Map phase, the map function is applied to all input, and mappers are launched on all cluster nodes. The blocks of input file data stored in the nodes are processed in parallel. A mapper processes the contents in the block, interpreting each line as a key-value pair. The map function invoked for each of the input pairs creates a subjectively large list with new key-value pairs created from the input pairs.
map(key, value) -> List (key’, values’)
During the Shuffle phase, the list of key-value pairs created from the Map phase are sorted by their keys locally and assigned to the Reducer according to their keys. The keys that are similar in the key-value pairs are assigned to the matching reducer.
In the Reduce phase, all key-value pairs with the identical key are combined and a sorted list of the values is created. The reduce function is applied on a key and the sorted list of input values gets compressed. It creates a shorter list of values, i.e., the values are
aggregated. The reduce function creates a subjectively large list of key-value pairs similar to the map function.
reduce(key, List(values)) -> List(key’, value’)
Figure 4: Hadoop MapReduce Architecture [Hornung16]
1.3 Benchmarks
1.3.1 HiBench Benchmarks
HiBench is a more realistic and wide-ranging benchmark suite for the Hadoop
framework, which is one of the most common implementations of the MapReduce model. The HiBench suite comprises of a set of Hadoop programs that includes both synthetic micro benchmarks and real-world Hadoop applications characteristic of a broader range of large scale data analysis. These benchmarks are used to intensively evaluate big data based Hadoop applications in terms of speed and throughput [HiBench16].
The categories of benchmarks considered for this research study include Micro
benchmarks (WordCount, Sort, and TeraSort) that include more unstructured data, and SQL benchmarks (Aggregation, Join, and Scan) that include structured types of data, Web Search benchmarks (PageRank) that include more semi-structured data, and
Machine Learning benchmarks (Bayes and K-Means) that include data of semi-structured or unstructured type [Huang12].
1.3.1.1 Micro Benchmarks
1) WordCount: This benchmark program reads the input text file and counts how
many times each word occurs. These programs are characteristic of a large subset of real-world MapReduce jobs in which a small amount of useful data are
extracted from a large dataset. The input data for this workload are generated by executing the preparation script which uses the RandomTextWriter program of the Hadoop distribution. This job abstracts a small quantity of information from a large data source. This process is CPU-bound [Huang12].
2) Sort: This benchmark function sorts the input text file by key. These programs are
characteristic of a large subset of real-world MapReduce jobs in which data are transformed from one form to another. The input data for this workload are generated by executing the preparation script which uses the RandomTextWriter program of the Hadoop distribution. This RandomTextWriter uses map or reduce to run a distributed job where there is no interaction between tasks, and each task writes an unsorted large sequence of words. The output of map phase key-value pairs is shuffled and then sorted based on key and again gets reduced based on the key. The sorting of the data is automatically done during the Shuffle and Merge stage of the MapReduce model. This process is I/O-bound [Huang12].
3) TeraSort: This benchmark function also sorts the input text file by key, like the Sort benchmark, but it provides an improved sort where an equal load is
distributed among all nodes through the process. The input data for this workload are generated by executing the preparation script which creates 10 billion 100-byte records by default, using the TeraGen program of the Hadoop distribution. TeraGen uses map or reduce to produce data. It splits the desired number of rows by the desired number of tasks and assigns ranges of rows to each map. The map runs the random number generator to correct the value for the first row and generates the subsequent rows. Here, TeraSort samples the input data and uses map or reduce to sort the data into a total order. Hence this process is CPU-bound during the Map stage and I/O-bound during Reduce stage [Huang12].
1.3.1.2 SQL Benchmarks
1) Hive Aggregation, Hive Join, and Hive Scan:The Hive performance benchmarks
characterize an important use of MapReduce in On-Line Analytical Processing (OLAP) queries [Hive17]. These benchmarks are intended to model complex analytical queries over structured tables. Hive Aggregation computes the total of each group over a single read-only table, whereas Hive Join computes both the average and total of each group by joining 2 different tables. Hive Scan performs a scan of the tables. The input of this workload is automatically generated web data having hyperlinks that follow Zipfian distribution [ZipFian17]. The data source is created by executing the preparation script that creates 2 tables:
UserVisits and UserRankings tables. After the data source has been created, hive requests perform a Scan, a Join and an Aggregation. These tests are I/O-bound [Huang12].
1.3.1.3 Web Search Benchmarks
1) PageRank:These programs are characteristic of one of the most important uses of
MapReduce in large-scale search indexing systems. This workload is an implementation of the PageRank algorithm, a link analysis algorithm which is widely used in web search engines. It calculates the rank i.e., a numerical weight of web pages, based on the number of reference links. This workload comprises of series of Hadoop jobs, in which several jobs are iterated until the coverage condition is satisfied. The Wikipedia page-to-page link database was used as the input data of this workload. The data source is created from web based data whose hyperlinks follow Zipfian distribution [ZipFian17]. This process is CPU-bound [Huang12].
1.3.1.4 Machine Learning Benchmarks
1) Bayesian Classification:These programs characterize an important use of
MapReduce in large-scale machine learning. This workload implements Naive Bayesian, a classification algorithm for knowledge discovery and data mining [Bayes17]. This is comprised of a series of 4 Hadoop jobs: extract terms from the
input webpage text, calculate the frequency for each term, and calculate the weighting, and the normalization. The input data are taken from a subset of a Wikipedia dump file which is fragmented using WikipediaXmlSplitter, and then organized into text samples using WikipediaDatasetCreator of Mahout
[Mahout17]. These samples are spread into several files as input. This workload uses routinely generated documents containing the words that trail Zipfian distribution [ZipFian17]. The dictionary used for text creation is from the default file /usr/share/dict/linux.words in linux. This process is I/O-bound with high CPU utilization during the Map stage [Huang12].
2) K-Means Clustering:This workload implements K-Means, a very popular
clustering algorithm for knowledge discovery and data mining [KMeans17]. The input to this benchmark is a sample set, and each sample is represented as a numerical d-dimensional vector. In this workload, the centroid of each cluster is first computed by executing the Hadoop job iteratively until the number of
iterations reaches its determined limit. Then the clustering job is run, which allots each sample to a cluster. A random data generator using statistic distribution is used to produce the workload input. The input dataset is generated by
GenKMeansDataset based on Uniform and Gaussian distribution for this benchmark. This process is CPU-bound during iteration and I/O-bound during clustering [Huang12].
The categories of HiBench benchmark and metrics used are shown in Table 1.
Benchmarks Method Metrics Measured
Micro • WordCount • Sort • TeraSort • Response Time • Throughput SQL • Aggregation • Join • Scan • Response Time • Throughput
Web Search • Page Ranking • Response Time
• Throughput
Machine Learning • Bayes
• K-Means •• Response Time Throughput Table 1: HiBench Benchmark and Metrics
1.4 Research Objectives
This study compares the performance of Hadoop based big data applications on two major public cloud service providers namely, Amazon EC2 and Microsoft Azure. The number of nodes, hardware and software resources, and instance types are varied while evaluating the performance of each cloud. The research was conducted using Micro, SQL, Web Search, and Machine Learning benchmarks from the HiBench big data
benchmarking suite of Hadoop. The literature review discusses previous research work in the field of big data computation, and various benchmarks that could be used to assess the performance of big data applications. Existing performance evaluation has mostly been carried out on servers and clusters using Hadoop, but not on public clouds. It is
between Amazon EC2 cloud and Microsoft Azure IaaS public cloud services using the HiBench benchmark.
Chapter 2
LITERATURE REVIEW
Currently, there is no set of benchmarks available for assessing the performance of big data applications on cloud platforms like Amazon EC2 and Microsoft Azure. There are, however, benchmarks available for big data based applications computation but they have been executed only on servers and Hadoop cluster nodes. There do exist certain studies that assessed cloud performance in Amazon EC2 IaaS cloud platform which are
discussed below.
2.1 Studies using Big Data Benchmarks
Han et al. in ‘On Big Data Benchmarking’ discuss the vital requirements, challenges and tests in developing big data benchmarks and their execution [Han14]. These are relevant when considering the 4V (Volume, Velocity, Variety, and Veracity) properties,
generating workloads and test execution in big data systems. Methodologies like Layer design, Data generation, and Test generation are designed to address these requirements challenges. Big data benchmarks like HiBench, GridMix, PigMix, YCSB, etc., are reviewed and compared [HiBench16, GridMix13, PigMix13, YCSB10]. This paper compared existing benchmarks based that are relevant to big data generation and benchmarking.
According to the authors, big data benchmarks like HiBench, GridMix, and PigMix were developed to test the performance of MapReduce Hadoop systems. This is a software framework to process vast amounts of data in parallel. Big data systems have been developed to manage and process big data efficiently, and these have given growth to various new requirements for developing a new group of big data benchmarks.
Huang et al. in ‘The HiBench Benchmark Suite: Characterization of the MapReduce-Based Data Analysis’ discussed the most prominent map reduce model used in large-scale data analysis in cloud [Huang10]. The authors introduced a new, representative and wide-ranging benchmark suite for Hadoop called HiBench, which is comprised of set of Hadoop programs that include synthetic micro-benchmarks and real-world applications. Using HiBench, the Hadoop framework evaluates various characteristics such as, speed, throughput, bandwidth, system resource consumption, and data access patterns. The characterization of Hadoop workload using four slaves in a Hadoop cluster inferred that such workload has very heavy disk and network I/O unless the output size is small. The best performance is attained by accurately measuring the input data and properly
allocating memory buffers to prevent memory spilling in the data. The authors concluded that the HiBench Suite is essential to assess and characterize Hadoop, because the
workloads not only characterize a broad range for data analysis, but also exhibit varied performances in terms of data access patterns and resource consumption. This paper is relevant to this research because it used HiBench Benchmark Suite in its experiments to evaluate performance and the same Benchmark suite is used in this research as well.
2.2 Studies on performance analysis in Cloud Computing
Villalpando et al. in ‘Performance Analysis Model for Big Data Applications in Cloud Computing’ discuss that there are chances that some anomalies and defects may exist in cloud platforms which can affect the performance of big data applications on these platforms [Bautista14]. The paper proposed a performance analysis model for big data applications that integrates software quality concepts which fills the gap that exists between quantitative representation of quality concepts of software and the measurement of big data applications performance. The performance measurement framework for cloud computing is based on a scheme where the performance of a system is analyzed using responsiveness, productivity and utilization sub concepts. The likely outcomes that affects system performance are speed, reliability and availability. The authors concluded that performance analysis model based on measurement framework for cloud computing has been validated by researchers and practitioners and this framework defines the elements that are essential to measure the performance of software quality in cloud computing systems. MapReduce model based applications includes time behavior and resource utilization as the primary factors to be evaluated in determining the performance of cloud computing platforms. These measures are taken into account while improvising the performance of applications. This paper shows how performance analysis results are helpful in detecting the cause of degradation of applications and cloud.
Zheng et al. in ‘Real Time Big Data Processing Framework: Challenges and Solutions’ discuss the issues that exist in big data processing. In order to address processing issues
requirements in big data systems [Zheng15]. The integration of real time big data has complex requirements in data collection, data analysis, and data security aspects. The two processing modes of big data are stream and batch processing. In stream processing the data value reduces as it is real-time. In batch processing data are stored first and
processed later, either online or offline. MapReduce model is the most representative of the batch processing method. The authors concluded that real time data processing is a huge challenge as it involves massive real-time processing of a large data frame and processing compared to static data. This paper discusses batch and stream processing of big data. This research performed with the help of HiBench benchmark suite, which is a Hadoop based big data framework, that uses MapReduce model, and can process both batch and streaming workloads.
2.3 Studies on EC2 services using open source benchmarks
Hwang et al. in ‘Cloud Performance Modeling with Benchmark Evaluation of Elastic Scaling Strategies’ evaluated various service clouds, and tested the real-life benchmark programs on Infrastructure as a Service cloud platforms over scaling-out and scaling-up workloads [Hwang14]. Three scaling approaches, scale-up approach, scale-out approach, and auto-scaling approach, were evaluated based on their relative performance, and they found that scaling-out is more often practiced than scaling-up and auto-scaling
approaches. The open-source benchmarks namely: YCSB from CloudSuite, HiBench, BenchCloud at USC, and TPC-W were tested and measured for speed, throughput, HDFS bandwidth, and resource utilization metrics on the Amazon IaaS EC2 cloud [YCSB10,
HiBench16, BenchCloud14, TPC-W13]. In order to satisfy production services, it becomes important to make the choice of scale-up or scale-out solutions through the workload patterns and resources utilization costs. The workload patterns comprise of large scale data processing and data analytics, web search and service. Evaluating the experimental results, the authors concluded that higher efficiency promotes productivity. This paper suggests that big data analytics can be benchmarked to evaluate performance using metrics in different clouds. Here, the performance of one cloud platform, Amazon EC2, is evaluated using different big data benchmarks. This paper is relevant as it evaluates the performance of a public cloud provider for big data analytics.
As discussed above, there are various available benchmarks that compare the
performance of Amazon EC2 IaaS cloud service using different open source big data processing benchmarks, processing of big data is a big challenge and it becomes essential to have knowledge on performance analysis among different public IaaS cloud servicers as this massive workloads can degrade cloud performance. But, there are no studies on benchmarks that evaluate the performance of Amazon EC2 versus Microsoft Azure for big data applications using Hadoop. That is the focus of this research.
Chapter 3
RESEARCH METHODOLOGY
This study assessed the performance of two public IaaS cloud platforms, Amazon EC2 and Microsoft Azure, for big data based application analysis using Hadoop. The study used HiBench benchmark, a big data benchmarking suite, to assess the performance of big data frameworks in terms of speed and throughput for MapReduce, using the
following categories of workloads: Micro Benchmarks (WordCount, Sort, and TeraSort), SQL Benchmarks (Aggregation, Join, and Scan), Web Search benchmark (Page Rank), and Machine Learning Benchmarks (Bayesian classification, and K-Means clustering).
After the successful creation of instances in Amazon EC2 and Microsoft Azure cloud platforms, the Hadoop framework was installed in each node, and a cluster environment was configured through which the Master node was able to communicate with its slave nodes. The HiBench benchmark was also installed and configured in all nodes.
The test procedure was started by executing Micro Benchmarks, which is comprised of WordCount, Sort, and TeraSort benchmarks, on the Amazon EC2 cloud platform using different size dataset {1GB; 100GB; and 1,000GB}, and also by varying the number of nodes from 1 to 5 for each dataset. Response time and throughput metrics were measured in each test run of varying nodes and dataset size. The SQL Benchmarks, consisting of Aggregation, Join, and Scan benchmarks, were executed on Amazon EC2 cloud platform
with changing dataset of {(uservisits: 1,000,000; pages: 120,000), (uservisits:
10,000,000; pages: 1,200,000), and (uservisits: 100,000,000; pages: 12,000,000)}, and by varying the number of nodes from one to five for each of the dataset. Response time and throughput metrics were measured in each test run of various nodes and dataset sizes. The Web Search Benchmark i.e., PageRank benchmark, was executed on Amazon EC2 cloud platform for different dataset of {(pages: 500,000), (pages: 1,000,000), and (pages: 10,000,000)}, and by varying the number of nodes from one to five for each dataset. Response time and throughput metrics were measured in each test run of varying number of nodes and dataset sizes. The Machine Learning Benchmarks, that consist of Bayesian Classification and K-Means Clustering benchmarks, were run on Amazon EC2 cloud platform for different dataset of Bayes for {(pages: 500,000), (pages: 1,000,000), and (pages: 10,000,000)}, and K-Means for {(# of samples: 20,000,000; samples/file: 4,000,000), (# of samples: 80,000,000; samples/file: 6,000,000), (# of samples:
100,000,000; samples/file: 8,000,000)}, and by varying the number of nodes from one to five for each dataset. Response time and throughput metrics were measured in each test run of varying nodes and dataset sizes.
A similar test procedure was carried out on Microsoft Azure cloud platform with HiBench benchmarks. The average response time and throughput values were tabulated and a graph was plotted to evaluate the workload performance in cloud. The test run executed in both Amazon EC2 and Microsoft Azure cloud platforms using HiBench benchmark was performed for one trial. Conclusions for the experiment were derived by
relating the performance of Amazon EC2 and Microsoft Azure cloud platforms by their test results.
Chapter 4 TESTBED SETUP
4.1 Creating Instance on Amazon EC2 Cloud Platform
Amazon EC2 cloud platform allows its users to launch as many virtual instances as they need, configure security and networking, and manage storage. In order to use the service provided by Amazon EC2 cloud platform the user must first create an AWS account, and sign-into the AWS console using the account ID. The instances launched will be Amazon EBS backed instances i.e., the root volume is EBS volume and the user can select any availability zone. AWS uses public-key cryptography to protect the login information of the instances. Amazon EC2 provides a wide variety of instances types with varying combinations of CPU, memory, disk, and networking capacity, which provides flexibility in selecting the appropriate mix of resources for the applications. The instance used in this study was a storage optimized instance from the I2 – High I/O Instances family i2.2x large instance EC2 model. This model provides high storage, fast SSD-backed instance storage enhanced for very high random I/O performance, and high IOPS [EC2Type16].
A comprehensive explanation of creating instance on Amazon EC2 cloud platform and how to access the instance is presented in Appendix A.
4.2 Creating Instance on Microsoft Azure Cloud Platform
The Microsoft Azure Cloud Platform provides its users with full control over creation, configuration, and managing of virtual machines for their applications. In order to create virtual machines in Azure cloud, the user should first create an Azure account, sign-into the Azure portal, and create an Azure subscription. The users create VMs by choosing the appropriate image list, resource manager as the deployment model, authenticate VM using an SSH public key, choose VM size, storage, and network. Azure VMs can store virtual hard disks on Azure Standard Storage devices which are Hard Disk Drives (HDD) that provide high performance and low latency I/O processes for more difficult
workloads. This study used a memory optimized G3 instance type VM, which comes under standard tier VMs – G series. The G series VMs provide local storage space on Solid State Devices disks to execute very large memory and I/O processor concentrated workloads [AzureType16].
A comprehensive explanation of creating instance on Microsoft Azure cloud platform and how to access the instance is presented in Appendix B.
4.3 Hadoop setup
Hadoop is a software framework and open source for storing and computing of extremely big dataset in a distributed cluster environment. Using Hadoop, it is possible to execute applications on systems with hundreds and thousands of commodity nodes to handle
hundreds and thousands of terabytes of data. The application is broken down into fragments or blocks and can be run on any nodes in the cluster setup. Hadoop is supported in both Linux and Windows operating systems.
4.3.1 Prerequisites
There are some prerequisite software’s need to be installed before Hadoop. A
comprehensive explanation of installing these prerequisite software’s are presented in Appendix C.
4.3.2 Hadoop Installation
After the pre-requisite software is installed, then Hadoop is installed and the necessary configurations are to be done. A comprehensive explanation of installing Hadoop and making the necessary configuration changes are presented in Appendix D.
4.3.3 Creating cluster setup in Hadoop
Hadoop Cluster is installed by unpacking the software on all the nodes in the cluster. Either one or more machines in the cluster can be designated as the master node(s) in which the name node and resource manager daemons will be running. The remaining machines in the cluster are called slave nodes in which both data node and node manager will be running. To configure the Hadoop cluster, the environment in which Hadoop
daemons execute and configuration parameters of Hadoop daemons are necessary. Hadoop configuration files are located in <$HADOOP_HOME>/etc/hadoop directory.
Hadoop has 7 major configuration files that need to be configured before starting the Hadoop Cluster. $sudo vi /$HADOOP_HOME/etc/hadoop/hadoop-env.sh $sudo vi /$HADOOP_HOME/etc/hadoop/yarn-env.sh $sudo vi /$HADOOP_HOME/etc/hadoop/core-site.xml $sudo vi /$HADOOP_HOME/etc/hadoop/hdfs-site.xml $sudo vi /$HADOOP_HOME/etc/hadoop/mapred-site.xml $sudo vi /$HADOOP_HOME/etc/hadoop/yarn-site.xml $sudo vi /$HADOOP_HOME/etc/hadoop/slaves
A comprehensive explanation of the above files and their configurations that are
performed in Amazon EC2 and Microsoft Azure cloud service is presented in Appendix D.
The Hadoop framework is comprised of two main layers namely HDFS layer, which is the Hadoop Distributed File System consisting of Name node and Data nodes of the cluster and Map Reduce Layer, which is the Execution Engine consisting of Resource Manager and Node Managers of the cluster [Noll11]. The overview of multi-node cluster in Hadoop is shown in Figure 5. While starting the Hadoop cluster, the HDFS layer is started first, and then the Map Reduce layer can be started.
Figure 5: Overview of multi-node cluster [Noll11].
A complete picture on how to start and stop the Hadoop Cluster is detailed in Appendix E.
4.4 HiBench Setup
HiBench is a complete Hadoop based big data benchmark suite developed and introduced by Intel. HiBench Benchmarks are grouped as Micro Benchmarks, SQL Benchmarks, Web Search Benchmarks, and Machine Learning Benchmarks [HiBench16].
4.4.1 HiBench Prerequisite
There are some prerequisite software’s need to be installed for HiBench benchmark. A comprehensive explanation of installing these prerequisite software’s are presented in Appendix F.
4.4.2 HiBench Installation
Once the prerequisite software is installed, there is some configurations need to be setup. A comprehensive explanation of installing HiBench benchmark, making the necessary configuration changes, and thorough picture of executing a HiBench benchmark script is shown in Appendix G.
Chapter 5
HARDWARE AND SOFTWARE SPECIFICATIONS
5.1 Software Specifications
i. Linux flavor Ubuntu14.0 AMI on the workstations.
ii. Java JDK version 1.7.
iii. Python 2.6 or later on Amazon EC2 and Microsoft Azure if it is not installed by
default.
iv. Hadoop version 2.2.0 on Amazon EC2 and Microsoft Azure.
v. HiBench version 4.0 on Amazon EC2 and Microsoft Azure cloud.
vi. SSH connection configuration on all the nodes on Amazon EC2 and Microsoft
Azure for communication from name node with all its data nodes.
vii. Hadoop cluster creation on Amazon EC2 and Microsoft Azure from their
respective dashboards or portals through the web User Interface.
5.2 Hardware Specifications
Configuring hardware for big data application computation benchmarks based on Hadoop is very critical. For Amazon EC2, the I2 Storage Optimized instance type, a high I/O instance was chosen. This specification of I2 instance type was found to very closely resemble the G Series Memory Optimized G3 instance type that had been chosen for
Microsoft Azure. The Amazon I2 instance type features high frequency Intel Xeon E5-2670 v2 (Ivy Bridge) processors which help by providing very fast SSD-backed instance storage that is optimized for very high random I/O performance, and provides high IOPS for low cost. The Azure G3 instance type features the Intel Xeon processor E5 v3 family which helps to provide incomparable computational performance to handle large database workloads, specifically SAP, SQL Server, and Hadoop. Specifications for the instances are provided in Table 2.
Hardware Configuration
Amazon EC2 Microsoft Azure
Instance Type i2.2xlarge G3
Processor Intel Xeon E5-2670 v2 2.5 GHz Intel Xeon E5 v3
Memory 61GB 112GB
Storage Drives 1600 GB (2 * 800 GB SSD) 1536 GB
I/O Performance High / 1000 Mbps Very High / 500 Mbps
Chapter 6
RESULTS AND ANALYSIS
The study assessed and compared the performance of Amazon EC2 and Microsoft Azure cloud platforms using the big data based HiBench benchmark suite, which includes the groups: Micro Benchmarks (Sort, WordCount, TeraSort), SQL Benchmarks
(Aggregation, Join, Scan), Web Search Benchmark (Page Rank), and Machine Learning Benchmarks (Bayes and K-Means).
For each benchmark, the response time value is in seconds and the throughput value is in megabytes per sec, as measured by incrementing the number of nodes by one from one to five. Graphs for Amazon EC2 and Microsoft Azure cloud platforms were plotted to relate their performance. By changing the dataset size (1GB, 100GB, and 1,000GB) to
represent big data applications computation using Hadoop, and by using each benchmark grouped in the HiBench benchmark suite, which includes Micro Benchmarks (Sort, WordCount, TeraSort), SQL Benchmarks (Aggregation, Join, Scan), Web Search Benchmark (Page Rank), and Machine Learning Benchmarks (Bayes, K-Means), the resulting graphs were used to compare the performance of Amazon EC2 and Microsoft Azure cloud platforms. In each of the graphs, the x-axis denotes the number of nodes tested, and the y-axis denotes either the response time value measured in seconds, or throughput value measured in unit megabytes per seconds which were obtained during the tests. The tests were executed for one trial.
6.1 Micro Benchmarks
6.1.1 EC2 and Azure Performance for WordCount
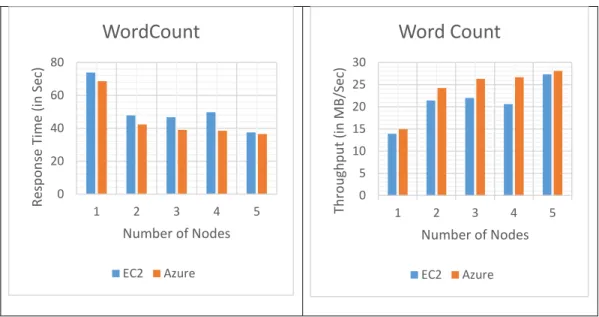
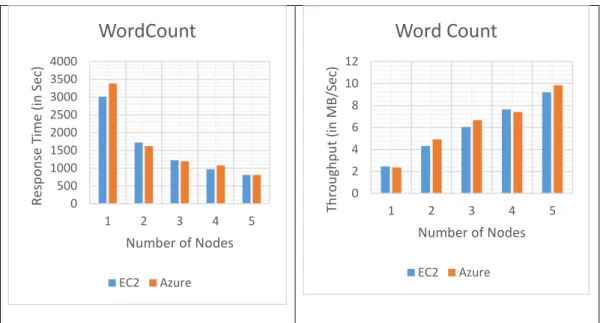
Tables 3 and 4 show the tabulated response time and throughput performance values. Figures 6, 7, and 8 present the graphs plotted for response time and throughput for WordCount benchmark, with varied nodes and data sizes on Amazon EC2 and Microsoft Azure cloud platforms respectively.
Data Size 1 GB 100 GB 1,000 GB
#Nodes EC2 Azure EC2 Azure EC2 Azure
1 73.857 68.605 294.892 231.708 3,016.376 3,384.274 2 47.862 42.336 197.763 101.938 1,724.454 1,622.662 3 46.678 39.036 90.083 80.793 1,225.565 1,194.508 4 49.81 38.494 75.963 109.529 968.444 1,074.223 5 37.57 36.544 77.794 61.689 805.737 809.162
Table 3: WordCount: Response Time - EC2 vs. Azure
Data
Size 1 GB 100 GB 1,000 GB
#Nodes EC2 Azure EC2 Azure EC2 Azure
1 13,898,957 14,963,013 14,951,001 19,027,962 2,458,881 2,353,937 2 21,447,752 24,247,449 22,294,045 43,250,980 4,301,018 4,909,444 3 21,991,727 26,296,800 48,942,960 54,570,933 6,051,829 6,669,215 4 20,609,073 26,667,440 58,040,250 40,253,705 7,656,992 7,415,952 5 27,323,432 28,090,250 56,674,772 71,470,783 9,205,298 9,845,391
Figure 6: WordCount - EC2 vs. Azure (1GB)
Figure 7: WordCount – EC2 vs. Azure (100GB)
0 20 40 60 80 1 2 3 4 5 Re sp o n se T im e (in Se c) Number of Nodes
WordCount
EC2 Azure 0 5 10 15 20 25 30 1 2 3 4 5 Th ro u gh p u t (in MB/S ec) Number of NodesWord Count
EC2 Azure 0 50 100 150 200 250 300 350 1 2 3 4 5 Re sp o n se T im e (in Se c) Number of NodesWordCount
EC2 Azure 0 20 40 60 80 1 2 3 4 5 Th ro u gh p u t (in MB/S ec) Number of NodesWord Count
EC2 AzureFigure 8: WordCount – EC2 vs. Azure (1,000GB)
Test results from Tables 3 and 4 showing one trial execution values indicate that Microsoft Azure performed better than the Amazon EC2 cloud platform for 1GB data size as the Azure cloud showed better values than EC2. When data sizes were increased to 100GB and 1,000GB Amazon EC2 and Microsoft Azure platforms were found to have similar performance.
Using the graphical results shown in Figures 6, 7, and 8, it can be concluded that
Microsoft Azure performed better than Amazon EC2 cloud platform for the smaller data size of 1GB. For larger data sizes of 100GB or 1,000GB, the performance of Amazon EC2 and Microsoft Azure cloud platforms was about the same.
0 500 1000 1500 2000 2500 3000 3500 4000 1 2 3 4 5 Re sp o n se T im e (in Se c) Number of Nodes
WordCount
EC2 Azure 0 2 4 6 8 10 12 1 2 3 4 5 Th ro u gh p u t (in MB/S ec) Number of NodesWord Count
EC2 Azure6.1.2 EC2 and Azure Performance for Sort
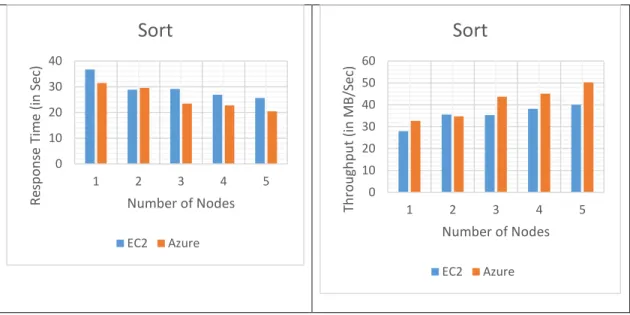
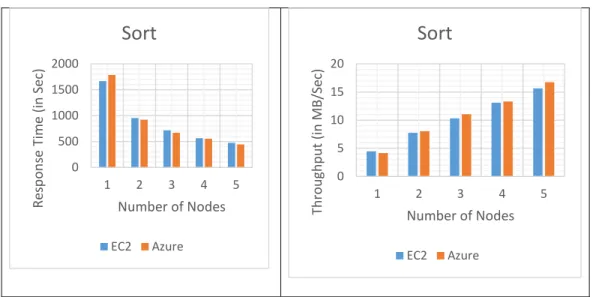
Tables 5 and 6 show the tabulated performance values for response time and throughput, and Figures 9, 10, and 11 present the graphs plotted for response time and throughput for the Sort benchmark, with varied nodes and data sizes on Amazon EC2 and Microsoft Azure cloud platforms respectively.
Sort – Response Time
Data Size 1 GB 100 GB 1,000 GB
#Nodes EC2 Azure EC2 Azure EC2 Azure
1 36.687 31.481 146.569 117.8 1,665.656 1,785.362 2 28.856 29.573 103.115 67.939 956.111 921.965 3 29.122 23.478 84.009 39.498 719.021 670.769 4 26.908 22.756 81.968 36.532 565.557 556.199 5 25.644 20.453 55.139 36.915 473.28 442.98
Table 5: Sort: Response Time – EC2 vs. Azure
Sort – Throughput Data
Size 1 GB 100 GB 1,000 GB
#Nodes EC2 Azure EC2 Azure EC2 Azure
1 27,980,892 32,608,106 30,081,035 37,427,237 4,452,885 4,154,276 2 35,574,221 34,711,711 42,757,426 64,895,510 7,757,444 8,044,648 3 35,249,531 43,723,330 52,481,786 111,624,526 10,315,373 11,057,312 4 38,149,744 45,110,982 53,788,463 120,687,349 13,114,467 13,335,103 5 40,030,594 50,189,927 79,960,734 119,434,593 15,671,166 16,743,290
Figure 9: Sort – EC2 vs. Azure (1GB)
Figure 10: Sort – EC2 vs. Azure (100GB)
0 10 20 30 40 1 2 3 4 5 Re sp on se T im e (i n Se c) Number of Nodes
Sort
EC2 Azure 0 10 20 30 40 50 60 1 2 3 4 5 Th ro u gh p u t (in MB/S ec) Number of NodesSort
EC2 Azure 0 50 100 150 200 1 2 3 4 5 Re sp o n se T im e (in Se c) Number of NodesSort
EC2 Azure 0 20 40 60 80 100 120 140 1 2 3 4 5 Th ro u gh p u t (in MB/S ec) Number of NodesSort
EC2 AzureFigure 11: Sort – EC2 vs. Azure (1,000GB)
Test results from Tables 5 and 6 indicate that Microsoft Azure performed better than Amazon EC2 cloud platform for the data sizes of 1GB and 100GB. When data size was increased to 1,000GB, Amazon EC2 and Microsoft Azure cloud platform were found to have similar performance.
The graphical results shown in Figures 9, 10, and 11, illustrate that Microsoft Azure performed better than Amazon EC2 cloud platform for data sizes 1GB, and 100GB, as Azure cloud showed better values than EC2. When the data size was increased to 1,000GB, the difference in performance between Microsoft Azure and Amazon EC2 cloud platform was about the same
0 500 1000 1500 2000 1 2 3 4 5 Re sp on se T im e (i n Se c) Number of Nodes
Sort
EC2 Azure 0 5 10 15 20 1 2 3 4 5 Th ro u gh p u t (in MB/S ec) Number of NodesSort
EC2 Azure6.1.3 EC2 and Azure Performance for TeraSort
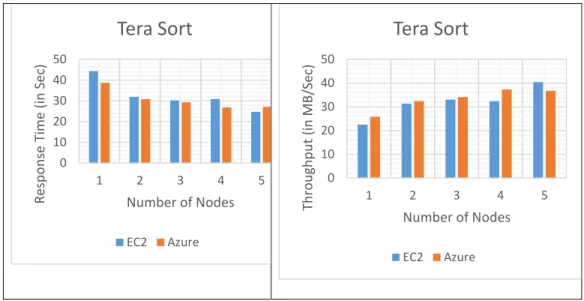
Tables 7 and 8 show the tabulated performance values for response time and throughput, and Figures 12, 13, and 14 present the graphs plotted for response time and throughput for the TeraSort benchmark, with varied nodes and data sizes on Amazon EC2 and Microsoft Azure cloud platforms respectively.
Tera Sort – Response Time
Data Size 1 GB 100 GB 1,000 GB
#Nodes EC2 Azure EC2 Azure EC2 Azure
1 44.352 38.739 190.19 184.142 479.58 375.93 2 31.918 30.823 157.068 102.973 248.515 176.499 3 30.213 29.294 82.417 83.036 180.35 113.585 4 30.878 26.789 75.457 81.342 151.424 166.093 5 24.743 27.204 80.071 68.718 143.207 155.545
Table 7: TeraSort: Response Time – EC2 vs. Azure
Tera Sort – Throughput Data
Size 1 GB 100 GB 1,000 GB
#Nodes EC2 Azure EC2 Azure EC2 Azure
1 22,546,897 25,813,779 26,289,499 27,152,958 20,851,578 26,600,696 2 31,330,283 32,443,305 31,833,278 48,556,417 40,239,019 56,657,544 3 33,098,335 34,136,683 60,667,095 60,214,846 55,447,740 88,039,793 4 32,385,517 37,328,754 66,262,904 61,468,859 66,039,729 60,207,233 5 40,415,471 36,759,300 62,444,580 72,761,139 69,828,988 64,290,076
Figure 12: TeraSort – EC2 vs. Azure (1GB)
Figure 13: TeraSort – EC2 vs. Azure (100GB)
0 10 20 30 40 50 1 2 3 4 5 Re sp o n se T im e (in Se c) Number of Nodes
Tera Sort
EC2 Azure 0 10 20 30 40 50 1 2 3 4 5 Th ro u gh p u t (in MB/S ec) Number of NodesTera Sort
EC2 Azure 0 50 100 150 200 1 2 3 4 5 Re sp o n se T im e (in Se c) Number of NodesTera Sort
EC2 Azure 0 20 40 60 80 1 2 3 4 5 Th ro u gh p u t (in MB/S ec) Number of NodesTera Sort
EC2 AzureFigure 14: TeraSort – EC2 vs. Azure (1,000GB)
Test results shown in Tables 7 and 8 indicate that the performance of both Amazon EC2 cloud and Microsoft Azure cloud platforms for all the data sizes 1GB, 100GB and 1,000GB was found to be almost equal.
The graphical results shown in Figures 12, 13, and 14 illustrate that both Microsoft Azure and Amazon EC2 cloud platforms performed about the same for all three data sizes (1GB, 100GB, and 1,000GB).
6.2 SQL Benchmarks
6.2.1 EC2 and Azure Performance for Aggregation
Tables 9 and 10 show the tabulated performance values for response time and throughput,
0 200 400 600 1 2 3 4 5 Re sp on se T im e (i n Se c) Number of Nodes
Tera Sort
EC2 Azure 0 20 40 60 80 100 1 2 3 4 5 Th ro u gh p u t (in MB/S ec) Number of NodesTera Sort
EC2 Azurefor the aggregation benchmark, with varied nodes and data sizes on Amazon EC2 and Microsoft Azure cloud platforms respectively.
Aggregation – Response Time Data
Size Uservisits:1,000,000 Pages: 120,000 Uservisits:10,000,000 Pages: 1,200,000 Uservisits:100,000,000 Pages: 12,000,000
#Nodes EC2 Azure EC2 Azure EC2 Azure
1 47.471 38.564 104.162 64.428 402.174 449.942 2 33.335 32.888 50.135 54.298 310.544 316.869 3 32.445 34.596 45.913 40.659 225.432 186.598
4 30.868 31.85 42.538 39.147 172.801 161.46
5 30.647 31.006 41.861 41.523 171.525 121.12
Table 9: Aggregation: Response Time – EC2 vs. Azure
Aggregation – Throughput Data
Size Uservisits:1,000,000 Pages: 120,000 Uservisits:10,000,000 Pages: 1,200,000 Uservisits:100,000,000 Pages: 12,000,000
#Nodes EC2 Azure EC2 Azure EC2 Azure
1 781,957 966,619 3,575,078 5,779,898 9,166,325 8,193,185 2 1,118,245 1,133,444 7,427,691 6,858,213 11,870,968 11,634,013 3 1,148,920 1,077,486 8,110,715 9,158,791 16,352,858 19,756,148 4 1,207,616 1,170,383 8,754,226 9,512,537 21,333,544 22,832,019 5 1,216,324 1,202,241 8,895,804 8,968,217 21,492,247 30,436,408
Figure 15: Aggregation – EC2 vs. Azure (120,000 Pages)
Figure 16: Aggregation – EC2 vs. Azure (1,200,000 Pages)
0 10 20 30 40 50 1 2 3 4 5 Re sp o n se T im e (in Se c) Number of Nodes
Aggregation
EC2 Azure 0 0.5 1 1.5 1 2 3 4 5 Th ro u gh p u t (in MB/S ec) Number of NodesAggregation
EC2 Azure 0 50 100 150 1 2 3 4 5 Re sp o n se T im e (in Se c) Number of NodesAggregation
EC2 Azure 0 2 4 6 8 10 1 2 3 4 5 Th ro u gh p u t (in MB/S ec) Number of NodesAggregation
EC2 AzureFigure 17: Aggregation – EC2 vs. Azure (12,000,000 Pages)
Test results from Tables 9 and 10 indicate that both Microsoft Azure and Amazon EC2 cloud platforms performed almost equal for all the dataset (user visits: 1,000,000; pages: 120,000), (user visits: 10,000,000; pages: 1,200,000) and (user visits: 100,000,000; pages: 12,000,000).
Using the graphical results as shown in Figures 15, 16, and 17, it can be concluded that the performance of Microsoft Azure and Amazon EC2 cloud platform for dataset (user visits: 1,000,000; pages: 120,000), (user visits: 10,000,000; pages: 1,200,000), and (user visits: 100,000,000; pages: 12,000,000) was found to be the same.
6.2.2 EC2 and Azure Performance for Join
Tables 11 and 12 shows the tabulated performance values for response time and
throughput, and Figures 18, 19, and 20 present the graphs plotted for response time and
0 100 200 300 400 500 1 2 3 4 5 Re sp o n se T im e (in Se c) Number of Nodes
Aggregation
EC2 Azure 0 10 20 30 40 1 2 3 4 5 Th ro u gh p u t (in MB/S ec) Number of NodesAggregation
EC2 Azurethroughput for the Join benchmark, with varied nodes and data sizes on Amazon EC2 and Microsoft Azure cloud platforms respectively.
Join – Response Time Data
Size Uservisits:1,000,000 Pages: 120,000 Uservisits:10,000,000 Pages: 1,200,000 Uservisits:100,000,000 Pages: 12,000,000
#Nodes EC2 Azure EC2 Azure EC2 Azure
1 88.309 78.91 162.682 142.112 451.226 524.538
2 62.316 56.888 97.423 84.572 243.974 312.336
3 63.223 54.894 83.432 75.21 228.679 194.476
4 61.405 53.526 80.261 73.676 191.79 188.388
5 60.443 53.945 79.933 69.892 161.818 149.929
Table 11: Join: Response Time – EC2 vs. Azure
Join – Throughput Data
Size Uservisits:1,000,000 Pages: 120,000 Uservisits:10,000,000 Pages: 1,200,000 Uservisits:100,000,000 Pages: 12,000,000
#Nodes EC2 Azure EC2 Azure EC2 Azure
1 11,328 12,678 61,605 70,522 222,571 191,463 2 16,054 17,586 102,871 118,502 411,641 321,544 3 15,823 18,224 120,122 133,252 439,173 516,412 4 16,292 18,690 124,868 136,028 523,644 533,100 5 16,551 18,545 125,380 143,393 620,634 669,849
Figure 18: Join – EC2 vs. Azure (120,000 Pages)
Figure 19: Join – EC2 vs. Azure (1,200,000 Pages)
0 20 40 60 80 100 1 2 3 4 5 Re sp o n se T im e (in Se c) Number of Nodes
Join
EC2 Azure 0 0.005 0.01 0.015 0.02 1 2 3 4 5 Th ro u gh p u t (in MB/S ec) Number of NodesJoin
EC2 Azure 0 50 100 150 200 1 2 3 4 5 Re sp o n se T im e (in Se c) Number of NodesJoin
EC2 Azure 0 0.05 0.1 0.15 0.2 1 2 3 4 5 Th ro u gh p u t (in MB/S ec) Number of NodesJoin
EC2 AzureFigure 20: Join – EC2 vs. Azure (12,000,000 Pages)
Test results from Tables 11 and 12 indicate that Microsoft Azure performed better than Amazon EC2 cloud platform as Azure showed better values than EC2 cloud for the dataset (user visits: 1,000,000; pages: 120,000), and (user visits: 10,000,000; pages: 1,200,000). For big dataset (user visits: 100,000,000; pages: 12,000,000), the difference in performance between Amazon EC2 and Microsoft Azure in terms of both response time and throughput metric values does not show noticeable change.
Using the graphical results as shown in Figures 18, 19, and 20, it can be concluded that Microsoft Azure performed better than Amazon EC2 cloud platform, as Azure cloud shows better values than EC2 for dataset (user visits: 1,000,000; pages: 120,000) and (user visits: 10,000,000; pages: 1,200,000). When the big size dataset (user visits: 100,000,000; pages: 12,000,000) was tested the performance of Microsoft Azure and Amazon EC2 cloud was found to be same.
0 200 400 600 1 2 3 4 5 Re sp o n se T im e (in Se c) Number of Nodes
Join
EC2 Azure 0 0.2 0.4 0.6 0.8 1 2 3 4 5 Th ro u gh p u t (in MB/S ec) Number of NodesJoin
EC2 Azure6.2.3 EC2 and Azure Performance for Scan
Tables 13 and 14 show the tabulated performance values for response time and
throughput, and Figures 21, 22, and 23 present the graphs plotted for response time and throughput for the Scan benchmark, with varied nodes and data sizes on Amazon EC2 and Microsoft Azure cloud platforms respectively.
Scan – Response Time Data Size Uservisits:1,000,000
Pages: 120,000 Uservisits:10,000,000 Pages: 1,200,000 Uservisits:10,000,000 Pages: 12,000,000
#Nodes EC2 Azure EC2 Azure EC2 Azure
1 56.003 52.872 66.476 73.026 311.251 398.762 2 41.878 38.747 39.669 40.818 172.453 190.88 3 41.324 38.624 35.657 37.304 132.609 143.825
4 40.969 40.314 37.277 32.73 114.203 115.053
5 40.606 37.545 31.933 28.067 107.856 84.214 Table 13: Scan: Response Time – EC2 vs. Azure
Scan – Throughput Data
Size Uservisits:1,000,000 Pages: 120,000 Uservisits:10,000,000 Pages: 1,200,000 Uservisits:10,000,000 Pages: 12,000,000
#Nodes EC2 Azure EC2 Azure EC2 Azure
1 3,262,600 3,455,806 27,476,379 25,011,910 58,693,454 45,812,694 2 4,363,040 4,715,601 46,044,009 44,747,900 105,932,609 95,706,182 3 4,421,532 4,730,618 51,224,718 48,963,108 137,761,360 127,018,224 4 4,459,845 4,532,306 48,998,572 55,805,676 159,964,240 158,782,440 5 4,499,714 4,866,570 57,198,503 65,077,129 169,377,653 219,386,358
Figure 21: Scan – EC2 vs. Azure (120,000 Pages)
Figure 22: Scan – EC2 vs. Azure (1,200,000 Pages)
0 20 40 60 1 2 3 4 5 Re sp o n se T im e (in Se c) Number of Nodes
Scan
EC2 Azure 0 1 2 3 4 5 6 1 2 3 4 5 Th ro u gh p u t (in MB/S ec) Number of NodesScan
EC2 Azure 0 20 40 60 80 1 2 3 4 5 Th ro u gh p u t (in Byt es /Se c) Number of NodesScan
EC2 Azure 0 20 40 60 80 1 2 3 4 5 Th ro u gh p u t (in MB/S ec) Number of NodesScan
EC2 AzureFigure 23: Scan – EC2 vs. Azure (12,000,000 Pages)
Test results from Tables 13 and 14 indicate that Microsoft Azure performed better than Amazon EC2 cloud platform for the dataset (user visits: 1,000,000; pages: 120,000). For larger dataset (user visits: 10,000,000; pages: 1,200,000), and (user visits: 100,000,000; pages: 12,000,000) the performance of Amazon EC2 and Microsoft Azure cloud was equal in terms of both response time and throughput metric values.
Using the graphical results as shown in Figures 21, 22, and 23 it can be concluded that Microsoft Azure achieved better results with better response time and throughput values than Amazon EC2 cloud platform for dataset (user visits: 1,000,000; pages: 120,000). For larger dataset (user visits: 10,000,000; pages: 1,200,000), and (user visits: 100,000,000; pages: 12,000,000) the performance of Microsoft Azure and Amazon EC2 cloud was found to be the same.
0 100 200 300 400 500 1 2 3 4 5 Re sp o n se T im e (in Se c) Number of Nodes
![Figure 1: AWS EC2 Structure [EC216]](https://thumb-us.123doks.com/thumbv2/123dok_us/1357516.2681606/19.918.243.732.518.928/figure-aws-ec-structure-ec.webp)
![Figure 2: Microsoft Azure Structure [Azure16]](https://thumb-us.123doks.com/thumbv2/123dok_us/1357516.2681606/21.918.207.765.524.889/figure-microsoft-azure-structure-azure.webp)
![Figure 3: Hadoop YARN Architecture [YARN16]](https://thumb-us.123doks.com/thumbv2/123dok_us/1357516.2681606/24.918.190.785.231.618/figure-hadoop-yarn-architecture-yarn.webp)
![Figure 4: Hadoop MapReduce Architecture [Hornung16]](https://thumb-us.123doks.com/thumbv2/123dok_us/1357516.2681606/26.918.215.756.110.318/figure-hadoop-mapreduce-architecture-hornung.webp)
![Figure 5: Overview of multi-node cluster [Noll11].](https://thumb-us.123doks.com/thumbv2/123dok_us/1357516.2681606/45.918.247.726.105.441/figure-overview-of-multi-node-cluster-noll.webp)