Sharp or Smooth? Comparing the effects of
quantization vs. frame rate for streamed video
John D. McCarthy, M. Angela Sasse, Dimitrios Miras
Department of Computer Science,
University College London,
London, WC1E 6BT UK
+44 (0)20 7679 7214
{j.mccarthy, a.sasse, d.miras}@cs.ucl.ac.uk
ABSTRACT
We introduce a new methodology to evaluate the perceived quality of video with variable physical quality. The methodology is then used to assess an existing guideline - that high frame rate is more important than quantization when watching high motion video, such as sports coverage. We test this claim in two studies that examine the relationship between these physical quality metrics and perceived quality. In Study 1, 41 soccer fans viewed CIF-sized images on a desktop computer. Study 2 repeated the experiment with 37 soccer fans, viewing the same content, in QCIF size, on a palmtop device. Contrary to existing guidelines, we found that users prefer high-resolution images to high frame rate. We conclude that the rule “high motion = high frame rate” does not apply to small screens. With small screen devices, reducing quantization removes important information about the players and the ball. These findings have important implications for service providers and designers of streamed video applications.
Categories & Subject Descriptors: H.5.1[Information Interfaces and Presentation]: Multimedia Information Systems – Evaluation/methodology
General Terms: Experimentation, Human Factors
Keywords: Video streaming, Quality of Service, video frame rate, quantization factors, eye tracking
INTRODUCTION
Streamed sports material is currently one of the more popular Internet services, and it is also expected that streaming of sports content will be one of the key business areas for mobile services beyond 3G. Currently, little is known about video quality levels required for such
services. Service providers need to know the minimum levels of quality their customers find acceptable. This knowledge is required to ensure customer expectations are met, but also because service providers need to manage resources efficiently – higher quality usually means higher cost. In a mobile environment, service providers cannot increase bandwidth beyond a certain level, so priorities in terms of meeting user needs for quality need to be established. It is also important for designers of applications on mobile terminals, where higher quality not only increases cost, but also power consumption. At the same time, it is important to ensure that minimum quality levels do not have adverse effects on regular users.
Current sports services available to UK consumers offer football (soccer) clips at a high frame rate, but with reduced frame quality. As a policy, this approach is paralleled in the current thinking of system providers. A recent IBM document on Quality of Service (QOS) policies [10] states that for sports coverage “the priority for smooth video is higher than the priority for frame quality”. Yet, available evidence suggests that perceived quality of sports coverage is relatively insensitive to changes in frame rate [2,7].
We test the validity of this policy in two studies that explicitly manipulate levels of frame rate and quantization. We introduce a new methodology - adapted from classical psychophysics - to discover the functions relating physical quality to perceived quality. These graphs give service providers the knowledge needed to provide and manage a successful service. To maximize the predictive power of the results (1) we test sports content only with participants interested in this content, i.e. potential users of such a service. (2) Instead of following current practice of discrete quality steps across different clips e.g. [7], we adapt psychophysical methods and gradually increase and decrease video quality within a single clip to identify the exact level at which quality becomes acceptable or unacceptable to these users. (3) We investigate the effects of varying both frame rate (fps) and frame quality (quantization scale) on acceptability. Furthermore, whilst previous studies have collected only subjective responses,
Permission to make digital or hard copies of all or part of this work for personal or classroom use is granted without fee provided that copies are not made or distributed for profit or commercial advantage and that copies bear this notice and the full citation on the first page. To copy otherwise, or republish, to post on servers or to redistribute to lists, requires prior specific permission and/or a fee.
CHI 2004, April 24–29, 2004, Vienna, Austria. Copyright 2004 ACM 1-58113-702-8/04/0004…$5.00.
we (4) record participants’ eye movements (Study 1) to determine what aspects of the video are actually looked at. Finally, (5) we examine perception of small image sports coverage in two different contexts – desktop and palmtop devices.
BACKGROUND
Perceived quality of service (QoS)
Perceived quality is typically measured by presenting users with short (8-10 sec) clips of video content from a single camera angle. The physical quality is held constant throughout the clip and users are asked to rate perceived quality on a 5-point Likert scale. Ratings from multiple observers are combined to give a mean opinion score (MOS) for a given physical quality setting. This procedure follows recommendation BT.500-11 of the International Telecommunications Union (ITU)[11].
With streamed video, however, this methodology is problematic, as quality will typically vary over time due to network effects, buffering problems and differences in content. Consequently, other metrics have been developed and incorporated into the ITU recommendations. The single stimulus continuous quality evaluation (SSCQE)[4, 8] involves using a slider to indicate quality as a video is watched. Masry & Hemami [14] used a continuous slider to evaluate a range of CIF (352 x 288) sized content, including sports coverage. Bouch & Sasse [3] also used a slider with which the user could continuously rate quality. However , they concluded that the method is too involved for users performing a real task. Even with passive viewing, continuous operation of the slider can prove distracting. What is needed is a method to elicit continuous ratings of quality with minimal effort on the users part. In this paper we present a description and validation of such a method.
Physical quality of service
The primary physical metrics of video impacting on quality are spatial resolution, frame rate and frame quality (quantization) [6]. Spatial resolution is described by the number of pixels in each frame and frame rate by the number of frames per second (FPS). As most popular compression standards (MPEG-1,2,4, H.263) employ block-based Discrete Cosine Transform (DCT), the quantization factor (Q) of the DCT coefficients is the main determinant of frame quality. Other factors that impact on QoS include the physical size of the display and the distance between the observer and the display. But for the service provider, the primary factors over which they have control are frame rate (FPS) and frame quality (Q). For this reason we focus on these in the current study.
Service providers and acceptability
Service providers need a metric that relates physical quality to perceived quality and indicates whether a given service level is acceptable to the user. Neither MOS or SSCQE measures give clear a indication of service acceptability.
For example, is a MOS rating of 3 acceptable or unacceptable to the user? Similarly, with the SSCQE metric, does a slider setting of 70 indicate acceptable or unacceptable QOS?
To tackle this issue some researchers have used acceptability as a measure in itself. Apteker et al. [2] used a Likert scale variant of acceptability to examine changes in frame rate. Hands [9] used both acceptability and MOS ratings to evaluate QCIF video at different bit rates, but found a closer fit to the logistic function with acceptability ratings. From a service provider’s perspective, this measure is arguably more relevant as it should relate directly to a consumers willingness to pay for a given service.
Drawing on this work we present a methodology to evaluate the relationship between video acceptability and video encoding parameters. The metric we use tackles many of the drawbacks of alternative approaches in that: ♦ it is easy for users to understand,
♦ it is less disruptive to the user than other continuous techniques,
♦ it can be used with variable video quality, ♦ it is more relevant to service providers.
RELEVANT STUDIES
An examination of the available evidence does not support the premise that users have a priority for smooth video over frame quality. Rather, previous studies suggest that perceived quality of sports coverage is relatively insensitive to changes in frame rate.
Perceived quality and frame rate
Apteker et al [2] compared frame rates of 5, 10 and 15 fps for eight different types of video material one of which was sporting highlights. The video window had a resolution of 160 x 120 on a monitor run in 640 x 480 mode. Clips were rated on a 7-point scale (acceptable-unacceptable), and the results suggest that acceptability of sporting highlights is relatively insensitive to low frame rate. Ghinea & Thomas [7] report that satisfaction ratings are similar at 25 fps, 15 fps and 5 fps for CIF sized clips with dynamic content (a rugby match and action movie) – further evidence that sports content is insensitive to reductions in frame rate. Wang et al. [15] report a study that manipulated both frame rate and quantization with an 8 second American Football clip. They conclude that “quantization distortion is generally more objectionable than motion judder” and that large quantization parameters should be avoided whenever possible
These are important results that run against the intuition that sequences with lots of motion require a higher frame rate. The available evidence suggests that presenting high motion clips at low frame rate does not have a severe impact on perceived quality.
METHOD
The Method of Limits
The “Method of Limits”, proposed by Fechner [5], is used to determine detection thresholds by gradually increasing the intensity of a stimulus in discrete steps until it is just detectible. Typically the procedure is also run in reverse with a decrease in stimulus intensity until it is no longer detectible. The subject gives a binary – YES/NO response to indicate whether they can detect the stimulus.
In our variation on this paradigm, we gradually increase or decrease the quality parameters of the video in discrete steps and ask participants to indicate when they find the quality acceptable or unacceptable. When the video parameters indicate high quality, we expect all viewers to perceive quality as acceptable, when the parameters indicate low quality we expect all viewers to say that it is unacceptable. The aim is to find the critical point at which quality becomes unacceptable.
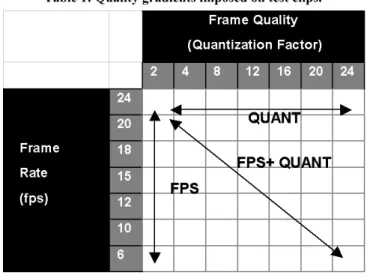
The clips we used were 210 seconds in length – much longer than those commonly used but relevant to the context of use - and quality was increased or decreased every 30 seconds. Users were not aware of this quality structure – we simply told them they would be watching films that “varied in quality”. To understand the relationship between frame rate, quantization and perceived quality we examined three different quality gradients – varying Frames Per Second (FPS), Quantization, or both FPS and Quantization (see Table 1).
Table 1: Quality gradients imposed on test clips.
Each of the three gradients was applied both increasing and decreasing over time – Thus, for each source clip, there was a total of 6 variations on the original. The seven 30-sec segments were not made explicit to participants, and they were free to say “acceptable” and “unacceptable” as many times as they wished during the 210 seconds the videos were presented.
Eye tracking
To supplement user ratings we measured where users looked using a remote eye-tracking camera. Eye tracking can identify Regions of Interest (ROI), which forms part of the specification for MPEG-4. The core scalable profile adds support for object based quality settings, in other words quality can be higher in some regions of a frame than others to encompass the fact that users require more detail for this region. With soccer, this might involve high quality coding of the players and the ball alongside low quality encoding of the pitch and players.
Source material
All video clips were 210 sec long and sourced from a DVD (PAL format) of a recent match between two famous English teams - Manchester United and Arsenal. Three source clips were constructed. (See Table 2.) All clips included a variety of camera angles and shots, including action replays, crowd shots and player/manager close-ups.
Table 2: Content of the source clips
Clip Content
A Match Intro and opening 3 minutes of play B Highlights of Manchester United chances C Highlights of Arsenal chances,
final whistle and Arsenal celebration
The source clips were reduced to CIF size (352 x 288) size
(Study 1) and QCIF (176 x 144) size (Study 2) then
deconstructed into YUV frames. These served as the input for an H.263 encoder that introduced different quality gradients. The H.263 encoder allows direct manipulation of encoding parameters – this is not possible with commercial encoders were details of the encoder are proprietary. (e.g. Realplayer, Windows Media). In order to play the encoded clips in commercial players, we employed a lossless transcoding to MPEG1/2. For Study 1, 18 films where created from the three source clips. For Study 2, 9 films were created. These variations differed in the factor(s) that was manipulated and whether the staircase gradient was increasing or decreasing (See Table 3). The audio stream was coded at 64 kb/sec. For Study 2, a 10th exploratory clip was also created to examine the critical values identified following Study 1.
STUDY 1 – VIDEO ON THE DESKTOP
Study 1 examined the psychophysics of video quality for small screen video on desktop. The video window was
352x288 (CIF) in size.
Participants
41 (29 male, 12 female, mean age 22) students from University College London participated in the study. Participants were paid £5 Sterling (approx. $8) for
participation. We recruited participants who had an interest in soccer and watched the sport regularly: 59% of participants reported watching football at least once a week, and 88% said that they supported a particular football team. More than half the participants supported one of the two teams represented in the sports clips.
Equipment
The films where presented on a flat screen LCD monitor set to a display resolution of 1024x768. The physical size of the entire screen area was 300mm x 225mm. All film clips where presented at a resolution of 352x288 using RealPlayer set to theatre mode. The physical size of the video on screen was 111mm x 84mm. Video clips were viewed from a distance of 600mm. The vertical height of the video subtended an angle of 8 degrees to the eye. Eye movements were measured using the EyeGaze system from LC technologies [13] and Open Source software (EyeSpy) to record the eye movements.
Design
Each participant was presented with six film clips. The six clips composed of the three types of quality variation, FPS (F), QUANT (Q) and FPS+QUANT (F+Q) with both increasing and decreasing gradients. The order of presentation was counterbalanced using a Greco Latin squares design, resulting in six different groups in total.
Table 3: Full design for Study 1 & 2.
F = fps Source Clip Source Clip
Q = quant A B C A B C
Decreasing Quality Increasing Quality
Group 1A F Q F+Q F Q F+Q
Group 2A Q F+Q F Q F+Q F
Group 3A F+Q F Q F+Q F Q
■ - study 2 Increasing Quality Decreasing Quality
Group 1B F Q F+Q F Q F+Q
Group 2B Q F+Q F Q F+Q F
Group 3B F+Q F Q F+Q F Q For each of the three quality variations FPS, QUANT, and FPS + QUANT the experimental design was a 2x3x2x7 mixed design. The between subject variables were “Order of Presentation” and “Film Clip”. Within subject variables were “Gradient Direction” and “Quality Level”.
Procedure
Participants were briefed about the nature of the experiment and the measures that were going to be taken. They then completed a short questionnaire to assess their interest in football and their experience with different Internet technologies.
Participants were then told that a Telecoms company was interested in findings the minimum acceptable levels of video quality. To investigate this they would be shown a number of clips from a soccer match. We asked them to indicate whether they found the quality acceptable or unacceptable when the clip first started. Subsequently we asked them to indicate verbally whether the quality became acceptable/unacceptable as they watched the clip.
Participants were calibrated to the eye tracker prior to the presentation of each film.
RESULTS
Perceived quality and frame rate
The binary acceptability ratings (1=acceptable, 0=unacceptable) were transformed to a ratio measure by calculating the proportion of time during each 30-second period that quality was rated as acceptable. For example, if a participant said unacceptable 20 seconds into a 30 second period and did not subsequently say acceptable then their quality score for that period would be 0.67. These scores were then used as the basis of an ANOVA1.
0 0.1 0.2 0.3 0.4 0.5 0.6 0.7 0.8 0.9 1 24 20 18 15 12 10 6 Frame Rate (FPS)
Proportion of Time Acceptable
Decreasing Gradient Increasing Gradient
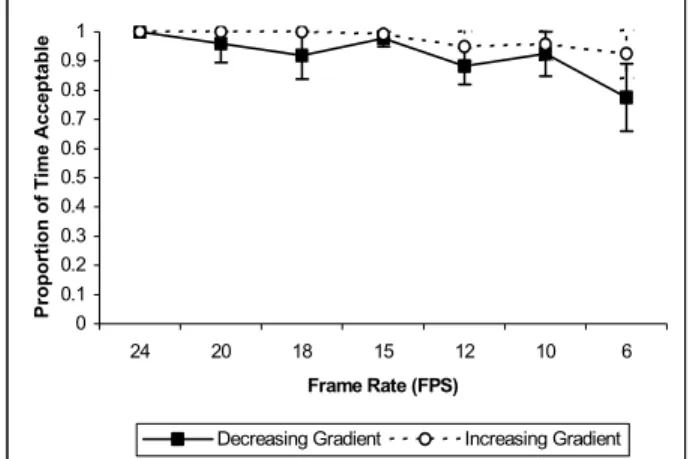
Figure 1: Relationship between frame rate and acceptability.
1 A stricter analysis is to code any participant as zero if they say unacceptable at any point during the 30-second interval. Averaged across users, this gives the proportion of who found that level acceptable all of the time.
As sphericity assumptions were violated we used the lower bound adjustment as a conservative test of significance. The ANOVA revealed a significant difference between the seven different levels of frame rate, F(1,33) = 10.058, p = 0.003. As shown in Figure 1 the proportion of time a given quality level was acceptable decreases slightly with decreasing frame rate, however even at 6 fps quality was acceptable almost 80% of the time.
The error bars show the 95% confidence intervals for the means. Interestingly there is no interaction between quality level and the quality gradient, illustrating that participants give the same ratings for a given quality level in both cases. The between-subjects factors of Film and Presentation Order were not significant.
Perceived quality and quantization
There were significant differences in acceptability between the seven levels of quantization scale [F(1,31) = 104.8, p < 0.001] and no interaction with the type of gradient. As shown in Figure 2, perceived quality is well described by a logistic relationship with the quantization scale. The between subject factors of film and presentation order were not significant. Quantization levels greater than 8 result in a sharp drop in acceptability.
0 0.1 0.2 0.3 0.4 0.5 0.6 0.7 0.8 0.9 1 2 4 8 12 16 20 24 Quantisation
Proportion of Time Acceptable
Decreasing Gradient Increasing Gradient
Figure 2: Relationship between quantization and acceptability.
Quantization and frame rate
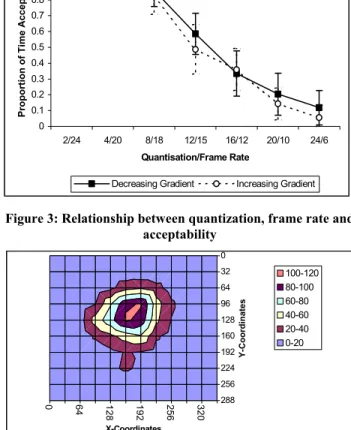
When a reduced frame rate is factored in, the pattern of results is almost identical to those with full frame rate. Again, there are significant differences between the seven physical quality levels and they display a logistic relationship with perceived quality – see Figure 3 [F(1,31) = 139.75, p < 0.001]. Again, there was no significant interaction between quality levels and the direction of the gradient. The between-subject factors of film and order of presentation were not significant. A quantization value of 8 is the critical value above which acceptability drops off sharply.
Eye movements
An examination of the distribution of eye movements between the two extremes of high and low quality did not reveal any significant differences. The pattern of sampling is remarkably consistent across the different clips and levels of quality. One reason for this may be the influence of the film conventions. These tend to place the object of interest in the center of the screen. With sports coverage, such as soccer, the cameramen filming the action implicitly find the region or object of interest and place it in the center of the field of view. The net effect, is a clear distribution of gaze towards the center of the screen across a wide range of different camera angles and content. Figure 4 show the frequency distribution of X-Y Coordinates over a 30 second period averaging across films types, gradients and presentation order.
0 0.1 0.2 0.3 0.4 0.5 0.6 0.7 0.8 0.9 1 2/24 4/20 8/18 12/15 16/12 20/10 24/6 Quantisation/Frame Rate
Proportion of Time Acceptabl
e
Decreasing Gradient Increasing Gradient
Figure 3: Relationship between quantization, frame rate and acceptability 0 64 128 192 256 320 288 256 224 192 160 128 96 64 32 0 X-Coordinates Y -Coordi nat es 100-120 80-100 60-80 40-60 20-40 0-20
Figure 4: Gaze distribution over an average 30 sec segment.
Knowledge of the shape of this distribution could serve as a computationally cheap technique to define a ROI that persists across different shot types for a particular type of content. Thus, a finer quantization scale might be applied to ROIs that are sampled more often than others, while regions that are hardly ever fixated could be coded more coarsely. This would result in further savings in bandwidth without any impact on perceived quality – although this claim needs to be verified with a further study.
STUDY 2 – VIDEO ON THE PALMTOP
Study 2 examined the psychophysics of video quality for sports coverage on a palmtop (iPAQ h2210). The video window was 176x144 in size, equivalent to sizes available on mobile videophones. In addition to retesting the clips used in Study 1 on smaller screens, and a different device, we examined the acceptability of video around the critical values of frame rate and quantization identified in Study 1.
Participants
37 (31 male, 6 female, mean age 22) students from University College London participated in the study. Participants were paid £5 Sterling (approx. $8) for participation. 65% of participants watched football at least once a week. 84% said they supported a particular team and 38% supported one of the two teams represented in the clips.
Equipment
The films where presented on an iPAQ h2210. The physical size of the entire screen area was 52mm x 70mm. All film clips where presented at a resolution of 176x144 using Pocket TV software. The physical size of the video on screen was 40mm x 32mm The iPAQ was held by observers at an average distance of 300mm (200-400mm). The vertical height of the video subtended an angle of 6 degrees to the eye.
Design
Each participant was initially presented with three film clips. The design was a subset of that used in Study 1 – examining only increasing quality gradients (See Table 3) In addition, participants were presented with a fourth film clip which examined encoding parameters for Clip B around the Study 1 critical values.
Procedure
The procedure to elicit acceptability responses was identical to that used in Study 1, except in this study we did not track eye movements. After watching the clips we asked users an open question to describe the main problems when quality was unacceptable.
RESULTS
Perceived quality and frame rate
The ANOVA revealed a significant difference between the seven different levels of Frame Rate, F(1,34) = 11.4, p = 0.002. As shown in Figure 5 low frame rate video was less acceptable on the palmtop than on the desktop.
This effect was driven by responses to one particular clip (Clip B) where low frame rate was accompanied rapid camera panning and a shot on goal. The ANOVA revealed different reactions to this clip segment as an interaction between Film Clip and Frame Rate, F(2,34) = 4.65, p = 0.016. This was not observed in the desktop study (Study 1) and suggests that users are more susceptible to low
frame rates on the palmtop device. For this device a conservative estimate of the critical value for frame rate is 12 fps, yet rates as low as 6 fps are acceptable 50% of the time. 0 0.1 0.2 0.3 0.4 0.5 0.6 0.7 0.8 0.91 24 20 18 15 12 10 6 Frame Rate (FPS) Proport ion of Time Accept a bl e Palmtop Desktop
Figure 5: Relationship between frame rate and acceptability.
Perceived quality and quantization
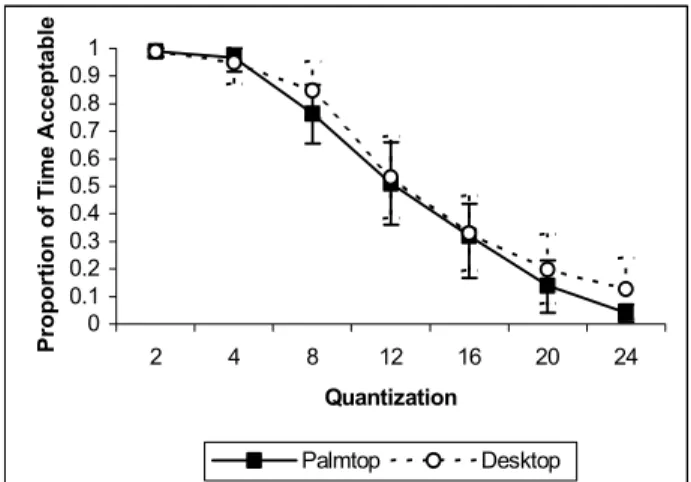
The ANOVA showed a significant difference between levels of Quantization, F(1,34) = (1, 32) = 86.8, p < 0.001, but no interaction between Quantization and Film Clip. The shape of the psychophysical function follows that for the desktop study. The critical value for quantization for both form factors is Q=8 (See Figure 6).
0 0.1 0.2 0.3 0.4 0.5 0.6 0.7 0.8 0.9 1 2 4 8 12 16 20 24 Quantization
Proportion of Time Acceptable
Palmtop Desktop
Figure 6: Relationship between quantization and acceptability.
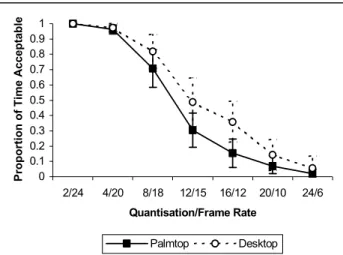
Quantization and frame rate
When frame rate and quantization are jointly manipulated, the ANOVA shows significant differences between the seven different Quality Levels, F(1,32) = 162.7, p < 0.001. When compared to the desktop, the psychophysical functions suggest that users are more sensitive to reduced
0 0.1 0.2 0.3 0.4 0.5 0.6 0.7 0.8 0.9 1 2/24 4/20 8/18 12/15 16/12 20/10 24/6 Quantisation/Frame Rate
Proportion of Time Acceptabl
e
Palmtop Desktop
Figure 7: Relationship between quantization, frame rate and acceptability.
The ANOVA also shows a significant difference between Film Clips, F(2,32) = 7.4, p = 0.02 and an interaction between Quality Level and Film Clip, F(2,32) = 5.5, p=0.08.
Critical values, acceptability and bandwidth
Figure 8 shows the relationship between acceptability and bandwidth for the fourth film clip (sourced from Clip B). This examined acceptability around the critical values suggested from Study 1. The graph shows that a low frame rate (6fps) at a quantization of Q=4 has little effect on perceived acceptability but results in a large saving in bandwidth. However, at the critical value of Q=8 frame rate has an adverse effect on acceptability. This suggests that once acceptability falls below some threshold, reducing frame rate can compound perceived unacceptability.
Qualitative comments
When we probed people for the main problems experienced when quality was unacceptable, they mentioned the same factors.
♦ 84% said that recognizing players was impossible. ♦ 65% said they had problem following the ball.
♦ 35% said that close-up shots where fine but that
long/distant camera shots of the pitch were very poor quality
♦ 21% cited jerky movement as one of the main problems.
In our view, these comments endorse the relative importance of frame quality vs. frame rate for sports coverage, neatly summarized in one participant’s comment who stated “I’d rather have jerky video and better quality pictures”. 0 0.1 0.2 0.3 0.4 0.5 0.6 0.7 0.8 0.9 1 0 50 100 150 200 250 Bandwidth (kbps)
Proportion of Time Acceptable
Quant=4 Quant = 8 Quant = 12
6fps 6fps 6fps 8fps 8fps 12fps 12fps
Figure 8: Relationship between bandwidth and acceptability.
CONCLUSIONS Limitations
While the methodology proved robust in measured acceptability of variable video quality one limitation of the present study is that additional degradations due to network effects are not factored in. Future studies should extend the investigation to examine the impact of transmission over a wireless medium. When video is streamed over a wireless network, variable bit error rates (BER) may lead to data corruption, and moving mobile devices may experience different levels of service as they roam between network segments with different characteristics (e.g. capacity), or perform hand-off operations.
Substantive findings
Our results illustrate the response curves relating physical quality to perceived quality for sports coverage on two different form factors using a population of users with clear interest in the content. The overall picture is that participants were more sensitive to reductions in frame quality (quantization) than to changes in frame rate. At the lowest frame rate of 6 fps, participants still found the quality acceptable 80% of the time. This challenges the conventional wisdom that sports coverage with high motion requires a high frame rate to maintain perceived QoS. Although motion is not perceived “smoothly” at the lowest frame rate (6fps), acceptability is maintained for the majority of participants. This finding has important consequences for automated QoS metrics that draw on models of the human visual system. Clearly, there is some play within the visual system such that it can tolerate relatively gross interruptions in temporal resolution. This enables sports coverage to be watched comfortably, even at frame rates that lead to a breakdown in smooth motion.
Methodological findings
The method of limits gave stable ratings of quality independent of the quality gradient or order of presentation. This indicates that binary measurements of acceptability
are robust to changes in context and independent of memory effects such as those reported by [1]. In line with ITU recommendations [11], the methodology generates data that exhibits a logistic relationship to the perceived quality metric. Although this was not the case for frame rate, a different lower limit (e.g. 2 fps) might produce the desired results. In believing that 6fps was low enough to make quality unacceptable we were susceptible to the same false assumptions common with service providers.
The new methodology evaluates perceived QoS in a variable quality environment, with little user cost. Even though, the qualitative responses (Study 2) paint a similar picture of the relative importance of frame quality vs. frame rate, they do not provide the detailed graphs indicating the physical quality levels where problems arise. This information is invaluable for both service providers and researchers in understanding the limits of perceived quality.
Future research
One avenue of interest is to investigate the eye tracking data to generate computationally cheap methods to save bandwidth without impacting perceived quality.
However, our main focus is to understand the relationship between physical and psychological quality metrics. The “Method of Limits” is a robust methodology to investigate this relationship and we plan to extend the current investigation to study responses in a live streaming context. This research effort will provide valuable guidelines on minimum standards for streamed sports coverage.
ACKNOWLEDGEMENTS
The research was funded by BT as part of the Higherview
Project http://www.cs.ucl.ac.uk/research/higherview/. We thank Jens Riegelsberger for his assistance in conducting the studies and Mark Handley (UCL), David Hands (BT) and Mark Claypool (WPI) for their comments on early drafts of this paper.
REFERENCES
1. Aldridge, R., Davidoff, J., Ghanbari, M., Hands, D. & Pearson, D. Measurement of scene-dependent quality variations in digitally-coded television pictures. IEE Proceedings on Vision, Signal and Image Processing, (1995) 142, 149-154.
2. Apteker, R.T, Fisher, J.A., Kisimov, V.S. & Neishlos, H. Video Acceptability and Frame Rate. IEEE Multimedia, 3(3):32--40, 1995.
3. Bouch, A & Sasse, M.A. The case for predictable media quality in networked multimedia applications. In K. Nahrstedt & W. Feng [Eds.]: Proceedings of ACM/SPIE
Multimedia Computing and Networking (MMCN'00), 25-27th January 2000, San Jose, USA. pp 188-195. 4. De Ridder, H. & Hamberg, R. Continuous Assessment
of Image Quality. SMPTE Journal. 106(2): 123-128, Feb 1997.
5. Fechner, G. T. Elements of psychophysics (Vol. 1). (H. E. Adler, Trans. 1966). New York: Holt, Rinehart & Winston. (Original work published 1860).
6. Fukuda, K. Integrated QOS control mechanisms for real-time multimedia systems in reservation –based networks. PHD Thesis, School of Engineering Science, Osaka University. Jan 2000. Available at
http://www.anarg.jp/achievements/web1999/papers/k-fukuda/k-fukuda00PhD-IntegratedQoS.pdf
7. Ghinea, G. and Thomas, J.P. QoS Impact on User Perception and Understanding of Multimedia Video Clips…in Proceedings of ACM Multimedia ’98 (Bristol, UK, 1998)
8. Hamberg, R. & de Ridder, H. Time varying Image Quality: Modelling the relations between instantaneous and overall quality. SMPTE Journal, 802-811, Nov 1999.
9. Hands, D. P-QoS for Mobile Multimedia available at http://www.iee.org/oncomms/pn/visualinformation/P-Qos_For_Mobile_Multimedia.pdf
10. IBM. Functions of mobile multimedia QOS control (Updated Feb 2002). Available at
http://www.trl.ibm.com/projects/mmqos/system_e.htm 11. ITU-R BT.500-11. Methodology for the subjective
assessment of the quality of television pictures. Revised 2002.
12. Knoche, H., De Meer, H. G. & Kirsh, D. Utility Curves: Mean Opinion Scores Considered Biased, Proceedings of 7th International Workshop on Quality of Service, 1st - 4th June 1999, University College London, London, UK.
13. LC Technologies Inc. See http://www.eyegaze.com/ 14. Masry, M.A. and Hemami, S.S. CVQE: A metric for
continuous video quality evaluation at low bit rates.
IEEE Intl. Conf. on Image Processing 2001, Thessaloniki, Greece, October 2001.
15. Wang, D., Speranza, F., Vincent, A., Martin, T. & Blanchfield, P. Towards Optimal Rate Control: A Study of the Impact of Spatial Resolution, Frame Rate and Quantization on Subjective Quality and Bitrate. Visual Communications and Image Processing (VCIP 2003).