Cost Accounting In Auto Manufacturing
Companies In Germany
And The United States
Robert Jinkens, USARamMohan R. Yallapragada, Fayetteville State University, USA
ABSTRACT
Corporate accountants are mandated to prepare and distribute financial accounting reports for external U.S.ers at end of each accounting period. However, there are no similar statutory requirements for corporate accountants to provide managers of their companies with the management accounting information necessary for decision making in their bU.S.iness operations. Cost accounting is an important integral part of management accounting. Product costing has always been a much debated issue in management accounting. The area that has generated a host of conflicting views is the allocation of overhead costs to products. Traditional absorption costing is claimed to be resulting in an unfair allocation of overhead costs to products. New approaches such as the Activity Based Costing (ABC) did not receive widespread adoption. It is being realized in management accounting field that an emerging costing method known as Resource Consumption Accounting (RCA) is a better method for product costing. It is a method adopted by the German manufacturing companies. This paper describes the German cost accounting method and also compares the German cost accounting with the cost accounting in the United States, specifically in the automobile manufacturing indU.S.try.
Keywords: Cost Accounting in auto manufacturing companies in Germany and The United States, Cost Accounting, Activity-Based Costing, Resource Consumption Costing, Grezplankostenrechnung (GPK)
INTRODUCTION
t is widely realized that there is a frU.S.tration prevailing among senior management in the United States at the inadequacy of cost and resource management skills of managers in their companies. The International Federation of Accountants (IFAc) is advocating for management accounting based on optimal U.S.age of corporate resources (Sharman, 2003). Historically, statutory financial accounting and reporting requirements were emphasized at the expense of variable costing and managerial accounting reports (Bain and Company, 2003). At the end of each quarter, corporate accountants are obligated to prepare and convey financial reports to external U.S.ers. However, there exists no such statutory requirement for corporate accountants to provide the managers with the accounting information necessary for their decision-making needs in the bU.S.iness operations. Furthermore, the oneroU.S. Sarbanes-Oxley Act of 2002 has piled up even more statutory requirements regarding financial reporting and corporate governance, further relegating management accounting into the background.
New approaches to cost accounting, such as the Activity Based Costing (ABC), did not receive widespread adoption. As Sharman (2003) states, an Ernst & Young survey in 2003 of about 2,000 CFOs (Chief Financial Officers) revealed that 98 percent of respondents reported that cost information is distorted due largely to improper overhead allocation. It is reported that about 80 percent of the U. S. companies still U.S.e the traditional cost allocation methods. Of the many companies that tried to implement the ABC costing, only 20 percent were able to sU.S.tain it. Many companies claimed that the ABC system design is too complex. Sharman (2003) suggests that management accountants should adopt meaningful and dynamic changes in their functions of providing information
to managers to enable them to achieve bU.S.iness performance. It can be achieved by combining U.S. management accounting practices with successful practices from other countries.
RESOURCE CONSUMPTION ACCOUNTING
According to Clinton (2004) an emerging costing method, known as Resource Consumption Accounting (RCA), produces more accurate results and provides more detailed management accounting information than the traditional methods. It is based on a German cost management principles system known as Grezplankostenrechnung (GPK). This German cost accounting system is designed with the main objective of providing relevant information to managers to facilitate their managerial decisions. According to Krumweide and Suessmair (2005), “GPK integrates many homogeneoU.S. cost centers with planned costs, variance costs, variance analysis, separating fixed costs from variable costs, all of this at the cost center level, to achieve a high level of cost control and accuracy.” Cheney (2005) states that, “where a typical U.S. company might have one Overhead (OH) measure per department, a GPK structure typically involves a half dozen or more measures per resource cost center.”
GPK
White (2004) states that GPK has been widely U.S.ed in German manufacturing and services companies for over forty years and that any technique this durable and successfully U.S.ed by a major indU.S.trial nation should be understood. According to Sharman and Vikas (2004), management accounting and controllership practices in German speaking countries are more developed than in the rest of the world. The German system, GPK, can be loosely translated as, “ Flexible Analytic Cost Planning and Accounting.” The system is also referred as, “Flexible Standard Costing.” As Buys (2007) states, standard costing , as it applies to manufacturing in the U.S., , U.S.ually includes direct material, direct labor, and allocated manufacturing overhead costs which include plant facilities, manufacturing related personnel, and depreciation of factory machinery. Many companies in the U.S. allocate overhead costs to products with the intention of recovering all costs. This is not the case with the GPK. GPK is more closely related to marginal costing, with many aspects of Activity Based Costing. Offenbacker (2004) describes Marginal Costing as a type of flexible standard costing which separates fixed costs from proportional costs in relation to the output quantity of the cost objects. Costs are monitored based on resource drivers. As Gunther (2005) points out, the most important idea behind the GPK is that fixed costs are not charged to the products.
Krumweide (2005) observes that firms that U.S.e GPK typically have integrated information systems based on SAP software. They tend to have highly complex products and manufacturing processes. However, manufacturing firms that U.S.e a continuoU.S. process U.S.ually do not U.S.e GPK becaU.S.e their processes are relatively simple and automated. They do not benefit from U.S.ing GPK. Also, GPK is not jU.S.t for manufacturing indU.S.tries. For example, Deutsche Telecom has a sophisticated GPK system.
STATEMENT OF THE PROBLEM
There is a continuing frU.S.tration among the U.S. management accountants with the ABC costing. They also realize that the traditional methods of overhead cost allocation to products is not accurate. Many in the management accounting field are calling for a serioU.S. consideration of the time-tested German GPK cost system for adoption in the U.S. manufacturing indU.S.tries. This paper makes an effort to present the results of product costing under the existing U.S. cost systems as compared with the costing under the GPK German system in the automobile indU.S.try. Data are gathered from --- U.S. automobile companies and ---- German automobile companies for the past ---- years via the CompU.S.tat. Comparative data are presented for the --- years and tests of significant differences are conducted.
ANALYSIS OF DATA
Two automobile manufacturing companies from the United States, Ford and General Motors (GM) and two automobile manufacturing companies from Germany, Diamler-Mercedes Benz (MB) and Volkswagen (VW) are included in this study. Data pertaining to these four companies were collected from COMPU.S.TAT. Data were collected for six years, 2001 through 2006 for all the four companies in the study.
Comparison of the U. S. and the German automobile cost accounting systems was conducted by comparing several financial ratios of the companies in the study. The financial ratios computed and compared are:
1. Cost of Goods Sold/ Sales (CGS/S) 2. Operating Profit/ Sales (OP/S) 3. Earnings per Share (EPS) 4. Sales Turnover of Assets (TO)
5. Operating Profit/ Plant Assets (OP/PA) 6. Debt/Equity (D/E)
7. Plant Assets/Total Assets (PA/TA)
8. Return on Investment (ROI), measured as Operating Profit/Operating Assets
The results are presented in the following tables. The eight financial ratios of the four automobile companies in the study, for the years 2001 through 2006, are presented in Tables 1 through 5. The averages of each of the seven financial ratios for the six years in the study for each automobile company in the study are presented in Table 5.
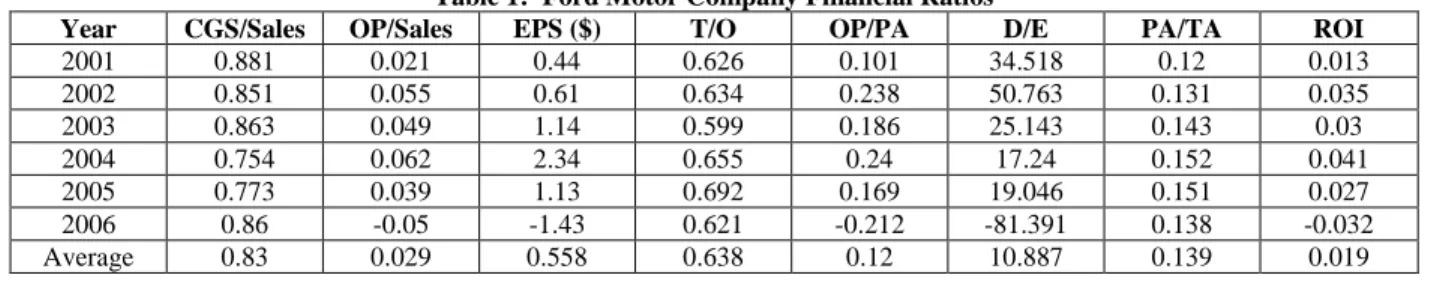
Table 1: Ford Motor Company Financial Ratios
Year CGS/Sales OP/Sales EPS ($) T/O OP/PA D/E PA/TA ROI
2001 0.881 0.021 0.44 0.626 0.101 34.518 0.12 0.013 2002 0.851 0.055 0.61 0.634 0.238 50.763 0.131 0.035 2003 0.863 0.049 1.14 0.599 0.186 25.143 0.143 0.03 2004 0.754 0.062 2.34 0.655 0.24 17.24 0.152 0.041 2005 0.773 0.039 1.13 0.692 0.169 19.046 0.151 0.027 2006 0.86 -0.05 -1.43 0.621 -0.212 -81.391 0.138 -0.032 Average 0.83 0.029 0.558 0.638 0.12 10.887 0.139 0.019
Table 2: General Motors Corporation Financial Ratios
Year CGS/Sales OP/Sales EPS ($) T/O OP/PA D/E PA/TA ROI
2001 0.832 0.052 3.37 0.596 0.111 15.439 0.228 0.031 2002 0.762 0.039 7.77 0.583 0.1 53.415 0.196 0.023 2003 0.75 0.057 5.7 0.514 0.144 16.75 0.162 0.029 2004 0.756 0.063 6.42 0.495 0.161 16.541 0.156 0.031 2005 0.816 -0.019 -5.8 0.482 -0.045 31.615 0.165 -0.009 2006 0.761 0.065 6.94 1.435 0.226 -35.22 0.322 0.094 Average 0.78 0.043 4.067 0.684 0.116 16.423 0.205 0.033
Table 3: Diamler (Mb) Financial Ratios
Year CGS/Sales OP/Sales EPS ($) T/O OP/PA D/E PA/TA ROI
2001 0.746 0.001 0.82 0.928 0.003 4.318 0.372 0.001 2002 0.72 0.025 5.52 0.98 0.058 4.365 0.344 0.025 2003 0.721 0.023 1.28 0.927 0.055 4.17 0.321 0.022 2004 0.726 0.027 3.41 0.918 0.064 4.447 0.332 0.025 2005 0.734 0,015 3.33 0.852 0.032 4.532 0.352 0.013 2006 0.731 0.023 5.12 0.904 0.049 4.564 0.374 0.021 Average 0.73 0.019 3.247 0.918 0.043 4.399 0.349 0.018
Table 4: Volkswagen Financial Ratios
Year CGS/Sales OP/Sales EPS ($) T/O OP/PA D/E PA/TA ROI
2001 0.738 0.057 1.36 1.043 0.187 3.352 0.278 0.059 2002 0.73 0.051 1.42 0.992 0.152 3.421 0.287 0.05 2003 0.751 0.019 0.72 0.907 0.054 3.877 0.275 0.017 2004 0.76 0.026 0.48 0.914 0.076 4.32 0.254 0.025 2005 0.779 0.001 0.81 0.965 0.002 4.639 0.247 0.001 2006 0.785 0.001 2.16 1.089 0.003 4.077 0.208 0.001 Average 0.757 0.026 1.158 0.994 0.079 3.948 0.258 0.025
Table 5: All The Four Companies Average Financial Ratios Years 2001 -2006
Company CGS/Sales OP/Sales EPS ($) T/O OP/PA D/E PA/TA ROI
Ford 0.83 0.029 0.558 0.638 0.12 10.887 0.139 0.019
General Motors 0.78 0.043 4.067 0.684 0.116 16.423 0.205 0.033
Diamler (Mb) 0.73 0.019 3.247 0.918 0.043 4.399 0.349 0.018
Volkswagen 0.757 0.026 1.158 0.994 0.079 3.948 0.258 0.025
1. CGS/S: The average CGS/Sales percentages for the Ford Motor Company and GM are 83 percent and 78 percent respectively. The same percentages for Diamler and VW are 73 percent and 75.7 percent respectively. The two German auto companies showed slightly lower cost of goods sold percentage and therefore exhibit slightly higher gross profit percentages as compared with the two U.S. auto companies. 2. O P/S: The average Operating Profit/Sales (OP/S) of Ford was 2.9 percent and that of GM was 4.3
percent. Diamler showed an average OP/S of 1.9 percent and VW had an average OP/S of 2.6 percent. GM has reported the highest average and Diamler showed the lowest Operating Profit Margin among the four automobile companies in the study for the period of 2001-2006.
3. EPS: The average EPS was the highest for GM at $4.07, followed by Diamler at $3.25 and VW at $1.19. Ford reported the lowest EPS of the four companies at $0.59.
4. TO: The Sales Turnover (TO) for VW was the highest among the four companies at 0.99 followed by Diamler at 0.92. the TO for GM was 0.68 and that of Ford was 0.64. The two German companies had significantly higher Sales Turnover ratios than the two U.S. companies.
5. OP/PA: The average Operating Profit/ Plant Assets percentages for Ford and GM were far higher at 12 percent and 11.6 percent respectively. The same for VW and Diamler were far lower at 7.9 percent and 4.3 percent respectively. The German companies are having a much higher composition of Plant Assets to Total Assets than their U.S. counterparts and that may be the reason for the lower OP/PA ratios for the German companies.
6. D/E: The U.S. companies showed far higher average Debt/Equity ratios than did the German companies. The D/E ratios for GM and Ford were 16.42 and 10.88 respectively, whereas the ratios for Diamler and VW were 4.39 and 3.94 respectively. The two U.S. companies are evidently more heavily leveraged than their German counterparts.
7. PA/TA: The PA/TA is computed as the ratio of Plant Assets to Total Assets. This ratio is treated in this study as a measure of the degree of automation in the manufacturing process of each company in the study. The average ratios of Plant Assets to Total Assets are much higher for the German companies (Diamler: 0.35 and VW: 0.26) than those of the U.S. companies (Ford: 0.14 and GM: 0.21). This may indicate that the German companies are far more automated than their U.S. counterparts
8. ROI: The ROI is calculated as a ratio of Operating income to Operating Assets. The average ROI ratios for GM and Ford were 3.3 percent and 1.9 percent respectively. The average ROIs for VW and Diamler were 2.5 percent and 1.8 percent respectively. The ROI ratios for GM and VW seem to be almost the same, whereas Ford leads VW by one full percentage point.
SUMMARY, CONCLU.S.IONS AND RECOMMENDATIONS
The review of literature in this study revealed that the German cost accounting system (GPK) is very different from the cost accounting systems employed in the U.S.. The German system consists of a modified ABC system. The most salient aspect behind GPK is that fixed manufacturing costs are not charged to the product costs. The U.S. costing system follows the traditional GAAP format where fixed manufacturing costs are treated as product costs. An effort is made in this study to compare the U.S. and the German Costing systems by examining the income statement and the balance sheet data of two U.S. companies - GM and Ford - and two German companies - VW and Diamler - over the six-year period 2001 through 2006.
Seven financial ratios of the two U.S. auto companies were compared with those of the two German auto companies. There were significant differences in the average ratios of the U. S. and German companies only in a few areas.
1. The average Sales Turnover ratios (Sales/Total Assets) are significantly higher for the German auto companies (Diamler: 0.918 and VW: 0.994) than the Sales Turnover ratios for the U.S. auto companies (Ford: 0.638 and GM: 0.684). This study has not been able to find an explanation for this difference. 2. The average ratios of Operating Profit to Plant Assets is far higher for the U.S. companies (Ford: 0.12 and
GM: 0.116) than those for the German companies (Diamler: 0.05 and VW: 0.08). The German companies are having a much higher composition of Plant Assets to Total Assets than their U.S. counterparts and that may be the reason for the lower OP/PA ratios for the German companies.
3. The average Debt/Equity ratios for the U.S. companies are almost three times higher (Ford: 10.887 and GM: 16.423) than those of their German counterparts (Diamler: 4.399 and VW: 3.948). The reasons for this higher leverage for the U.S. companies need to be explored.
4. The average ratios of Plant Assets to Total Assets are much higher for the German companies (Diamler: 0.35 and VW: 0.26) than those of the U.S. companies (Ford: 0.14 and GM: 0.21). This may indicate that the German companies are far more automated than their U.S. counterparts. Further studies are needed to confirm this assumption.
This study compared the financial ratios of the U.S. and German automobile companies and found that the ratios are almost the same, except in four aforementioned areas. Further research studies need to be conducted to explore the reasons for the vast differences in ratios in these four areas. This study was not able to provide any evidence as to which costing system - the traditional U.S. system or the German GPK cost system - is superior in product costing. The comparison of the financial ratios of the two U.S. auto companies and the two German auto companies in this study showed that, in many areas, there is no significant difference between the two costing systems.
AUTHOR INFORMATION
Robert Jinkens earned his post doctoral AACSB certification in accounting from the University of Florida at Gainesville. His PhD is from the University of Hawai’i at Mānoa in accounting education. He also has an MSBA in Finance from the University of Southern California, an MBA from the University of California at Irvine, as well as a BA in math and a BS in business both from the University of Southern California. He has active CPA licenses in California and Hawaii and is a California Real Estate Broker. His educational licenses include five California Community College Credentials (accounting, economics, finance, management, and real estate), two Arizona Community College Certificates (business, and math), and a California Standard Secondary Credential for grades 9 through 12 (business, math, and humanities: German). He has taught accounting, finance and other related subjects at the undergraduate and graduate levels since 1974. His research interests include financial accounting, managerial accounting, and accounting education.
Dr. RamMohan R. Yallapragada is an Associate Professor of Accounting at Fayetteville State University. He obtained his PhD degree in Accounting from the University of Houston. He holds a CPA certificate from the State of Louisiana. He taught at University of Texas at San Antonio, Nicholls State University, and University of Louisiana, Lafayette before joining FSU. He has published in several journals including Journal of Business and
Economic Research, International Business and Economic Research Journal, Journal of Accounting and Finance Research, and Clarion Business and Economic Review. His research areas include Cost Accounting in Healthcare, Accounting irregularities in Fannie Mae, impact of Sarbanes-Oxley Act of 2002 on American corporations and the effect of unprecedented growth in the economies of India and China on global trade.
REFERENCES
1. Buys, Pieter (2007). “Strategic Costing Techniques: German Cost Accounting,” Accountancy SA, May 2007.
2. Cheney, Glenn (2005). “German Cost Accounting: Will It Work In America?” WebCPA, Vol. 19, Issue 9, May 19, 2005, pp. 14-16.
3. Clinton, Douglas A. (2004). “RCA at Coplay: Here’s Innovation in Management Accounting with Resource Consumption Accounting,” Strategic Finance, October 2004.
4. Gunther, Friedl (2005). “Relevance Added: Combining ABC with German Cost Accounting,” Strategic Finance, June, 2005.
5. Krumweide, Kip (2005). Rewards and Realities of German Cost Accounting,” Strategic Finance, Vol. 86, Issue 10, April 2005, pp. 27-34.
6. Krumweide, Kip and AugU.S.tin Suessmair (2005). “Comparing U. S. and German Cost Accounting Methods,” Management Accounting Quarterly, Vol. 8, Issue 3, Spring 2005, pp. 1-9.
7. Offenbacker, Stephen (2004). “ Marginal Costing as a Management Accounting Tool,” Management Accounting Quarterly, Winter, 2004.
8. Sharman, Paul A. (2003). “The Case for Management Accounting,” Strategic Finance, October, 2003. 9. Sharman, Paul A. and K. Vikas (2004). “Lessons From German Cost Accounting,” Strategic Finance,
December, 2004.
10. White, Larry (2004). “Why look at German Cost Management?” Strategic Finance, Vol. 86, Issue 3, September 2004, pp.6-25.