Pay for Performance from
Future Fund Flows:
The Case of Private Equity
Ji-Woong Chung
BErk A . SEnSoy
Lé A h. S TErn
MiChAEL S. WEiSBACh
no 77 — sep tember 2010
SIFR – the Institute for Financial Research is an independent non‐profit organization
established at the initiative of members of the financial industry and actors from the
academic arena. SIFR started in 2001 and is situated in the center of Stockholm. Professor
Per Strömberg serves as director of the institute. The mission of SIFR is to:
• Conduct and stimulate high quality research on issues in financial economics, where
there are promising prospects for practical applications,
• Disseminate research results through publications, seminars, conferences, and other
meetings, and
• Establish a natural channel of communication about research issues in finance
between the academic world and the financial sector.
The activities of SIFR are supported by a foundation based on donations from Swedish
financial institutions. Major donations have been made by: AFA, Alecta, Alfred Berg, AMF
Pension, Brummer & Partners, Carnegie, Danske Bank, Handelsbanken, Kapitalmarknads‐
gruppen, Länsförsäkringar, Nordea, and Svenska Fondhandlareföreningen.
In addition, SIFR is directly sponsored by some institutions. Nasdaq OMX funds research
projects and several positions at SIFR, including the Olof Stenhammar professorship in
financial entrepreneurship. Stockholm School of Economics funds two research positions,
and Sveriges Riksbank funds a visiting professorship at SIFR.
SIFR also gratefully acknowledges research grants received from Stiftelsen Bankforsknings‐
institutet, Föreningsbankens Forskningsstiftelse, Jan Wallanders och Tom Hedelius Stiftelse,
Riksbankens Jubileumsfond, Johan och Jakob Söderbergs Stiftelse, Torsten och Ragnar
Söderbergs Stiftelser, and Foundation for Economics and Law.
Institute for Financial Research, SIFR, Drottninggatan 89, SE‐113 60 Stockholm, Sweden Phone: +46 (8) 728 51 20, Fax +46 (8) 728 51 30, E‐mail: [email protected], Web: www.sifr.org
Pay
for
Performance
from
Future
Fund
Flows:
The
Case
of
Private
Equity
Ji
‐
Woong
Chung,
Berk
A.
Sensoy,
Léa
H.
Stern,
and
Michael
S.
Weisbach
Pay for Performance from Future Fund Flows: The Case of Private
Equity
∗Ji-Woong Chung
Chinese University of Hong Kong
Berk A. Sensoy Ohio State University
Léa H. Stern Ohio State University Michael S. Weisbach
Ohio State University and NBER September 8, 2010
Abstract
Lifetime incomes of private equity general partners are affected by their current funds’ per-formance through both carried interest profit sharing provisions, and also by the effect of the current fund’s performance on general partners’ abilities to raise capital for future funds. We present a learning-based framework for estimating the market-based pay for performance arising from future fundraising. For the typical first-time private equity fund, we estimate that implicit pay for performance from expected future fundraising is approximately the same order of mag-nitude as the explicit pay for performance general partners receive from carried interest in their current fund, implying that the performance-sensitive component of general partner revenue is about twice as large as commonly discussed. Consistent with the learning framework, we find that implicit pay for performance is stronger when managerial abilities are more scalable and weaker when current performance contains less new information about ability. Specifically, im-plicit pay for performance is stronger for buyout funds compared to venture capital funds, and declines in the sequence of a partnership’s funds. Our framework can be adapted to estimate implicit pay for performance in other asset management settings in which future fund flows and compensation depend on current performance.
∗For helpful comments and discussions, we thank Brent Goldfarb, Ulrich Hege, Josh Lerner, Oguzhan Ozbas, Manju Puri, Morten Sorensen, Per Stromberg, and seminar and conference participants at Duke University, Koc University, Ohio State University, Rutgers University, University of Arizona, University of Georgia, University of North Carolina, LBS Symposium on Private Equity Findings, and the Third Canadian Conference on the Economics of Innovation and Entrepreneurship. Contact information: [email protected]; [email protected]; [email protected]; [email protected].
I. Introduction
Compensation agreements in private equity (PE) partnerships typically give general partners (GPs) a management fee that is a percentage (usually 1 to 2%) of the amount of capital committed to the fund, as well as “carried interest” equal to a percentage of the profits (usually 20%). The carried interest, together with the GP’s own equity contribution to the fund, links GP compensation to performance to a much greater extent than is typical in public corporations. This strong pay for performance, and the resulting explicit incentives to make value-maximizing decisions, is commonly thought to be an important driver of the success of private equity firms.1
Yet, these explicit compensation formulas represent only part of the total pay for performance faced by private equity GPs. GPs’ lifetime incomes are highly dependent on their ability to raise capital in the future, which in turn is a function of the performance of the GPs’ current funds. Consequently, in addition to the carried interest and the partners’ own investment in the fund, general partners’ lifetime incomes are substantially affected by their funds’ performance through its impact on subsequent fundraising. GPs’ total pay for performance equals the sum of pay for performance features of the explicit compensation contract and the implicit, market-based pay for performance caused by the relation between today’s performance and the ability to raise capital in the future.
This type of indirect pay for performance is not specific to private equity; indeed, it is a sub-stantial source of incentives in many settings.2 Yet, despite the widespread theoretical interest in implict incentives and their importance to real-world organizations, little is known about their ac-tual magnitude. This gap in our knowledge is surprising given that understanding the size of the pay for performance relation through market-based rather than compensation-based mechanisms is essential to drawing inferences about managers’ motivations.
In this paper, we estimate the magnitude of implicit pay for performance in the private equity industry. To do so, we exploit the fact that in the private equity industry, GPs’ explicit compensation
1See, for example, Jensen (1989), Kaplan (1989), and Kaplan and Stromberg (2009).
2Examples include promotion or elimination tournaments inside corporations (e.g. Lazear and Rosen, 1981; Green and Stokey, 1983; Rosen, 1986; Han et al., 2009), the possibility that a CEO will be fired for poor performance (e.g. Jensen and Murphy, 1990; Hermalin and Weisbach, 1998), and the possibility that securities analysts will be promoted or fired depending on the accuracy of their forecasts (Hong and Kubik, 2000; Hong, Kubik, and Solomon, 2003). Like the private equity industry, market-based pay for performance in other asset management settings such as mutual funds and hedge funds arises from a relation between performance and future inflows of new investment.
is given by well-known formulas that are a function of fund size and the fund’s return. In addition, we observe a time series of a partnership’s funds and their performance, so it is possible to estimate the extent to which a fund’s current return affects its general partners’ future fundraising, and hence their expected future income.
Our estimates allow us to address a number of important questions about the private equity industry. In particular, for every extra percentage point of returns (or every extra dollar) earned for the current fund’s investors, how much, in expectation, does the lifetime income of the fund’s general partner change? How strong is this implicit pay for performance relation relative to the
much-discussed explicit one? Theoretically, what factors ought to affect the size of change in
partners’ lifetime incomes as a function of fund returns? Do these predicted patterns appear true
in the data? More generally, how do today’s returns affect the ability of partnerships to raise
capital subsequently? How important is future fundraising to the total (explicit plus implicit) pay-performance relation facing private equity general partners?
To answer these questions, we formalize the logic by which good performance today could lead to higher future incomes for GPs through an effect on expected future fundraising. We assume that a private equity partnership potentially has an ability to earn abnormal returns for their investors, but this ability is unknown. Given an observation of returns, investors update their assessment of the GP’s ability, and, in turn, decide whether the GP is able to raise another fund, and if so, how much capital to allocate to it. In our framework, there is a maximum number of future funds the GP can potentially manage in sequence, and failure to raise a follow-on fund at any point in the sequence means that the GP is unable to raise any more funds subsequently. We derive predictions about the relation between the performance of a particular fund and the fund’s partners’ abilities to raise capital in the future. Intuitively, the more informative the fund’s performance is about GPs’ abilities, the more sensitive future fundraising should be to today’s performance. In addition, the way in which abilities can be “scaled” will affect investors’ willingness to commit higher quantities of capital for a given level of managerial ability. These larger funds will lead, in expectation, to higher compensation for the partners, since PE compensation agreements almost always change linearly with fund size. Given this setup, we derive an explicit formula calculating the effect of an incremental increase in fund performance today on expected future GP compensation.
buyout, venture capital, and real estate funds for which we have information on fund performance. The ability of managers to translate their skills to larger funds depends on the nature of the pro-duction process. Given Metrick and Yasuda’s (2010) finding that buyout funds are more scalable than venture funds, our theoretical framework suggests that the future fundraising of buyout funds should be more sensitive to performance than that of venture capital funds. In addition, learning about ability suggests that the performance of later funds (for example, a partnership’s third or fourth fund) should have less impact on the assessment of ability and hence be less strongly related to future inflows of capital than would similar performance in a partnership’s first fund.
Our empirical results are consistent with these predictions. For buyout, venture capital, and real estate funds, both the probability of raising a follow-on fund and the size of the follow-on conditional on raising one are significantly positively related to the performance of the current fund. The magnitude of these relations varies with the scalability of the investments. Buyout funds, which are the most scalable, have the strongest relations, while venture capital funds, which are the least scalable, have the weakest relation.
Importantly, we find that these relations are stronger for funds that are earlier in a partnership’s sequence of funds, that is, younger partnerships have stronger relations between future fundraising and current fund returns than older partnerships. This suggests that fund flows in the private equity industry reflect learning about ability over time, and that the strength of the market-based, implicit pay for performance facing a private equity partnership depends on the extent of its prior track record.3
Given these estimates of the sensitivity of future fundraising to current performance, we next turn to calculating the magnitude of the pay-performance relation facing general partners, and consider the relative magnitudes of its explicit (from carried interest in the current fund) and implicit (from future fundraising) components. Our theoretical framework provides an explicit formula for the change in general partners’ lifetime incomes as a function of the return of the current fund. To perform the calculations, we use this formula, our estimates of the sensitivity of future fundraising to current performance, parameters reflecting the characteristics of our sample of private equity 3It is likely that similar patterns hold in the flow-performance relations for other asset mangement settings, in which learning is likely to play an important role in determining fund flows, such as mutual funds (e.g. Berk and Green, 2004) and hedge funds. In the mutual fund literature, the possibility that the sensitivity of flows to performance depends on fund age is generally ignored. A notable exception is Chevalier and Ellison (1997), who find that the sensitivity is indeed larger for younger funds.
funds, and estimates of expected carried interest and management fees taken from Metrick and Yasuda’s (2010) simulations.
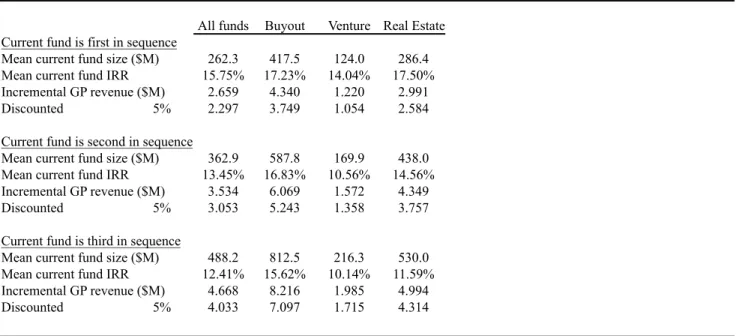
For an average-sized first-time buyout fund in our sample ($417.5 million), we estimate that for an extra percentage point of return (IRR) to limited partners in the current fund, general partners receive on average an extra $3.75 million in direct fees in the current fund.4 For this fund, estimates of expected incremental revenue from future funds for each additional percentage point of IRR in the current fund (using the median of the expected compensation estimates from Metrick and Yasuda (2010)), vary from $5.42 million if we assume the GP potentially runs up to three more funds to $11.30 million if instead the GP potentially runs up to five more funds. An alternative approach is to calculate the expected incremental GP revenue from future funds per extra dollar returned to limited partners in the current fund. For every extra dollar returned to LPs in the current fund, the GP earns $0.25 in carry (assuming that the carry is “in the money”)5, while estimates of incremental revenue from future funds for the average first-time buyout fund are $0.315 to $0.657. Both approaches yield the same ratios of estimated implicit to explicit pay for performance, which are 1.45 to 3.02.
We also perform the same calculations for venture capital and real estate funds. Expected compensation from future fundraising is less sensitive to current performance for these types of funds than for buyout funds, with venture capital funds displaying the least sensitivity. For an average-sized first-time venture capital fund, estimates of incremental GP revenue from future funds per incremental dollar of returns to LPs in the current fund range from $0.105 to $0.133, depending on whether the GP potentially runs up to three or up to five more funds. For an average-sized first-time real estate fund, the corresponding estimates are $0.329 to $0.516. The corresponding ratios of estimated implicit to explicit pay for performance are 0.48 to 0.61 for venture capital funds and 1.51 to 2.37 for real estate funds.
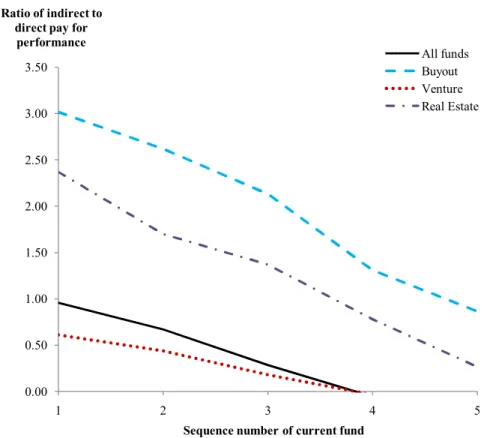
Consistent with the learning framework, the ratio declines in the sequence of funds for all types of funds. The decline is fairly weak for buyout funds, sharper for real estate funds, and sharpest for venture capital funds. Assuming the GP potentially runs up to five future funds in addition 4For consistency with Metrick and Yasuda (2010), all dollar amounts are present values using a discount rate of 5%.
5Using a typical carry of 20%, for LPs to receive an extra dollar, the fund must earn an extra $1.25 in profits, with $0.25 going to the GPs.
to the current fund (regardless of the current fund’s position in a partnership’s sequence of funds), our estimates of the ratios of implicit to explicit pay for performance for buyout funds are 3.02 if the current fund is the first in a buyout partnership’s sequence, 2.62 if the current fund is the second in sequence, and 2.13 if the current fund is the third in sequence. For real estate funds, the corresponding ratios of implicit to explicit pay for performance are 2.37, 1.70, and 1.37. For venture capital funds, they are 0.61, 0.44, and 0.18.
Overall, the estimates indicate that implicit pay for performance from future fundraising is an important component of the total pay for performance relation facing private equity GPs, and of approximately the same order of magnitude as explicit pay for performance from carried interest. Consistent with the learning framework, which suggests that the sensitivity of future fundraising to current performance should depend on the extent to which current performance adds incremental information to the market’s assessment of the general partners’ abilities, we find that implicit pay for performance, relative to the explicit component, declines in a partnership’s sequence of funds. Indeed, we find that if we calculate implicit pay for performance using estimates of the relation between future fundraising and current performance that ignore sequence effects, the estimates we obtain are significantly larger, particularly for venture capital funds.
This paper is related to a number of different literatures. Our finding that implicit pay for performance from future fundraising is an important component of total pay for performance in private equity buttresses the arguments in prior work that the incentives of GPs are an important reason for value improvements in private equity transactions. Kaplan (1989) and Smith (1990) document that operating profitability increases following buyouts, although this pattern appears weaker for more recent buyouts (Guo, Hotchkiss, and Song, 2010). Jensen (1989) and Kaplan and Stromberg (2009) attribute these value increases in large part to the incentives facing general partners, although both focus on direct rather than indirect incentives. Kaplan and Stromberg (2001, 2003, 2005) and Hart (2001) emphasize the role of GPs’ value-maximizing incentives in explaining the complexity and optimality of venture capital financing contracts. Kaplan and Schoar (2005), in perhaps the most related analysis to that done here, emphasize the talent of particular partnerships and find that the size of future funds is positively related to historical performance, but do not explictly consider how performance affects the ability to raise future funds as opposed to the size of future funds, nor how this sensitivity varies in the cross-section of partnerships or in
the sequence of funds raised by a given partnership. None of this work attempts to estimate the magnitude of the effect of today’s performance on GPs’ future income.
Our results are also related to Metrick and Yasuda (2010), who find, based on the explicit terms of the partnership agreement, that approximately two-thirds of expected revenue to GPs from the current fund comes from fixed-revenue components that are not sensitive to performance. Our results suggest that their calculations understate the total incentive compensation that general partners have, and that performance-based compensation in private equity partnerships is larger than previously thought.
Our results on the declining strength of implicit pay for performance in the sequence of funds are also consistent with the darker view of implicit pay for performance in private equity advanced by Gompers (1996), who shows that younger venture capital partnerships are more likely to “grand-stand” by taking portfolio companies public prematurely in an effort to boost performance to aid in fundraising. While Gompers (1996) implicitly assumes that fundraising is more sensitive to perfor-mance for younger partnerships, our paper is the first to document this relation this empirically. An interesting topic for future research is to understand how young buyout partnerships, who we show have the strongest implicit pay for performance relation among different types of private equity funds, respond to the resulting incentives.
Closely related to this work is a large literature on mutual fund inflows and their relation to historical performance. Ippolito (1992), Chevalier and Ellison (1997), Sirri and Tufano (1998), Barclay, Pearson and Weisbach (1998), and Sensoy (2009) all estimate regressions predicting the inflows to mutual funds as a function of a fund’s historical performance, and find a strongly positive (nonlinear) relation. While our framework is couched in terms of the private equity industry, our approach can be readily adapted to other settings in which implicit pay for performance stems from the effect of current performance on inflows of new investments, such as the mutual fund and hedge fund industries. Adapting our framework to quantify the total pay for performance relations facing mutual fund and hedge fund managers is an interesting topic for future research.
More generally, our work adds empirical evidence on the idea pioneered by Fama (1980) that market-based mechanisms can be an important source of pay for performance incentives. Despite the potential importance of implicit incentives in a variety of settings, little is known about their actual magnitudes. The explicit (and observable) compensation formulas in private equity partnerships,
together with the empirical relation between fund performance and future fundraising, allow for quantification of both implicit and explicit pay for performance in private equity, which in other contexts clearly exist but are hard to measure. In doing so, our work is in the spirit of Gibbons and Murphy (1992), who emphasize the importance of understanding total, rather than only explicit, pay for performance. Given the magnitude of the decline in implicit pay for performance over a partnership’s life, our estimates imply that total pay for performance declines over a partnership’s life. The extent to which this compensation system is efficient, and why explicit pay for performance does not typically adjust enough in later funds to offset this decline, is an interesting question for future research.
The remainder of this paper proceeds as follows: Section II lays out the theoretical framework described above. Section III describes the database of private equity funds used in the analysis. Section IV presents estimates of the effect of today’s fund returns on future fundraising. Section V performs calculations that transform these estimates into pay for perforamance relations, using the theoretical framework in Section II as a basis for the calculations. Section VI discusses the implications of this work and concludes.
II. Theoretical Framework
In this section we present a theoretical framework in which investors assign cash flows to private equity partnerships based on their perceptions of GPs’ abilities to earn profits. Investors observe the returns earned by a partnership, and based on their posterior estimate of GP ability collectively decide first, whether to invest in the GP’s next fund (i.e., whether the GP is able to raise another fund), and second, how much to invest. Given that the compensation system in private equity partnerships is almost always a linear function of fund size (Gompers and Lerner, 1999)6, we show that this capital allocation process leads to a strong relation between performance in a current fund and that fund’s general partners’ future compensation.
6Gompers and Lerner (1999) document that the most successful partnerships are sometimes able to increase their carry percentage in future funds. We do not have information on the carry percentage of specific funds, and therefore cannot formally incorporate this effect into our empirical analysis. Because this effect results in higher compensation in future funds for a given level of performance, by omitting it we understate the magnitude of the effect of current performance on future compensation, especially for first-time funds. We thank Josh Lerner for pointing this out.
A. Setup
To formalize this idea, we assume that a particular GP currently manages a fund and could
po-tentially manage up to N more funds in sequence in the future. The GP has ability equal to θ,
which is a measure of his ability to earn returns through private equity investing.7 We assume that
θis unobservable and that there is symmetric information, so all agents, including the GP himself,
have the same estimate of its value.8 We also assume that θ is constant over time for a particu-lar partnership, which abstracts away from issues of changing partnership composition, investment environments, or changing ability over time due to health or other considerations.
Letidenote the sequence of funds managed by a given GP,ri be the net return to LPs for fund
i, Ii be the size (committed capital) of fund i, and Ii∗k(ri) be the total revenue earned by the
GP for managing fund i, where k(r) is an increasing and differentiable function, representing the fraction of the initial size of the fund that is earned by the GP if performance isr. The functionk(r) represents the total profits from running a fund that has a return equal to r, including management fees, carried interest, and other income earned by the fund, such as additional fees earned by funds for managing portfolio companies. We characterize GP compensation in this manner following Metrick and Yasuda (2010), who provide estimates for k(.) using a simulation approach.
We assume that the fund returns are increasing (in expectation) with the GP’s ability,θ,
specif-ically, thatri ∼N �
θ,1s� for all i, where s is the precision of the distribution. Before any returns are observed, the commonly held prior assessment ofθisθ0∼N
�
θ,τ1�.9 Under these assumptions, after observing the returns onifunds, the market’s updated assessment ofθ,θi,is given by:
θi =
τ θ0+s�iri
τ +is (1)
for alli (DeGroot, 1970 provides a derivation of this Bayesian updating formula).
7It is possible that GPs could be rewarded through future fundraising for either absolute or relative (abnormal) returns. Our empirical analysis examines both possibilities.
8The assumption that there is symmetric information about managers’ abilities dates to Holmstrom (1982), and has been used in similar learning models by Gibbons and Murphy (1992), Hermalin and Weisbach (1998, 2009), and others. Implicitly, the idea is that anyone who can become a GP is smart, hard-working, well-educated, etc., but the key factor determining who can earn (abnormal) returns is an unobservable match between the individual and the tasks associated with earning profits as a general partner.
9θ0represents the expected skill of a particular GP conditional on all observable characteristics prior to any returns being observed. Different GPs will therefore have different values ofθ0 from one another and consequently can raise initial funds of different sizes.
We assume that investors base their decision about whether and how much capital to allocate to the GP’s fund based on this updated assessment ofθ. Specifically, a GP is able to raise a follow-on
fund to fundiwith probabilityp(θi), wherep(.)is a weakly increasing, differentiable function with
range[0,1]. If investors decide to allocate capital to the GP’s next fund, the amount they allocate is given by f(θi), wheref(.) is a weakly increasing, differentiable function with range (0,∞]. We
assume the GP could potentially run a total of N + 1 funds over his lifetime (i.e, the initial fund plus up toN more). Thus the expected size of the follow-on fund is equal top(θi)f(θi). The upper
bound on the number of future funds, N, is exogenously determined (e.g., a function of the GP’s
initial age). Importantly, we assume that if the GP ever fails to raise a follow-on, he cannot raise any funds subsequent to that point.
B. Cross-sectional implications
This simple learning model characterizes the way that fund returns affect future fundraising and, consequently, the future expected compensation for the funds’ partners. Conditional on the sequence
of returns earned in the first i funds, the expected size of the next fund is given by EIi+1 =
p(θi)f(θi)=p � τ α0+s�iri τ+is � f � τ α0+s�iri τ+is �
, for i≤N, and zero fori=N.
B. 1. Sensitivity of future fundraising to current performance across partnership types
The sensitivity of future fundraising to current performance is governed by the derivatives of p(θi)
andf(θi)with respect tori, which are equal top�(θi)τ+sis andf�(θi)τ+sis, respectively. Intuitively,
a more steeply slopedp(.)function means that for a small increase in ability, the market is relatively more willing to allocate capital to a fund, presumably because the fund can profitably invest rela-tively large increases in capital, i.e., the fund is more “scalable”. Holdingifixed, a larger weighting
term s
τ+is reflects a greater relative infomativeness of the return to the market’s perception of the
GP’s ability.
We expect buyout funds to be more scalable, and hence exhibit a largerf�(.), than other types of funds, particularly venture funds. For example, if a manager is shown to be talented at buying out companies and increasing value, he can likely buy out larger companies and increase value similarly to what he has done with smaller companies if the market is willing to fund these investments. In contrast, if a manager has demonstrated that she is talented at investing in startup companies,
she is unlikely to be able to increase fund size much because the size of startup investments is not scalable (and because it is not feasible to simply increase the number of investments given that increasing value is a time-consuming process).10 It is less clear for what types of funds we would expect p�(.) to be greater. We conjecture that p�(.)might be higher for buyout funds than venture for the same scalability reasons. In buyout, marginal underperformers may be more likely to be shut out of future fundraising completely because the more successful buyout partnerships can scale up to absorb the demand of investors. In contrast, even the most successful venture capital partnerships can only deploy a relatively limited pool of capital effictively, which limits the ability of partnerships to leverage high returns into substantially larger future funds. We also conjecture that the informativeness of returns is likely to be greater for buyout funds than for venture capital funds, to the extent that if a venture fund outperforms, it is typically due to the success of a small number of investments in the fund’s portfolio. It is generally more difficult to tell skill from luck if the bulk of returns are generated by a few extremely successful investments.
B. 2. Sensitivity of future fundraising to current performance in the sequence of funds within a partnership
Holdingθi fixed, bothp�(θi)τ+sis andf�(θi)τ+sis are decreasing in ibecause of the weighting term s
τ+is. Intuitively, as partnerships progress through time, the partnership’s θ becomes known more
precisely, so that the optimal updating rule means that subsequent θs do not change as much
as earlier θs for a given return. For this reason, it seems likely that both the sensitivity of the
probability of raising a follow-on fund to current performance and the sensitivity of follow-on size to future performance are decreasing in fund sequence. The weighting term strictly decreases as the numerator is s in each one, while the denominator increases with the sequence number. Ifp(.) or f(.) is linear, the prediction is unambiguous. However, if p(.) or f(.) is convex and θi+1 >θi, or
if p(.) or f(.) is concave andθi+1 <θi, the pattern may go the other way. That said, even if the
functions are highly nonlinear, on average we would not expect θi+1 to differ much from θi, so it
seems likely that the weighting term effect will dominate. Consequently, in the data we expect to 10Consistent with this logic is the fact that the most successful buyout funds such as KKR and Blackstone have steadily increased the size of their funds to the point where the largest funds are between $15 and $20 billion in committed capital, while the most successful Silicon Valley venture capitalists such as Kleiner Perkins and Sequoia have remained at or under $1 billion in committed capital. Metrick and Yasuda (2010) also find consistent evidence examining the organizational structure of buyout partnerships compared to venture capital partnerships.
observe a decreasing sensitivity of future fund size to current performance as a given partnership manages subsequent funds.
C. Lifetime compensation of GPs
The total expected revenue earned by the GP over his lifetime is given by: T R=k(r1)f(θ0)+k(r2)p(θ1)f(θ1)+k(r3)p(θ1)p(θ2)f(θ2)+. . .+k(rN+1)
N � i=1
p(θi)f(θN). (2)
This formulation assumes that, following practice, GPs are compensated with a combination of management fees, which are a function of committed capital, and carried interest, which is a function of returns times the amount of capital in the fund. We think of the k(.) function as incorporating these two elements, plus other fee income that is likely to be proportional to fund size. We assume
that the maximum number of funds the GP will ever run isN + 1. If the GP ever fails to raise a
follow-on fund, he earns no future income from managing private equity investments. For example, income from the third fund is only obtained if a second fund is raised. Hence the expected revenue from the third fund is a function of the probability that the third fund is raised conditional on the assessment of ability following the second fund (which is given by p(θ2)) multiplied by the
probability that the second fund is raised (which is given byp(θ1)).
We are interested in calculating the magnitude of the pay-performance relation facing general partners and decomposing it into the direct component, from carried interest in the current fund, and the indirect component, from greater probability of raising future funds and greater future fund size conditional on raising future funds. In other words, we are interested in calculating how much of incremental profits GPs expect to keep, and how much of this additional revenue comes in the form of direct vs. indirect compensation.11
The pay-performance relation facing the GP is the sensitivity of total lifetime revenue to r1,
which is given by:
11We refer to revenue and compensation synonymously throughout the paper. In fact, private equity partnerships do have some (but not many) costs that create a wedge between revenue and partner compensation. However, many of these costs, such as the costs of renting an office and hiring support staff, are more or less fixed and do not affect marginal compensation. In addition, our focus is on the indirect aspects of compensation and its size relative to direct compensation and it seems unlikely that this ratio would be substantially affected by ignoring direct costs in our calculations.
∂T R ∂r1 = k�(r1)f(θ0) + k(r2) [p�(θ1)f(θ1) +p(θ1)f�(θ1)]τ+ss + k(r3) � p�(θ1)p(θ2)f(θ2)τ+ss+p(θ1)p�(θ2)f(θ2)τ+2s s+p(θ1)p(θ2)f�(θ2)τ+2s s � + . . . + k(rN+1) � f(θN)�Ni=1 � p�(θi)τ+sis�Nj=1,i�=jp(θj) � +�N i=1p(θi)f�(θN)τ+sN s � . (3)
The terms above have natural interpretations. The first line in the expression above is the direct effect from carried interest in the current fund. This is the explicit component of the total pay-performance relation facing the GP. The following lines give the implicit component. The second line is the incremental expected revenue from the next fund. Intuitively, improving performance has two effects on incremental revenue from the next fund. The first term in brackets represents the increase in the probability that a follow-on fund will be raised multiplied by the size of the follow-on fund conditional on one being raised. The second term in brackets represents the probability of raising a follow-on multiplied by the increase in fund size conditional on one being raised. Similarly, the third line is the incremental expected revenue from the third fund. The three components in brackets represent, respectively, the increments to expected fund size from the increase in probability of raising the second fund, the increase in probability of raising the third fund, and the increase
in size of the third fund. The weighting terms, of the form s
τ+is, represent the extent to which an
incremental change inraffects the update ofθ. These terms are declining in the sequence of returns
because the prior estimate of ability is more precise when more returns have been observed. The k(.)terms outside the brackets represent the expected fraction of future fund sizes that accrues to the GPs as revenue.
Our goal is to provide empirical estimates of the derivative ∂T R
∂r1 , and to compare the magnitude of the first term, which represents explicit pay for performance in the current fund, to that of the sum of the following terms, which represent implicit pay for performance stemming from the effect of current performance on future fundraising.
D. Empirical Implementation
We base our estimates of incremental expected revenue to the GPs from the current fund, k�(r1),
on the standard 2% management fee plus 20% carried interest fee structure. For the k(.) terms
for future funds, we use the estimates provided by Metrick and Yasuda (2010), who calculate via simulation the expected fraction of a fund’s total committed capital (size) that accrues as revenue to the GPs. For the p(.) and f(.) terms, we use the respective averages in our data sample: the fraction of funds that raise a follow-on, and the average size of follow-on funds conditional on raising a follow-on. Where appropriate, we compute these averages within fund type and/or sequence number. We obtain estimates of the p�(θi)τ+sis and f�(θi)τ+sis terms using regressions
that estimate the sensitivities of, respectively, the probability of raising a follow-on fund, and the size of the follow-on fund conditional on raising one, to current performance. We present the data we use to obtain these estimates, and describe the estimation methodology in more detail, in the the sections below. First, we discuss the generalizability of our framework to related settings. E. Generalizing to other settings
An advantage of the theoretical framework outlined above is that it can be readily adapted to other settings, notably other asset management applications, in which implicit pay for performance arises from a relation between current performance and inflows of new investments, together with a com-pensation structure that pays managers, at least in part, as a function of assets under management. Both mutual funds and hedge funds share this feature with private equity in practice, and both are settings in which implicit pay for performance is likely to be an important component of total pay for performance.
A key difference between mutual funds and hedge funds compared to private equity is that the former are typically open-ended, and so fundraising in these industries is in fact a continuous process, and not a discrete event as in private equity. However, because the econometrician cannot observe fund flows continuously, the adaptations necessary to apply our framework to this case are modest. To account for this difference in our framework, one could imagine a manager potentially managing a fund for a some upper bound number of time periods (where the periodicity corresponds to the unit of observation for fund flows, e.g. years), and in each time period both flows and the likelihood
of being fired are a function of past returns. Our learning setup, and the consequent decreasing sensitivity of flows to performance with age, seems appropriate for these settings as well.12
A complicating factor is that in these industries, unlike private equity, there is potentially an important wedge between the compensation of the fund managers (even taken as a group) and the fund management company. For example, while mutual fund companies receive a percentage of assets under management as revenue and cannot be fired except by a reduction of fund size to zero, mutual fund managers themselves can be fired, and little is known about their compensation structure conditional on remaining employed.13 For these reasons, it may be easier to obtain reliable estimates of the implicit pay for performance relation facing mutual fund companies rather than the mutual fund managers themselves.
III. Data
To provide estimates of the total pay-performance relation facing private equity GPs, and the relative magnitudes of its explicit and implicit components, we rely on fund-level data provided by Preqin. We consider the three major types of private equity funds: buyout, venture capital, and real estate. There are a total of 9,523 buyout, venture capital, and real estate funds in Preqin as of June 2009, which, according to Preqin, covers about 70% of all capital ever raised in the private equity industry. In addition, in private communication Preqin informs us that about 85% of their data is collected via Freedom of Information Act requests made to limited partners subject to the Act and thereby is not subject to self-reporting biases. While we cannot independently verify these claims, our data appear similar on key dimensions (notably performance) to that used in prior work.14
In all of our analysis, we exclude funds without vintage year data (64), without fund size (committed capital) data (1,137), and which are still being raised (78). We begin by constructing a sample of “preceding”, or current, funds. To obtain estimates of the sensitivities of the likelihood of raising a follow-on fund, and the size of the follow-on conditional on raising one, to current
12Berk and Green (2004) present a model of mutual fund flows based on learning.
13Chevalier and Ellison (1999) explore agency problems between mutual fund managers and mutual fund manage-ment companies.
14In addition, any selection bias would likely oversample funds with good performance that do raise a follow-on fund. This would have the effect of downward-biasing our estimates of the relation between future fundraising and current performance. In the extreme, if every fund in the data raises a follow-on, the relation between current perforamance and ability to raise a follow-on fund is zero.
performance, we require a sample of funds for which performance (IRR) data are available. From this sample of funds, we follow Kaplan and Schoar (2005) and drop funds with less than $5m (in 1990 dollars) in committed capital, to reduce the influence of potentially extreme growth rates of small funds on our results. In addition, to allow for sufficient time to ascertain whether a fund raises a follow-on, we drop funds raised after 2005. Finally, when a private equity firm raises multiple funds in a given year, we aggregate funds in that year and compute the fund size weighted IRR. There are two exceptions to this. The first is a few cases in which the same partnership manages, say, both buyout and real estate funds. In those cases, we treat the partnership as two separate partnerships, one each for buyout and real estate funds. We do so to ensure, for example, that a real estate fund cannot be a follow-on fund to a buyout fund. The second (rare) exception is when
the same partnership manages funds of the same type but different geographical focus, such as a
fund focusing on on European buyouts and another focusing on Asian buyouts. In this case, we treat the European buyout funds and Asian buyout funds as two separate partnerships.
This sample construction leaves us with a final sample of 1,745 preceding funds. The sample consists of 645 (37%) buyout funds, 851 (49%) venture capital funds, and 249 (14%) real estate funds. For each of these preceding funds, we ask whether we observe a follow-on fund in the database. We define a follow-on fund as the next fund raised by the same partnership for which we have information on fund size (we do not require information on the performance of the follow-on fund). Thus each preceding fund is allowed to have at most one follow-on fund. If we observe a on fund raised by the end of our sample period (June 2009), we record the size of the follow-on fund and compute the growth rate in fund size from the preceding fund to the follow-follow-on fund. If we do not observe a follow-on fund in the data, or if the data indicate follow-on funds but do not provide size information, we treat this as if the partnership did not raise a follow-on fund. The working assumption we use throughout the paper is that the absence of a follow-on fund with size
information in the data means the partnership was unable to raise one.15 Of the 1745 preceding
funds, 1469 (84.2%) raise a follow-on fund. By fund type, the breakdown is 549 of 645 buyout funds (85.1%), 681 of 851 venture capital funds (80.0%), and 239 of 249 real estate funds (96.0%).
15This assumption has the effect of downwardbiasing our estimates of the relation between current performance and future fundraising. Undoubtedly some partnerships do raise follow-on funds that are missing from the data because the data are incomplete. Additionally, in practice partnerships sometimes dissolve even though the market would have been willing to provide capital for a follow-on fund had the partnership desired one.
Table I presents descriptive statistics for this sample of preceding and follow-on funds. Panel A reports that the sample represents 843 distinct partnerships: 314 buyout, 412 venture capital, and 117 real estate. The distribution of number of preceding funds per partnership is clearly skewed, with many partnerships having just one or two preceding funds and a few substantially more (the maximum in the sample is 12 preceding funds). Note that these are the numbers of preceding funds used in our analysis, i.e., those that meet the data requirements described above, and therefore understate the true number of funds per partnership.
Panel B of Table I reports descriptive statistics on preceding fund size and performance (IRR), follow-on fund size and growth in size from preceding to follow-on funds, and the time elapsed between successive fundraisings, i.e. the difference between the vintage years of the preceding and follow-on funds. The latter three statistics are all conditional on raising a follow-on fund.
The mean (median) preceding fund size is $497.9 ($210.0) million for all funds taken together, $866.4 ($380.0) million for buyout funds, $217.7 ($125.0) million for venture capital funds, and $501.0 ($314.9) million for real estate funds. These distributions mirror the familiar facts that buyout funds are typically larger than venture capital funds (with real estate in between), and that the distribution of private equity fund size is right-skewed.
The mean (median) preceding fund performance is 15.1% (10.6%) for all funds taken together, 16.5% (14.3%) for buyout funds, 14.1% (5.8%) for venture capital funds, and 14.6% (14.1%) for real estate funds. These numbers are similar to those in Kaplan and Schoar (2005), who report average returns of 19% for buyout funds and 17% for venture capital funds (p. 1798). The similarity with
Kaplan and Schoar (2005), who use a different data source (Venture Economics) and a different
time period (their sample ends in 2001), is reassurance that our data do not suffer from important biases missing from data used in prior work.
The mean (median) follow-on fund size, conditional on raising one, is $792.2 ($314.0) million for all funds taken together, $1,465.3 ($632.6) million for buyout funds, $283.9 ($181.0) million for venture capital funds, and $694.2 ($425.0) million for real estate funds. The mean (median) growth in fund size from preceding to follow-on fund, conditional on raising a follow-on, is 92.4% (53.8%) for all funds taken together, 110.9% (70.0%) for buyout funds, 78.6% (42.9%) for venture capital funds, and 89.7% (48.9%) for real estate funds. These statistics show that follow-on funds are much larger than preceding funds, and are suggestive of the importance of implicit pay for performance
through future fundraising in private equity.
The time between successive fundraisings averages 3.3 years for the entire sample, 3.8 years for buyout funds, 3.3 years for venture capital funds, and 2.4 years for real estate funds.
Table II reports the same fund characteristics broken out by the fund’s position in the partner-ship’s sequence of funds. We compute a fund’s sequence number relative to all funds of a given partnership in the Preqin database. Table II shows that higher sequence number funds are substan-tially larger than lower sequence number funds, both because they represent successful partnerships and also because they tend to be located later in time when funds were larger. The growth rate in fund size from preceding to follow-on funds tends to decrease in the sequence of funds. Performance generally increases in the sequence of funds, indicating that partnerships with good performance, and for whom performance is more likely to persist, are more likely to raise follow-on funds. The time between successive fundraisings generally decreases in the sequence of funds, suggesting that older partnerships are more able to raise new funds on the basis of their past track records and rely less on realized performance in the current fund to raise new funds. This is consistent with the learning framework of Section II. Further consistent with this, the percentage of preceding funds that raise a follow-on is generally increasing in the sequence of funds.
IV. The Empirical Relation between Current Performance and
Future Fundraising
In this section, we estimate the sensitivities of the probability of raising a follow-on fund, and the sensitivity of the size of the follow-on fund conditional on raising one, to current performance. In doing so, we have two goals. First, the regressions allow us to test the predictions developed in Section II concerning variation in these sensitivities in the cross-section of funds and in the sequence of funds within a partnership. Second, we use the regression coefficients to obtain estimates of the p�(θi)τ+sis and f�(θi)τ+sis terms in equation (3), which are necessary inputs to calculating the
A. Base-case estimates of the sensitivity of future fundraising to current perfor-mance
Table III reports estimates of the relation between future and current performance that do not consider the possibility that the sensitivities can vary in the sequence of funds, as predicted by the learning framework presented in Section II. As we discuss in more detail below, these estimates provide a useful benchmark to assess the extent to which estimates of implicit pay for performance in private equity (and likely in related settings) are overstated if the sensitivity of future fund flows to current performance is declining in partnership age.
In Table III, columns labeled “(1)” use the IRR of the “current” (preceding) fund as the sole regressor, and columns labeled “(2)” contain vintage year (of the preceding fund) fixed effects to control any market-wide, time-varying factors that potentially affect the ability to raise a follow-on fund, and to control for systematic differences in fund performance across different vintage years. These factors are likely to be important in light of the well-documented cyclicality of the private equity market. In all specifications, we cluster standard errors at the partnership level, following Kaplan and Schoar (2005). In addition, we estimate but to conserve space do not report regressions using as the independent variable the preceding fund IRR minus the preceding fund’s benchmark IRR provided by Preqin. Preqin defines the benchmark IRR as the average IRR of all funds of the same type, vintage year, and geographic focus. Our results using this “risk-adjusted” measure of IRR are virtually identical to those reported below.
Panel A of Table III presents marginal effects, evaluated at the mean, from probit regressions predicting the probability of raising a follow-on fund as a function of current (preceding) fund per-formance (IRR). The relation between current perper-formance and the likelihood of raising a follow-on is economically and statistically significantly positive for all funds taken as a whole (with fund type dummies included), and for each type of fund (buyout, venture capital, and real estate) considered separately. The point estimates from the specifications with vintage year fixed effects are slightly larger than those from the specifications without, and the regressions have larger R2. In terms of magnitude, the marginal effects for the “All Funds” regressions imply that a one percentage point improvement in IRR relative to the sample mean is associated with a 0.316-0.324 percentage point increase in the probabilty of raising a follow-on fund. Consistent with scalability arguments and
the theoretical framework of Section II, the estimated marginal effects are larger for buyout funds (0.467-0.588 percentage points) compared to venture capital funds (0.288-0.297 percentage points), and the differences in the probit coefficients between buyout funds and venture capital fundsare statistically significant.16 The differences between buyout and real estate, and between venture capital and real estate, are not statistically significant. In unreported analysis, we obtain similar results using linear probability (i.e., OLS) models instead of probit. The estimated OLS coefficients are similar in magnitude and statistical significance to the estimated marginal effects at the mean from the probit specifications.
Panel B of Table III presents OLS regressions predicting the growth in fund size from preceding to follow-on fund as a function of IRR, for preceding funds that raise a follow-on fund. Growth in fund size is defined as follow-on fund size divided by preceding fund size minus one. The estimates indicate that current performance is strongly positively related to follow-on fund size. The coefficients are all positive and are all statistically significant except those for venture capital funds. The magnitudes of the coefficients in the “All Funds” regressions imply that a one percentage point increase in IRR is associated with a 0.623-0.663 percentage point increase in fund growth. As in Panel A, the estimated effects for buyout funds (2.152 - 2.314 percentage points) are considerably larger than those for venture capital funds (0.426-0.492 percentage points), with real estate in between
(1.723-1.955 percentage points). The differences between buyout and venture capital, and between real
estate and venture capital, and statistically significant, while the differences between buyout and real estate are not.
Panel C of Table III reports analogous regressions in which the dependent variable is the natural logarithm of fund growth plus two, i.e. the natural logarithm of follow-on fund size divided by preceding fund size plus one. (We add one to avoid taking the logarithm of a number close to zero.) To the extent that the distribution of growth rates in the data is skewed (especially likely for venture capital funds), a logarithmic specification may fit the data better. Consistent with this, theR2 values in Panel C are generally considerably higher than those in Panel B. Once again, the
estimates indicate that current performance is strongly positively related to follow-on fund size. The coefficients are all positive and statistically significant, and the estimated effects for buyout 16Here and in all similar tests, we assess statistical significance by pooling the observations of buyout and venture capital funds into a single regression, and including an interaction of IRR with a dummy variable indicating fund type (either). A significant coefficient on the interaction term indicates a significant difference across fund types.
funds and real estate funds are significantly larger than those for venture capital funds.
As an additional robustness check, in unreported analysis we repeat the analysis of Table III, eliminating all preceding funds for which the time to next fundrasing is less than three years, and find similar results. Among other things, this adresses the possibility that some large fund companies operate multiple types of funds simultaneously, such as one focusing on American buyouts and another focusing on European ones. The performance of the American funds may be reflective of the ability of the American partners and relatively uninformative about their European counterparts (although to the extent tha ability is partnership-specific rather than person-specific, this is not of concern). In this case, there are likely to be multiple fundraisings shortly after one another but the reason for one being able to raise a large fund may have little relation to the performance of some of the partnership’s other funds’ performance.
Overall, the evidence in Table III strongly supports the idea that implicit pay for performance from the possibility of future fundraising is likely to be an important component of the total pay-performance relation facing private equity GPs. Both the probability of raising a follow-on fund, and the size of the follow-on conditional on raising one, are strongly positively related to the performance of the current fund. In addition, these sensitivities are statistically and economically larger for buyout funds (and to some extent real estate funds) compared to venture capital funds, consistent with the idea that buyout is the most scalable and venture capital the least. In terms of the theoretical framework in Section II, this result suggests that buyout funds have the largest p�(.) and f�(.), and venture capital funds the least.
B. Sequence-specific estimates of the sensitivity of future fundraising to current performance
The estimates presented in Table III do not consider the prediction of the learning-based framework in Section II, that the sensitivity of future fundraising to current performance is declining in the sequence of funds managed by a given partnership. To test this prediction, in Table IV we reestimate the equations from Table III, including variables for the preceding fund’s sequence number as well as the sequence number interacted with IRR. We present results from specifications using the preceding fund’s IRR “(1)”, and the preceding fund’s IRR augmented by vintage year fixed effects “(2)”.17
Panel A of Table IV presents regressions predicting the probability of raising a follow-on fund. In Panel A, we focus on linear probability models because of the difficulty interpreting marginal effects of interaction terms in probit specifications (and the potential bias in coefficient estimates resulting from including fixed effects in probit specifications).18As in Table III, we find that current performance is positively related to the probability of raising a follow-on fund for all funds taken together, for buyout funds, and for venture capital funds. The coefficients are of similar magnitude to those in Table III, and once again the difference between the coefficients for buyout and for venture capital funds is statistically significant. The coefficient on IRR for real estate funds is similar to that in Table III, but is estimated less precisely and insignificant. For all funds, and for buyout and venture capital funds individually, the coefficient on sequence number is positive and significant and the coefficient on the interaction of sequence number with IRR is negative and significant (the coefficients for real estate funds are insignificant). This pattern of coefficients is consistent with the learning framework of Section II. Higher sequence numbers are associated with funds that have done well historically and hence have high current assessments of ability, so they are more likely to raise a follow-on regardless of current performance, but ability is estimated more precisely over time, so the marginal impact of current returns on ability to raise a follow-on fund grows smaller over time.
Panel B of Table IV presents OLS regressions predicting growth in fund size conditional on raising a follow-on fund, analogous to those of Panel B of Table III. The coefficients on IRR are positive, statistically significant (with one exception), and generally larger in magnitude than those in Panel B of Table III. The coefficients on sequence number are all positive but not significant.
With the exception of buyout funds, the coefficients on the interaction of sequence number with
IRR are negative and significant.
Panel C of Table IV presents analogous regressions in which the dependent variable is the natural logarithm of growth in fund size plus two. As in Table III, theR2 values indicate that these
specifications fit the data better than those of Panel B. The coefficients on IRR are all positive, statistically significant, and larger in magnitude than those in Panel C of Table III. The coefficients on the interaction of sequence number with IRR are all negative and, with the exception of buyout funds, statitically significant. In both Panels B and C, the coefficients indicate that the sensitivity
of fund growth to performance is not significantly greater for buyout funds compared to venture capital funds for first-time funds, but that the gap between grows quickly in the sequence of funds. Overall, the evidence in Table IV supports the prediction of the learning-based framework in Section II that the sensitivity of future fundraising to current performance is declining in the se-quence of funds managed by a given partnership. For all fund types, either the sensitivity of the probability of raising a follow-on fund to current performance is significantly decreasing in sequence number, or the sensitivity of growth in fund size conditional on raising a follow-on fund to current performance is significantly decreasing in sequence number. For all funds taken together, and for venture capital funds indidvidually, both effects are statistically significant. For buyout funds, the effect is significant only through the probability of raising a follow-on, and for real estate, only through the growth in follow-on fund size. Whether only one effect is significant or both, the im-plication is that the sensitivity of expected follow-on fund size to current performance is declining in the sequence of funds for all fund types.
We conjecture that similar patterns likely hold in the flow-performance relations for other asset mangement settings, in which learning is likely to play an important role in determining fund flows, such as mutual funds (e.g. Berk and Green, 2004) and hedge funds. In the mutual fund literature, with the notable exception of Chevalier and Ellison (1997), the possibility that the sensitivity of flows to performance depends on fund age is generally ignored.
C. Measurement issues
In all of the regressions presented in this section, we use the final or ultimate IRR of the fund as the measure of the fund’s performance. A concern with doing so is that a fund’s ultimate performance is not known with certainty at the time the next fund is raised. The summary statistics presented in Table I show that the typical fund that raises a follow-on does so after 3 years of life, while final performance is not known until the end of the partnership’s life. The key question is whether final, ex post IRR is a reasonable proxy for the information about performance that a fund’s investors use in deciding whether and how much capital to allocate to a partnership’s next fund. There are several reasons to believe that the answer is “yes”.
First, Hochberg, Ljungqvist, and Vissing-Jorgensen (2010) present a model in which a fund’s current investors have soft information about the likely profitability of a fund’s investments
(ob-tained, for example, from close communication with the GPs), and use it when deciding whether to allocate capital to the partnership’s next fund. This soft information about performance is not re-flected in the hard information about performance, “interim IRR”, available at that time, and is not observable to the econometrician. This soft information becomes observable to the econometrician only ex post, as it is reflected in the fund’s final IRR. They find supporting evidence for this idea in that the performance of the follow-on fund (if one is raised) is strongly correlated with the first fund’s final IRR, but uncorrelated with the interim IRR that was available at the time the follow-on was raised. Given this, it seems likely that a fund’s final IRR is, if anything, a better proxy than its interim IRR for the information about performance investors in deciding whether to allocate capital to the partnership’s next fund. Second, even if the interim IRR is the more desirable measure, to the extent that it is imperfectly correlated with final IRR, the standard errors-in-variables prob-lem implies that our estimates will understate the sensitivity of future fundraising to performance. Kaplan and Schoar (2005) provide evidence that interim IRR (at 5 years) and final IRR are highly correlated, with correlation coefficients of about 0.90, consistent with the first few exits (or, in the case of venture capital, follow-on investments in portfolio companies) being strongly indicative of a fund’s ultimate performance.
Notwithstanding these arguments, in the Appendix we present regressions analogous to those in this section, but in which we use the interim IRR at time of fundraising as our measure of fund performance. While we have interim IRR data for only somewhat less than half of our sample funds, we obtain similar results to those presented in this section.
V. Estimating Pay for Performance
In this section, we use the theoretical framework discussed in Section II, together with the regression estimates presented in Section IV, to estimate the magnitude of the total pay for performance relation facing private equity GPs, and to compare the magnitudes of its explicit and implicit components. We consider two measures of pay for performance: the incremental revenue to GPs for an incremental dollar returned to LPs, and the incremental revenue to GPs for an incremental percentage point improvement in IRR.
A. Explicit (direct) pay for performance
We begin by estimating explicit pay for performance, or the change in revenue from the current fund the GP earns from an incremental improvement in performance. This is represented by the first term in equation (3) in Section II. We do this assuming the standard 20% carry, and that the baseline level of performance and fund size to which the increment is applied are equal to the relevant means in our sample (by type and sequence). The first two rows of Panel A of Table V display the relevant sample means for first-time funds. For all fund types, the baseline level of performance is positive (and greater than a potential hurdle rate of 8%), so the carry is in the money. The incremental revenue in the current fund to GPs for an incremental dollar returned to LPs is then $0.25.19 This is the metric emphasized by Jensen and Murphy (1990) in the context of CEOs of public companies.
To calculate the incremental revenue to GPs for an incremental percentage point improvement in IRR, it is necessary to make further assumptions. The IRR is an annualized return measure which has well-known problems such as the implicit assumption that intermediate distributions are reinvested at the IRR. To make things as simple as possible, and because our data are not sufficient to make more accurate calculations, we assume that all capital is called at once and all distributions are made at once. That is, we assume that each fund has a single capital call and a single distribution, and the time (denoted T) between the two matches the typical length of time in the data between the call of a dollar and the return of the profits associated with investing that dollar, which we take to be 3 years.
Under these assumptions, the total dollar return to limited partners in the first fund, D, is given byD=�(1 +r1)T −1
�
I1, wherer1 is the IRR of the first fund andI1 is the size (committed
capital) of the fund. Note that because IRR is a net-of-fee measure,D represents the total dollars to limited partners, not the total dollars earned by the fund (some of which go to the GP in the
form of management fees and carried interest). Let R be the revenue earned by the GP. Because
D(.) is an invertible function, we can use the chain rule to write: ∂∂RD = ∂∂rR 1
∂r1
∂D. Inverting D and
differentiating yields:
∂R ∂D = � 1 T I1 (1 +r1)1−T �∂R ∂r1 . (4)
This formula can be used to convert incremental revenue per extra dollar returned to LPs to incremental revenue per incremental percentage point of IRR, and vice versa.
Panel A of Table V displays the incremental revenue to GPs from extra carried interest in the current fund that arises from an incremental perncentage point improvement in IRR, calculated using this formula (with ∂R
∂D = 0.25) and the displayed sample parameters. For the average first-time
fund in our sample (size $262.3 million), improving IRR from a baseline of 15.75% to 16.75% results in $2.659 million in incremental revenue to the GP, or $2.297 million in present value using a discount rate of 5% (applied for three years, the assumed cash in/cash out time interval).20 For buyout funds the present value is larger, $3.749 million, reflecting both the larger average size of buyout funds and the higher baseline level of performance (because of compounding, a given increment to returns has a larger effect with a larger baseline). The present value for venture capital funds is the smallest ($1.054 million), and real estate funds fall in the middle ($2.991 million). Again, for all fund types, the incremental revenue to GPs for an incremental dollar returned to LPs is $0.25, or $0.216 in present value (discounted at 5% for three years).
B. Implicit (indirect) pay for performance
We now turn to estimating implicit pay for performance arising from the effect of current perfor-mance on future fundraising. This effect corresponds to the second and above lines in equation (3) of Section II. This equation allows us to interpret our econometric estimates as estimates of the magnitude of implicit pay for performance in private equity. We perform this calcluation both in absolute terms and relative to the direct pay for performance offered by the carried interest in the current fund, and and also consider how the magnitudes vary across fund type and sequence.
To estimate the terms equation (3) of Section II, we require estimates of thek(.)terms, thep(.) andf(.)terms, and thep�(.)τ+sis andf�(.)τ+sis terms. A key component of our calculation are the k(.)terms, defined as the expected fraction of a fund’s size (committed capital) that accrues to GPs as compensation, through a combination of mangement fees and carried interest. The appropriate 20We use a discount rate of 5% for consistency with Metrick and Yasuda (2010), because we rely on their estimates, which they obtain using a discount rate of 5%, to calculate implicit pay for performance in the sections below.
values fork(.)are not obvious, and depend on the fee structure as well as the entire distribution of returns, which matters because it affects the likelihood of the carried interest being “in the money” and the amount that it will be worth conditional on being in the money. Our analysis relies on the
work of Metrick and Yasuda (2010), who perform Monte Carlo simulations to estimate k(.) using
details of the compensation structure in the partnership agreements of venture capital and buyout partnerships as well as data on the distribution of fund returns. Metrick and Yasuda (2010) provide estimates of the distribution ofk(.)for venture capital and buyout funds, and we use similar values for real estate funds (not considered by Metrick and Yasuda) and the overall sample of funds.
For the p(.) and f(.) terms, we use the type- and sequence-specific averages in our samp