475 Volume and Issues Obtainable at Center for Sustainability Research and Consultancy
Journal of Accounting and Finance in Emerging Economies ISSN: 2518-0318 ISSN (E) 2518-8488
Volume 6: Issue 2 June 2020
Journal homepage: www.publishing.globalcsrc.org/jafee
Impact of Corporate Governance Compliance and Financial Crisis on Stock
Liquidity: Evidence from Pakistan
1
Javed Khan, 2Shafiq Ur Rehman 1
PhD Scholar, Department of Commerce and Management Sciences, University of Malakand, Pakistan,
javeduom1@gmail.com
2
Professor, Department of Commerce and Management sciences, University of Malakand, Pakistan,
shafiquol@hotmail.com
ARTICLE DETAILS ABSTRACT
History
Revised format: May 2020 Available Online: June 2020
This study examines the impact of corporate governance compliance and global financial crisis on stock liquidity of Pakistani listed non-financial firms. By using a sample of 170 firms for the period of 2007 to 2016, and employing fixed effect regression model, the study finds a positive relationship between stock liquidity and corporate governance compliance, stating that more complied firms with the given code of corporate governance have better stock liquidity. The relationship of the global financial crisis with stock liquidity is negative and statistically significant, which means that stock liquidity of Pakistani listed firms is affected negatively during the global financial crisis. Conclusively, findings of the study signify the role of corporate governance compliance and financial crisis in determining stock liquidity of Pakistani listed firms, which have implications for investment and policymaking in Pakistan.
© 2020 The authors, under a Creative Commons Attribution- NonCommercial 4.0
Keywords
Corporate governance compliance, global financial crisis, stock liquidity, Pakistani listed firms
JEL Classification
G01, G12, G34
Corresponding author’s email address: shafiquol@hotmail.com
Recommended citation: Khan, J., Rehman, S. (2020). Impact of Corporate Governance Compliance and Financial Crisis on Stock Liquidity: Evidence from Pakistan. Journal of Accounting and Finance in Emerging Economies, 6(2), 475-486
1. Introduction
Corporate governance compliance measures the degree of conformity of a firms management and supervisory board to the guidelines given by the corporate regulatory body (Goncharov et al., 2006). Compliance with the code of corporate governance enhances transparency in the accounting and reporting procedures of the firms (Rizwan et al., 2016). Investors prefer to invest in the firms who are more obedient (good governed) to their regulatory authority (Glosten & Milgrom, 1985; Gompers et al., 2003) because regulatory authority regulates the firms to protect the investors' rights (Chung et al., 2010). Therefore, during deciding their investment portfolio, more regulated and transparent firms are selected by investors (LaPorta et al., 2000). This proneness of investors toward selecting a firm for their portfolio affects its stock liquidity (Ali et al., 2017), and it is expected that corporate governance compliance is linked with the stock liquidity of the firm, which is the subject matter of this paper.
476
that it will be exchanged easily and with low or zero transaction cost (Amihud & Mendelson, 2006; Nassar, 2016). The value, investors give to liquidity is stated by Handa and Schwartz (1996) in an interesting manner, that investors see only three things in a security, i.e. liquidity, liquidity and liquidity. Investors choose liquid securities for their portfolio because its transaction cost is low and are frequently exchanged (Amihud & Mendelson, 2006). Liquidity in securities is important for the firm because investors transfer transaction cost to the firm by demanding higher returns, which raises its cost of capital (Butler et al., 2005), resultantly firm value gets affected (Fang et al., 2009) Further, liquidity in securities is favored by firms because liquid securities make fundraising for them easy due to high investors attraction (Nassar, 2016).
Stock liquidity is a debatable issue for decades, but it got great attention since the recent global financial crisis (Ali et al., 2017). Research on the determinants of stock liquidity indicates that many factors affect it. For example, Tinic (1972) finds that stock price and trading volume are relative to stock liquidity, Benston and Hagerman (1974) argue that unsystematic risk affects bid-ask spread, while Branch and Freed (1977) argue that competition and market imperfections induce variations in stock liquidity.
Corporate governance proxies like board size, CEO duality, board independence, gender diversity and ownership impact on stock liquidity are examined widely (see for example, Ahmed & Ali, 2017; Hassan, 2017; Lei et al., 2013). Results obtained reveal that corporate governance positively affects stock liquidity as it increases monitoring over the management and transparency in reporting information is amplified (Prommin et al., 2014). However, these studies examined the impact of individual corporate governance mechanisms, and no one has examined the impact of corporate governance compliance on stock liquidity. Therefore, this is the first study which will examine this relationship.
Stock liquidity in relation to corporate governance quality is examined by various researchers. For example, Chung et al. (2010) examined this relationship in the United States and find that corporate governance positively affects stock liquidity of US firms. Similarly, Ali et al. (2016) argue that corporate governance quality positively affects stock liquidity of Australian listed firms. However, results of their studies are not generalizable to Pakistan, because there is a large difference in the political, economic and cultural environments of Pakistan and those of developed nations (Khan, 2016). Further, the corporate governance indices of the existing studies (e.g, Ali et al., 2017; Chung et al., 2010) are made up of 17 and 24 provisions respectively, focusing only on prominent areas of governance code. The index of our study consists of 70 provisions, giving importance to all areas of the corporate governance code. Therefore, this study is different from the existing ones as it examines the impact of corporate governance compliance on the stock liquidity, contributing a new aspect to the determinants of stock liquidity.
A financial crisis is also among the factors affecting stock liquidity and this relationship is examined by various researchers (such as, Amihud et al., 1990; Engkuchik & Kaya, 2012; Wong & Fung, 2001). But the researcher felt the need to examine it in Pakistani context because of the following reasons. First, the results of the existing studies are not conclusive, as Amihud et al. (1990) state that the financial crisis affects stock liquidity negatively followed by Wong and Fung (2001). However, on the other hand, Engkuchik and Kaya (2012) argue that stock liquidity moves up during a financial crisis. Second, the global financial crisis of 2007-2009 is documented severe economic shock after the great depression (Akbar et al., 2017), and thus might have a more severe and different impact on stock liquidity. Third, stock liquidity of family-owned firms might fluctuate very differently during the financial crisis due to its ownership structure, and is, therefore, the first study of its kind.
2. Literature Review
Agency theory postulates that the problem of information asymmetry between the principals and agents is because of separation of ownership and management of the firms, as investors don’t have the information which the managers have (Jensen & Meckling, 1976). Opportunistic managers use the wealth of shareholders for their benefits (Switzer & Wang, 2013), which includes skirting responsibility, overcompensation, consumption of bonuses and domain building (Ali et al., 2017). Partial information is disclosed by these managers to safeguard their misappropriations, which leads to information asymmetry between the management and owners. Due to this fear of misappropriation with shareholders’ wealth, the investors hesitate to invest their money in the firm.
477
For securing investors’ wealth and minimizing the problem of information asymmetry, code of corporate governance is introduced by corporate regulatory bodies and firms are required to follow these codes in reporting financial information (Aguilera & Cuervo-Cazurra, 2004). This code requires the firms to show transparency in financial reporting so that investors’ wealth may be protected from misappropriation and also they may feel easy in investing into the market (Aguilera & Cuervo-Cazurra, 2009).
Compliance with the code of corporate governance is supposed to alleviate the problem of information asymmetry as the management will be disclosing internal information (Leuz et al., 2003). In such a situation of informational transparency, investors are not faced with the problem of adverse selection (Glosten & Milgrom, 1985) and firms stocks becomes more liquid (Ali et al., 2017). Thus it is expected that compliance with the corporate governance code improves stock liquidity of firms.
Empirical relationship of stock liquidity with the corporate governance quality is examined by Chung et al. (2010) in the United States, and find that corporate governance quality positively affects stock liquidity. Similarly, Ali et al. (2016) have investigated such a relationship for the Australian market and reported the same positive relationship. But the results of those studies are not generalizable for Pakistan, because Pakistan is a developing economy and the cultural, political and economic environments of Pakistan are different than those developed markets (Khan, 2016). Second, the corporate governance indices of the existing studies are composed of 24 and 17 provisions representing only the dominant areas of the corporate governance code, while the index of this study is made up of 70 provisions representing complete compliance with the corporate governance code. Third, most Pakistani firms are family-owned (Bushra & Mirza, 2015) and the effect of corporate governance quality on their stock liquidity might be different. Researches in emerging economies examining the corporate governance quality relationship with stock liquidity of firms find that the two variables are positively related. For example, in Malaysia, Foo and Zain (2010), in China Lei et al. (2013) and Thailand, Prommin et al. (2014) have evaluated the effect of corporate governance quality on stock liquidity. But these studies have a small sample size and a short time span. For example, Foo and Zain (2010) use only cross-sectional data, Lei et al. (2013) suffers from short time span, i.e. 2006-2008 and Prommin et al. (2014) relies on a sample of 100 firms for a short period of 2006-2009. Further, no index is used by these studies, leaving a material gap for this study. We expect that compliance with the code of corporate governance would ensure transparency in the financial reporting of the firms, which will attract the investors towards investing in the firms' stocks and thus stock liquidity will be affected positively. This relationship is hypothesized as follows;
H1: Corporate governance compliance has a positive impact on stock liquidity.
2.1.Role Financial Crisis and Stock Liquidity
A financial crisis is a more volatile period or period of high uncertainty (Kaya & Engkuchik, 2017) which makes the investors flee the market due to high risk and firms are in large trouble as they face problems in raising funds. This huge withdrawal by the investors puts downward pressure on the liquidity of the stocks. This relationship is examined by Amihud et al. (1990) which found that financial crisis of 1987 negatively affected the liquidity of the US stock market. Similarly, Wong and Fung (2001) argue that stock liquidity of Hong Kong stock market was affected negatively during the Asian financial crisis 1997. However, Engkuchik and Kaya (2012) report that stock liquidity of Malaysian stock market affected positively during the Asian financial crisis. They further argue that this is because the sellers dominated the market by quitting in a hurry to avoid further losses. On an international level, Kaya and Engkuchik (2017) examined stock liquidity of fifteen countries during the four financial crises occurred between 1997 and 1999. The researchers found no conclusive relation stated that stock liquidity of some countries affected positively while some stock markets affected negatively. Based on the above reasoning it can be claimed that the existing studies have failed to find a conclusive relationship of the financial crisis to stock liquidity. Further, global financial crisis 2007-2009 is the most severe economic collapse since the great depression, which originated from the United States in 2007 and affected financial markets and institutions around the globe (Akbar et al., 2017; Akbar et al., 2013). Therefore, the researchers felt it necessary to examine its effect on the stock liquidity of a developing economy. It is expected that during the period of the financial crisis, investors withdraw their investment from the
478
market, which puts downward pressure on the liquidity of the stock and thus the following hypothesis is developed; H2: There is a negative relationship between the financial crisis and stock liquidity.
3. Methodology
This study intends to assess the stock liquidity of Pakistani listed firms in relation to corporate governance compliance and financial crisis. Non-financial firms are excluded from the sample because they have unique financial nature and operating environment (Akbar et al., 2017; Akbar et al., 2013; Ali et al., 2016). All those listed firms on the Pakistan stock exchange are selected for which the required data is available for the study period. The final sample of the study includes 170 non-financial listed firms. The time period of the study is 2007-2016. The ten years period of the study is important due to the following reasons. First, this period includes the global financial crisis period (i.e. 2007-2009). Second, this period includes the corporate governance reforms of 2002 and 2012, as code of corporate governance was first introduced in Pakistan in 2002 and then revised in 2012. Third, the sample period includes an equal number of years (i.e. five years) from both the reform periods.
3.1.Measure of Stock Liquidity
The dependent variable of this study is stock liquidity. Four methods of measuring this variable are used due to the availability of data for these four methods.
3.1.1 Liquidity Ratio
This measure of stock liquidity views depth, breadth and resiliency as characteristics of liquid markets (Ali et al., 2017). Various researchers have used this measure (such as, Arnihud et al., 1997; Berkman & Eleswarapu, 1998). It is measured as the sum of daily trading volume divided by the sum of daily absolute stock return in a financial year.
Where, VOLit is the daily trading volume and |Rit| is the daily absolute stock returns of firm i in year t. The higher the liquidity ratio, the higher will be the stock liquidity.
3.1.2 Zero Return Measure
This measure of stock liquidity is introduced by Lesmond et al. (1999), which argued that there is a positive relationship between zero return measure and spread measure of stock liquidity. It is measured as zero return days divided by total trading days in a financial year.
Where, ZRit is the zero return days in a year, and TDit represents total trading days in a year for firm i in year t. The
higher the value of zero return days, the lower will be the stock liquidity.
3.1.3 Stock Turn Over
It is the ratio of the sum of daily shares traded and total shares outstanding per year. It measures how quickly the stock changes hands. This method is used by Datar et al. (1998) for measuring the stock liquidity.
479
The higher the value of STOit, the higher will be the stock liquidity.
1.1.4 Amihud Illiquidity Estimate
Amihud illiquidity estimate is a low-frequency method of measuring stock liquidity (Amihud, 2002), and is deemed a reliable measure of stock liquidity. It is calculated as the daily ratio of absolute stock returns to trading volume, averaged over a number of trading days in a year (Ali et al., 2017). The following formula is used;
The higher the value of ILLIQit, thelower will be the liquidity and vice versa.
3.2.Measure of Corporate Governance Compliance
Corporate governance compliance is measured through an index, which incorporates all the governance mechanisms, and the literature suggests the examination of such a collective index rather than individual governance proxies (Ntim et al., 2012). Researchers such as Elghuweel et al. (2016) and Ntim et al. (2012) have used governance indices in their studies. This study investigates the impact of corporate governance compliance on stock liquidity in Pakistan, for which a self-made governance index is formulated.
Corporate governance compliance index measures compliance of Pakistani listed firms with the codes (2002 and 2012) of corporate governance in Pakistan. Following Khan (2016) the index is composed of 70 governance provisions. The provision is assigned “1” if it is adopted by the firm, and otherwise “0”. Depending on the compliance level, firms have values between 0 and 70. As the index value increases, compliance with the code of corporate governance is increased and vice versa.
3.3Control Variables
The study includes four firm characteristics to isolate corporate governance compliance impact on stock liquidity. Firm size is controlled because large firms have more information available and thus a lower adverse selection problem will result in higher stock liquidity (Diamond & Verrecchia, 1991). Size is measured by taking the natural logarithm of the total assets of the firm. Return volatility is controlled because the uncertainty of the cost of holding stocks is higher for firms with higher return volatility. This leads to higher information asymmetry (Ho & Stoll, 1981), due to which stock liquidity does not remain unaffected. Return volatility is measured by taking a standard deviation of stock returns. The returns of tangible assets are easy to measure and thus small information asymmetry results into affecting the stock liquidity (Ali et al., 2017). Therefore, this variable is controlled and is measured by dividing the tangible fixed assets (property, plant and equipment) over total assets. Another control variable of the study is leverage, which is expected to affect the stock liquidity. Leverage is measured as a firm’s total debt to total equity.
480
Table 1: Variables Defined
3.4 Empirical Model
For testing the relationship of stock liquidity with corporate governance and financial crisis, the following regression models are used;
Stock Liquidity = α + β1GI + β2CR + β3SIZZ +β4RVOL +β5TANG +β6LEVG + Ԑit (1)
Here GI and CR are the two main independent variables representing corporate governance compliance and financial crisis respectively, while SIZE RVOL TANG and LEVG are control variables of the study.
4. Results and Analysis 4.1 Descriptive Statistics
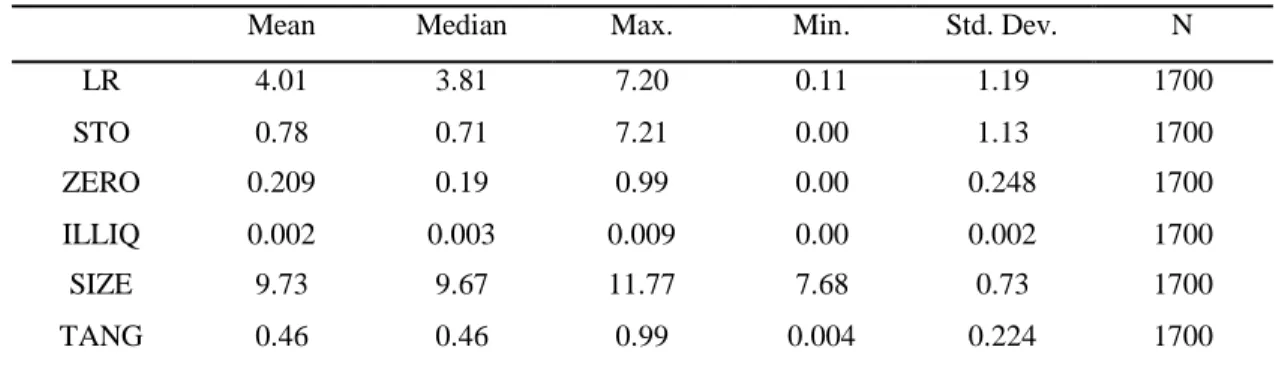
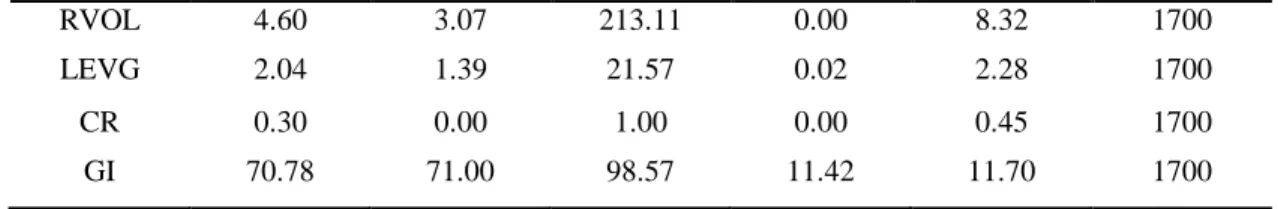
Table 2 presents descriptive statistics. Mean values of the liquidity measure are 4.01, 0.78 and 0.209 and 0.002 with a standard deviation of 1.19, 1.13, 0.248 and 0.002 for LR, STO, ZERO and ILLIQ respectively. The mean value of governance compliance is 70.78 and the standard deviation is 11.70. The maximum value of governance compliance is 98.57 while its minimum value is 11.42, which means that the sample includes more complied and less complied firms. The financial crisis has a mean of 0.30 and a standard deviation of 0.45. Control variables of the study have means and standard deviations as; size, 9.73 and 0.73, return volatility, 4.60 and 8.32, leverage, 2.04 and 2.28 and tangibility 0.46 and 0.224 respectively.
Table: 2 Descriptive Statistics
Mean Median Max. Min. Std. Dev. N
LR 4.01 3.81 7.20 0.11 1.19 1700 STO 0.78 0.71 7.21 0.00 1.13 1700 ZERO 0.209 0.19 0.99 0.00 0.248 1700 ILLIQ 0.002 0.003 0.009 0.00 0.002 1700 SIZE 9.73 9.67 11.77 7.68 0.73 1700 TANG 0.46 0.46 0.99 0.004 0.224 1700
Notion Variable Name Measure
ZERO Zero return measure Zero return days divided by sum of total trading days per year
LR Liquidity ratio The ratio of trading volume per day to total absolute stock returns per year
STO Stock turnover Total shares traded per day divide by annual outstanding shares
ILLQ Amihud illiquidity estimate Absolute stock returns divide by daily trading volume averaged over annual trading days
GI Governance index An index which ranges from “0” (no compliance) to “70” (full
compliance).
CR Global financial crisis A dummy variable which takes the value of 1 for the crisis period and 0 otherwise.
SIZE Size of firm Log of total firm assets.
TANG Tangibility The ratio of tangible assets to total assets
RVOL Return volatility The standard deviation of share returns per day
481 RVOL 4.60 3.07 213.11 0.00 8.32 1700 LEVG 2.04 1.39 21.57 0.02 2.28 1700 CR 0.30 0.00 1.00 0.00 0.45 1700 GI 70.78 71.00 98.57 11.42 11.70 1700 4.2 Correlation Analysis
The results of the correlation between the variables of the study are presented in Table 3. Governance compliance is positively correlated with liquidity ratio and stock turn over while it has a negative correlation with zero returns and illiquidity, which shows that the stock liquidity of more complied firms is higher. Correlation among the measures of stock liquidity is high showing that all these four variables measure the same variable (i.e. stock liquidity). Correlation of governance compliance with the size is positive, showing that large-sized firms are more complied. The high correlation between size and liquidity ratio suggests that a large firm's stocks exhibit higher liquidity.
Table: 3 Correlation Analyses
1 2 3 4 5 6 7 8 9 10 LR 1 STO 0.735 1 ZERO -0.502 -0.485 1 ILLIQ -0.854 -0.674 0.481 1 SIZE 0.602 0.222 -0.296 -0.566 1 TANG -0.043 -0.057 0.061 0.077 -0.101 1 RVOL -0.258 -0.183 0.181 0.293 -0.255 0.196 1 LEVG -0.014 -0.031 0.035 0.062 -0.021 0.143 0.271 1 CR -0.106 -0.279 0.189 0.246 -0.077 0.039 0.139 0.082 1 GI 0.277 0.316 -0.308 -0.384 0.327 -0.074 -0.148 -0.089 -0.327 1
Hausman (1978) model specification test is used for comparing the outcomes of random effect and fixed-effect models, the results of which are stated in table 4. Findings of the test confirmed that the outcomes of both the models are significantly different, which suggests that the fixed effect regression model is suitable for examining the association between the dependent and independent variables.
Table 4: Hausman Test
Test Summary Chi-Sq. Statistic Chi-Sq. d.f. Prob.
Cross-section random 31.715099 6 0.0000
4.3 Main Results
Fixed effect regression method is used to examine the relationship of stock liquidity with corporate governance compliance and financial crisis. The model is run for all four measures of stock liquidity i.e. zero returns, stock turnover, amihud illiquidity and liquidity ratio. The model fitness is 88% for liquidity ratio 47% for zero return measure, 79% for amihud illiquidity and 58% for stock turn over respectively. F statistics are highly significant in all cases. The results of all the four models are presented in table 5.
The coefficient of corporate governance compliance in relation to liquidity measured through liquidity ratio is positively significant at the level of 1% which means that it affects stock liquidity positively. Alternatively, it can be
482
stated that stock liquidity of more complied firms is higher. Stock turnover shows similar results, confirming the positive effect of corporate governance compliance on stock liquidity. The stock liquidity measured through zero returns and amihud illiquidity shows a significant negative relationship with corporate governance compliance, endorsing the results of the previous two methods. Therefore, it is concluded that corporate governance compliance positively affects stock liquidity of firms.
Table: 5 Main Results Variables Model 1 Liquidity Ratio Model 2 Zero Return Measure Model 3 Stock Turn over
Model 4 Amihud Illiquidity Estimate C 0.00*** (5.24) 1.08*** (6.19) 2.01** (2.45) 0.02** (2.31) GI 0.00*** (3.61) -0.00*** (8.83) 0.00** (2.04) -0.00*** (5.02) CR -0.40*** (9.41) 0.15 (0.66) -0.22*** (4.40) 0.00*** (22.4) LEVG -0.02*** (2.75) 0.00*** (7.33) -0.23 (1.19) 0.00 (1.26) TANG 0.17 (1.35) -0.05 (0.52) -0.80 (0.24) -0.00 (0.95) SIZE 0.11 (1.13) -0.03*** (4.01) 0.52 (0.62) -0.00*** (3.94) RVOL -0.00*** (8.00) 0.00*** (9.36) -0.00 (0.05) 0.00*** 9.21 R Squared 0.88 0.47 0.58 0.79 F Statistics 52.986 0.000 5.995 0.000 9.381 0.000 34.24 0.000 No. of Observations 1700 1700 1700 1700 Durbin-Watson stat 1.505 1.890 1.744 1.31
Note: *, ** and *** shows significance at the levels of 10%, 5% and 1% respectively.
The findings of our study are consistent with the results of existing literature (i.e. Ali et al., 2016; Ali et al., 2017; Chung et al., 2010; Lei et al., 2013) which states that corporate governance quality and stock liquidity are positively related. Hence our study confirms that corporate governance positively affects stock liquidity of a developing economy and where maximum firms are family-owned. A further addition to the literature is made that compliance with the code of corporate governance positively affects stock liquidity of the firms.
The coefficient of CR is negatively significant at the level of 1% with liquidity ratio and stock turnover, while it is positively significant at the level of 1% with amihud illiquidity estimate. This means that stock liquidity of Pakistani listed firms is negatively affected during the global financial crisis.
The outcomes of our study are in support of the existing literature (see for example, Amihud et al., 1990; Wong & Fung, 2001), where it is argued that stock liquidity is negatively affected during financial crises. This is because
483
during the crisis period investors withdraw their investment from the stock market, which creates downward pressure on the liquidity of the stocks due to decreased demand for stocks. Such a negative relationship between the financial crisis and stock liquidity is confirmed for family-owned firms in Pakistan.
4.4 Endogeneity
Literature suggests that the problem of endogeneity may bias the results if not cured properly (Mura, 2007). This problem arises due to so many reasons such as omitted variables, reverse causality and measurement errors. Various cures are used by the existing literature for addressing this issue, such as 2SLS, 3SLS and Generalized Method of Moments (Roberts & Whited, 2013). We use two stages least square method to address endogeneity. As the name indicates, the 2SLS is carried out in two stages. In the first stage, the endogenous variable (i.e. GI) is regressed over control variables and the lag value 1 of GI. The predicted value of this regression is saved as GI1. The following equation is used for this purpose;
CONTROLS represent all control variables used in Model (1).
GI represents governance index, which is the endogenous variable in our model.
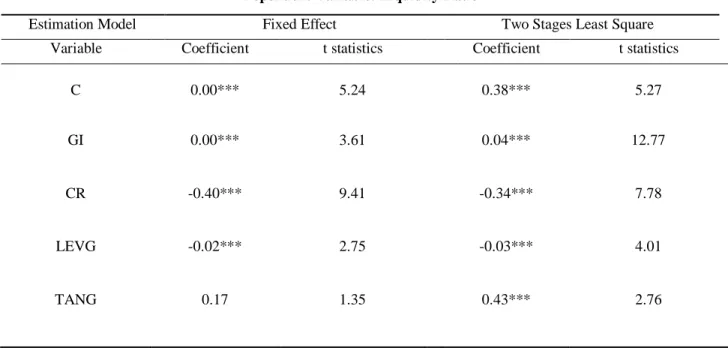
For estimating the second stage of the 2SLS, Model 1 is re-estimated, using the predicted value of GI (i.e. GI1) instead of the endogenous variable. For avoiding complexity and due to shortage of time only one measure of the dependent variable is used (i.e. liquidity ratio). The outcomes of the 2SLS and main model are presented in the same table (i.e. table 6) to compare them easily.
Comparing the outcomes of the fixed effect and two stages least square models, it is observed that the results are same for our main independent variables (i.e. GI and CR), except for some minor alterations in the control variables. Therefore, it can be claimed that the problem of endogeneity doesn’t alter the quality of our results and are robust to the use of an alternative estimation model.
Table 6: Results based on 2SLS Dependent Variable: Liquidity Ratio
Estimation Model Fixed Effect Two Stages Least Square
Variable Coefficient t statistics Coefficient t statistics
C 0.00*** 5.24 0.38*** 5.27 GI 0.00*** 3.61 0.04*** 12.77 CR -0.40*** 9.41 -0.34*** 7.78 LEVG -0.02*** 2.75 -0.03*** 4.01 TANG 0.17 1.35 0.43*** 2.76
484 SIZE 0.11 0.00 0.69*** 6.34 RVOL -0.00*** 8.00 -0.01*** 6.84 R Squared 0.88 0.55 F Statistics 52.986 0.000 25.45 0.000 No. of Observations 1700 1700
Note: *, ** and *** shows significance at the levels of 10%, 5% and 1% respectively. 5. Conclusion
This study examines the effect of corporate governance compliance and financial crisis on stock liquidity of Pakistani listed non-financial firms. The results reported reveal that corporate governance compliance positively affects stock liquidity. The results of our study are consistent with the existing literature (see for example, Ali et al., 2016; Ali et al., 2017; Chung et al., 2010; Lei et al., 2013). The study makes a new contribution to the literature that compliance with the code of corporate governance positively affects the stock liquidity of the firms.
The impact of the financial crisis on stock liquidity is negative and highly significant, which means that the global financial crisis has negatively affected the stock liquidity of Pakistani listed firms. The results of our study are consistent with that of Amihud et al. (1990) and Wong and Fung (2001) which argue that stock liquidity of US firms and Hong Kong firms is negatively affected during the financial crash of 1987 and Asian financial crisis 1997 respectively. The study contributes to the existing literature, that financial crisis negatively affects the stock liquid ity of family-owned firms.
The study contributes to the literature in the following ways. First, this study adds to the literature on the impact of corporate governance compliance on stock liquidity from the perspective of an emerging economy. This highlights the importance of compliance with the code of corporate governance and has implications for investors and management. Second, the study extends the existing literature on the impact of the financial crisis on stock liquidity by examining the stock liquidity behavior of firms in an emerging economy.
References
Aguilera, R. V., & Cuervo-Cazurra, A. (2004). Codes of good governance worldwide: What is the trigger? Organization Studies, Vol. 25. No. 3, pp. 415–443.
Aguilera, R. V., & Cuervo-Cazurra, A. (2009). Codes of good governance. Corporate Governance: An International
Review, Vol. 17. No. 3, pp. 376–387.
Ahmed, A., & Ali, S. (2017). Boardroom gender diversity and stock liquidity: Evidence from Australia. Journal of
Contemporary Accounting & Economics, Vol. 13. No., pp. 148–165.
Akbar, S., Rehman, S. u., Liu, J., & Shah, S. Z. A. (2017). Credit supply constraints and financial policies of listed
companies during the 2007–2009 financial crisis. Research in International Business and Finance, Vol. 42.
No., pp. 559-571.
Akbar, S., Rehman, S. u., & Ormrod, P. (2013). The impact of recent financial shocks on the financing and
investment policies of UK private firms. International Review of Financial Analysis, Vol. 26. No., pp. 59–
70.
Ali, S., Liu, B., & Su, J. J. (2016). What determines stock liquidity in Australia? Applied Economics, Vol. No., pp. Ali, S., Liu, B., & Su, J. J. (2017). Corporate governance and stock liquidity dimensions: Panel evidence from pure
order-driven Australian market. International Review of Economics and Finance, Vol. 50. No., pp. 275-304. Amihud, Y. (2002). Illiquidity and stock returns: Cross-section and time-series effects. Journal of Financial Markets,
485
Amihud, Y., & Mendelson, H. (2006). Stock and bond liquidity and its effect on prices and financial policies. Financial Markkets and Portfolio Management, Vol. 20. No., pp. 19–32.
Amihud, Y., Mendelson, H., & Wood, R. A. (1990). Liquidity and the 1987 stock market crash. Journal of Portfolio Management, Vol. 16. No. 3, pp. 65-69.
Arnihud, Y., Mendelson, H., & Lauterbach, B. (1997). Market microstructure and securities values: Evidence from the Tel Aviv stock exchange. Journal of Financial Economics, Vol. 45. No. 3, pp. 365-390.
Benston, G. J., & Hagerman, R. L. (1974). Determinants of bid-asked spreads in over the counter market. Journal of Financial Economics, Vol. 1. No., pp. 353-364.
Berkman, H., & Eleswarapu, V. R. (1998). Short-term traders and liquidity: A test using Bombay stock exchange data. Journal of Financial Economics, Vol. 47. No. 3, pp. 339-355.
Branch, B., & Freed, W. (1977). Bid asked spreads on the amex and the big board. The Journal of Finance, Vol. 32. No., pp. 159–163.
Bushra, A., & Mirza, N. (2015). The determinants of corporate dividend policy in Pakistan. The Lahore Journal of
Economics, Vol. 20. No. 2, pp. 77–98.
Butler, A. W., Grullon, G., & Weston, J. P. (2005). Stock market liquidity and the cost of issuing equity Journal of Financial and Quantitative Analysis, Vol. 40. No. 2, pp. 331-348.
Chung, K. H., Elder, J., & Kim, J.-C. (2010). Corporate governance and liquidity. Journal of Financial and
Quantative Analysis, Vol. 45. No. 2, pp. 265–291.
Datar, V. T., Naik, N., & Radcliffe, R. (1998). Liquidity and stock returns: An alternative test. Journal of Financial
Markets, Vol. 1. No. 2, pp. 203-219.
Diamond, D. W., & Verrecchia, R. E. (1991). Disclosure, liquidity, and the cost of capital The Journal of Finance,
Vol. 46. No. 4, pp. 1325-1359.
Elghuweel, M. I., Ntim, C., Opong, K., & Avison, L. (2016). Corporate governance, islamic governance and earnings
management in Oman: A new empirical insights from a behavioural theoretical framework. Journal of
Accounting in Emerging Economies, Vol. 7. No. 2, pp. 190-224.
Engkuchik, E. N., & Kaya, H. D. (2012). The impact of the asian crisis on stock market liquidity: Evidence from the Malaysian stock exchange. International Journal of Business and Social Science, Vol. 3. No. 8, pp.
Fang, V. W., Noe, T. H., & Tice, S. (2009). Stock market liquidity and firm value. . Journal of Financial Economics,
Vol. 94. No. 1, pp. 150-169.
Foo, Y.-B., & Zain, M. M. (2010). Board independence, board diligence and liquidity in malaysia: A research note. Journal of Contemporary Accounting & Economics., Vol. 6. No. 2, pp. 92-100.
Glosten, L. R., & Milgrom, P. R. (1985). Bid, ask and transaction prices in a specialist market with heterogeneously informed traders. . Journal of Financial Economics, Vol. 14. No. 1, pp. 71-100.
Gompers, P. A., Ishii, J. L., & Metrick, A. (2003). Corporate governance and equity prices. Quarterly Journal of Economics, Vol. 118. No. 1, pp. 107-155.
Goncharov, I., Werner, J. R., & Zimmermann, J. (2006). Does compliance with the German corporate governance code have an impact on stock valuation? An empirical analysis. Corporate Governance, Vol. 14. No. 5, pp. 432–445.
Handa, P., & Schwartz, R. A. (1996). How best to supply liquidity to a securities market. . The Journal of Portfolio
Management, Vol. 22. No. 2, pp. 44-51.
Hassan, H. (2017). Impact of corporate governance practices on stock liquidity: Evidence from Karachi stock
exchange (Pakistan). (MS MS Thesis), Capital University of Science and Technology, Islamabad. Hausman, J. A. (1978). Specification tests in econometrics. Econometrica, Vol. 46. No. 6, pp. 1251-1271.
Ho, T., & Stoll, H. R. (1981). Optimal dealer pricing under transactions and return uncertainty. Journal of Financial
Economics, Vol. 9. No. 1, pp. 47-73.
Jensen, M. C., & Meckling, W. H. (1976). Theory of the firm: Managerial behavior, agency costs and ownership structure. Journal of Financial Economics, October, Vol. 3. No. 4, pp. 305-360.
Kaya, H. D., & Engkuchik, E. N. S. (2017). The effect of financial crises on stock market liquidity across global markets. Investment Management and Financial Innovations, Vol. 14. No. 2, pp. 38-50.
Khan, M. Y. (2016). Corporate governance and cost of capital: Evidence from Pakistani listed firms. (PhD Thesis), University of Glasgow.
486
Lei, Q., Lin, B., & Wei, M. (2013). Types of agency cost, corporate governance and liquidity. Journal of Accounting
and Public Policy, Vol. 32. No. 3, pp. 147-172.
Lesmond, D. A., Ogden, J. P., & Trzcinka, C. A. (1999). A new estimate of transaction costs The Review of Financial Studies, Vol. 12. No. 5, pp. 1113-1141.
Leuz, C., Nanda, D., & Wysocki, P. D. (2003). Earnings management and investor protection: An international comparison. Journal of Financial Economics, Vol. 69. No. 3, pp. 505-527.
Mura, R. (2007). Firm performance: Do non‐executive directors have minds of their own? Evidence from UK panel
data. Financial Management, Vol. 36. No. 3, pp. 81-112.
Nassar, S. (2016). Investigate the factors affecting share liquidity: Evidence from Istanbul stock exchange (ise). Research Journal of Finance and Accounting, Vol. 7. No. 6, pp.
Ntim, C. G., Opong, K. K., Danbolt, J., & Thomas, D. A. (2012). Voluntary corporate governance disclosures by post-apartheid South African corporations. Journal of Applied Accounting Research, Vol. 13. No. 2, pp. 122-144.
Prommin, P., Jumreornvong, S., & Jiraporn, P. (2014). The effect of corporate governance on stock liquid ity: The case of Thailand. International Review of Economics & Finance, Vol. 32. No., pp. 132-142.
Roberts, M. R., & Whited, T. M. (2013). Endogeneity in empirical corporate finance1 Handbook of the economics of finance (Vol. 2, pp. 493-572): Elsevier.
Switzer, L. N., & Wang, J. (2013). Default risk estimation, bank credit risk, and corporate governance. Financial Markets, Institutions & Instruments, Vol. 22. No. 2, pp. 91-112.
Tinic, S. M. (1972). The economics of liquidity services. The Quarterly Journal of Economics, Vol. 86. No. 1, pp.
79-93.
Wang, Y., Abbasi, K., Babajide, B., & Yekini, K. C. (2019). Corporate governance mechanisms and firm performance: Evidence from the emerging market following the revised CG code. Corporate Governance: The international journal of business in society, Vol. 20. No. 1, pp. 158-174.
Wong, J., & Fung, L. (2001). Liquidity of the Hong Kong stock market since the Asian financial crisis International