Motorcycle rider training for the prevention of road traffic
crashes (Review)
Kardamanidis K, Martiniuk A, Ivers RQ, Stevenson MR, Thistlethwaite K
This is a reprint of a Cochrane review, prepared and maintained by The Cochrane Collaboration and published inThe Cochrane Library
2010, Issue 10
T A B L E O F C O N T E N T S 1 HEADER . . . . 1 ABSTRACT . . . . 2
PLAIN LANGUAGE SUMMARY . . . .
2 BACKGROUND . . . . 3 OBJECTIVES . . . . 3 METHODS . . . . 11 RESULTS . . . . 20 DISCUSSION . . . . 23 AUTHORS’ CONCLUSIONS . . . . 24 ACKNOWLEDGEMENTS . . . . 24 REFERENCES . . . . 29 CHARACTERISTICS OF STUDIES . . . . 46 DATA AND ANALYSES . . . .
46 APPENDICES . . . . 46 HISTORY . . . . 46 CONTRIBUTIONS OF AUTHORS . . . . 47 DECLARATIONS OF INTEREST . . . . 47 SOURCES OF SUPPORT . . . . 47
[Intervention Review]
Motorcycle rider training for the prevention of road traffic
crashes
Katina Kardamanidis1, Alexandra Martiniuk1, Rebecca Q Ivers1, Mark R Stevenson1, Katrina Thistlethwaite1 1The George Institute for Global Health, Sydney, Australia
Contact address: Rebecca Q Ivers, The George Institute for Global Health, PO Box M201 Missenden Road, Sydney, NSW, 2050, Australia.rivers@george.org.au.
Editorial group:Cochrane Injuries Group.
Publication status and date:New, published in Issue 10, 2010. Review content assessed as up-to-date: 8 August 2010.
Citation: Kardamanidis K, Martiniuk A, Ivers RQ, Stevenson MR, Thistlethwaite K. Motorcycle rider training for the prevention of road traffic crashes. Cochrane Database of Systematic Reviews 2010, Issue 10. Art. No.: CD005240. DOI: 10.1002/14651858.CD005240.pub2.
Copyright © 2010 The Cochrane Collaboration. Published by John Wiley & Sons, Ltd.
A B S T R A C T Background
Riding a motorcycle (a two-wheeled vehicle that is powered by a motor and has no pedals) is associated with a high risk of fatal crashes, particularly in new riders. Motorcycle rider training has therefore been suggested as an important means of reducing the number of crashes, and the severity of injuries.
Objectives
To quantify the effectiveness of pre- and post-licence motorcycle rider training on the reduction of traffic offences, traffic crash involvement, injuries and deaths of motorcycle riders.
Search strategy
We searched the Cochrane Injuries Group Specialised Register, CENTRAL (The Cochrane Library2008, Issue 3), TRANSPORT, MEDLINE, EMBASE, CINAHL, WHOLIS (World Health Organization Library Information System), PsycInfo, LILACS (Latin American and Caribbean Health Sciences), ISI Web of Science:Social Sciences Citation Index (SSCI),ERIC, ZETOC and SIGLE. Database searches covered all available dates up to October 2008. We also checked reference lists of relevant papers and contacted study authors in an effort to identify published, unpublished and ongoing trials related to motorcycle rider training.
Selection criteria
We included all relevant intervention studies such as randomised and non-randomised controlled trials, interrupted time-series and observational studies such as cohort and case-control studies.
Data collection and analysis
Two review authors independently analysed data about the study population, study design and methods, interventions and outcome measures as well as data quality from each included study, and compared the findings. We resolved differences by discussion with a third review author.
Main results
We reviewed 23 studies: three randomised trials, two non-randomised trials, 14 cohort studies and four case-control studies. Five examined mandatory pre-licence training, 14 assessed non-mandatory training, three of the case-control studies assessed ‘any’ type of rider training, and one case-control study assessed mandatory pre-licence training and non-mandatory training. The types of assessed rider training varied in duration and content.
Most studies suffered from serious methodological weaknesses. Most studies were non-randomised and controlled poorly for con-founders. Most studies also suffered from detection bias due to the poor use of outcome measurement tools such as the sole reliance upon police records or self-reported data. Small sample sizes and short follow-up time after training were also common.
Authors’ conclusions
Due to the poor quality of studies identified, we were unable to draw any conclusions about the effectiveness of rider training on crash, injury, or offence rates. The findings suggest that mandatory pre-licence training may be an impediment to completing a motorcycle licensing process, possibly indirectly reducing crashes through a reduction in exposure. It is not clear if training (or what type) reduces the risk of crashes, injuries or offences in motorcyclists, and a best rider training practice can therefore not be recommended. As some type of rider training is likely to be necessary to teach motorcyclists to ride a motorcycle safely, rigorous research is needed.
P L A I N L A N G U A G E S U M M A R Y Motorcycle rider training for preventing road traffic crashes
Riders of motorcycles (a two-wheeled vehicle that is powered by a motor and has no pedals -Oxford English Dictionary Online), especially novice riders, have an increased risk of being involved in fatal crashes compared to other road users. Motorcycle rider training could be an important way of reducing the number of crashes and the severity of injuries.
The authors of this review examined all research studies that report an evaluation of the effectiveness of motorcycle rider courses in reducing the number of traffic offences, motorcycle rider crashes, injuries and deaths. This review included 23 research studies, including three randomised trials, two non-randomised trials, 14 cohort studies and four case-control studies. The types of rider training that were evaluated varied in content and duration. The findings suggest that mandatory pre-licence training may present a barrier to completing a motorcycle licensing process, thus possibly indirectly reducing crash, injury, death and offence rates through a reduction in exposure to riding a motorcycle. However, on the basis of the existing evidence, it is not clear if (or what type of ) training reduces the risk of crashes, injuries, deaths or offences in motorcyclists and the selection of the best rider training practice can therefore not be recommended.
It is likely that some type of rider training is necessary to teach motorcyclists basic motorcycle handling techniques and to ride a motorcycle safely. It is therefore important that further research work be conducted to rigorously evaluate motorcycle rider training courses, particularly in low income countries where the main burden of motorcycle injuries and deaths occur.
B A C K G R O U N D
Each year, an estimated 1.2 million people are killed in road crashes worldwide and an additional 50 million people are injured. Of these deaths, 85% occur in low-income and middle-income coun-tries. It has been predicted that between the year 2000 and 2020, without increased efforts, the number of road traffic deaths in high-income countries will decrease by approximately 30%; yet in low- and middle-income countries the number is expected to increase by over 80% (Kopits 2003;Peden 2004). Road traffic
injuries are likely to become the third leading cause of a global burden of disease and injury by 2020 if further action is not taken (Peden 2004).
Riding a motorcycle (a two-wheeled vehicle that is powered by a motor and has no pedals -Oxford English Dictionary Online) is associated with a higher risk of fatalities compared with driving a car (Leung 1983;Bjornstig 1985;Radin Umar 1995;Tsai 1995; FORS 1999;Yuan 2000;Johnston 2008). In Australia,
motorcy-cles accounted for 4.5% of all Australian passenger vehicle registra-tions and 0.9% of vehicle kilometres travelled in 2007. However, motorcycle riders accounted for approximately 15% of all road crash deaths and an even higher proportion of serious injuries. Per distance travelled, the Australian rate of motorcyclist deaths was approximately 30 times the rate for car occupants. The cor-responding rate for a serious injury was approximately 41 times higher. Similar elevated rates were also found in other developed countries (Johnston 2008). In low and middle-income countries, the motorcycle is one of the most frequently used means of trans-port and consequently motorcyclists constitute a large protrans-portion of road crash victims (Mohan 2002).
The lack of experience of many motorcycle riders has been cited as one potential cause of motorcycle crashes (Winn 1987;Mullin 1997). Training of motorcycle riders has therefore been suggested as an important countermeasure for reducing both the number of crashes and the severity of injury (Vis 1995;Noordzij 2001). Pre-licence motorcycle rider training courses have been made com-pulsory in several countries (Mullin 1997). Pre-licence training courses are aimed at providing motorcycle riders with the skills and knowledge needed to improve control of the motorcycle and to identify and avoid critical situations in traffic (Elliot 2003). Many pre-licence motorcycle rider training courses are aimed at novice riders and in many jurisdictions in high-income countries such as Australia, the USA and Canada, the completion of such courses is a mandatory requirement of licensing.
Post-licence rider training is not linked with licensing and such training is generally not compulsory. It usually focuses on riding skills and other topics that have not been covered, or dealt with sufficiently, in pre-licence rider training. Post-licence rider train-ing is used to reinforce fundamental skills and knowledge, or to provide some training for motorcyclists who are self-taught and have never received formal training (Anderson 1980).
Estimates of the number of motorcyclists attending post-licence rider training are not readily available, but existing data suggest such courses are not well attended, although attendance varies by country. In the USA, 24% of the total number of motorcyclists trained in 1988 and 1989 attended an experienced rider course (Weaver 1990).
The aim of this systematic review is to quantify the effectiveness of pand post-licence rider training for motorcycle riders in re-ducing traffic offences, road traffic crash involvement, injury and death.
O B J E C T I V E S
To quantify the effectiveness of pre- and post-licence motorcycle rider training on the reduction of traffic offences, traffic crash involvement, injuries and deaths of motorcycle riders.
M E T H O D S
Criteria for considering studies for this review
Types of studies
All relevant intervention studies such as randomised and non-ran-domised controlled trials and interrupted time series studies, and observational studies including cohort and case-control studies.
Types of participants
Motorcyclists and riders of mopeds or motor scooters of all ages.
Types of interventions
Motorcycle rider training (pre- or post-licence, mandatory or non-mandatory) versus no training.
One form of pre-licence rider training versus another form (e.g. on-road, off-road, theory, or a combination).
One form of post-licence rider training versus another form (e.g. on-road, off-road, theory, or a combination).
Types of outcome measures Offences, crashes, injuries and death.
Search methods for identification of studies
We did not restrict the searches by date, language or publication status.
Electronic searches
We searched the following electronic databases:
• Cochrane Injuries Group Specialised Register (searched 22
Sept 2008);
• CENTRAL (The Cochrane Library2008, Issue 3); • TRANSPORT 1988 to 2007/06 (latest date available); • ATRI: Australian Transport Index (to Sept 2008); • MEDLINE (Ovid SP) 1950 to Sept 2008; • EMBASE (Ovid SP) 1980 to Sept 2008; • CINAHL (EBSCO) 1982 to Sept 2008; • WHOLIS (World Health Organization Library
Information System) (to Sept 2008);
• PsycINFO (Ovid SP) 1806 to Sept 2008;
• LILACS (BIREME) (Latin American and Caribbean
Health Sciences) (1982 to Sept 2008);
• ISI Web of Science: Social Sciences Citation Index (SSCI)
• ERIC (searched 25 Sept 2008); • ZETOC (searched 25 Sept 2008); • SIGLE (searched 25 Sept 2008).
The full search strategy and results are listed inAppendix 1.
Searching other resources
We also checked reference lists of relevant papers and contacted study authors in an effort to identify published, unpublished and ongoing trials. We contacted transport and traffic research-related organisations worldwide and enquired about published and un-published studies.
We contacted the following organisations:
• American Motorcyclist Association;
• Association for the Advancement of Automotive Medicine
(AAAM), USA;
• Australian Road Research Board (ARRB): Transport
Research;
• Australian Transport Safety Bureau (ATSB); • Department for Transport, UK;
• Federal Highway Research Institute (BASt), Germany; • German Traffic Safety Council (Deutscher
Verkehrssicherheitsrat);
• Monash University Accident Research Centre, Australia; • Netherlands Organisation for Applied Scientific Research
(TNO): Transport and Logistics, The Netherlands;
• Royal Automobile Club (RAC), UK;
• Royal Dutch Touring Organisation (ANWB), The
Netherlands;
• Swedish National Road and Transport Research Institute; • SWOV (Stichting Wetenschappelijk Onderzoek
Verkeersveiligheid), The Netherlands;
• Transportation Research Laboratory, UK; • Transport Canada;
• US Department of Transportation;
• World Health Organization regional office for Europe:
Accidents, Transport and Health.
We also accessed 75 road safety websites that were listed by the World Health Organization Department of In-juries and Violence: www.who.int/violence_injury_prevention/ resources/res28/en/(accessed: 10-2-2007). We searched websites (e.g.http://www.safetylit.org/) for publications that were relevant to the subject area and that matched the research question.
Data collection and analysis
Two authors (KK and RQI or KK and AM) independently anal-ysed data related to the study population, study design and meth-ods, interventions and outcome measures from each included study, and compared the findings. We resolved differences by dis-cussion with a third author (RQI or AM).
We assessed data quality using a ’domain-based’ evaluation ap-proach recommended by the Cochrane Collaboration 2008 (8.5). We used the Canadian Effective Public Health Practice Project’s ‘Quality Assessment Tool for Quantitative Studies’ (http:/ /www.city.hamilton.on.ca/phcs/EPHPP/) to this end, which en-abled us to make judgements about the likelihood of bias (high or low) with regard to several domains of a study such as allocation bias, selection bias, detection bias, attrition bias, intervention in-tegrity, and method of analysis. We describe our judgment of risk of bias in the text. We have summarised the quality assessment in Table 1,Table 2,Table 3andTable 4.
Table 1. Risk of selection bias
Anderson 1980 Adequate sequence generation: yes. By using random birth-date tables Confounding factors were accounted for through randomisation
Hall 1988 Adequate sequence generation: yes. By using a computerised algorithm set in a central office, but also through manual random assignment when the computer went down
Confounding factors were accounted for through randomisation
Swaddiwudhipong 1998 Adequate sequence generation: unclear. “Simple random sampling” reported
Differences at baseline reported were a slightly higher (but not statistically significant) annual incidence rate of motorcycle related injuries in the intervention areas
Raymond 1979 Differences at baseline reported on riding exposure, riding experience, safety attitude, confidence in riding ability
Adjusted for the following confounders through bi-variate analysis: riding exposure or experience Selection: intervention group voluntary participation in training; control group randomly selected from licence records
Table 1. Risk of selection bias (Continued)
Osga 1980 Differences at baseline reported on sex and age
Confounding factors were not dealt with in univariate analysis. Riding exposure was accounted for in the cumulative survival analysis
Selection: intervention group were all training participants on the register and the control group were respondents to a diverse range of recruitment strategies
Satten 1980 Differences at baseline reported on age, sex, helmet use, riding experience and exposure and previous training
Confounding factors were not dealt with in design or analysis
Selection: intervention group was selected from a list of training graduates and the control group was partly selected from a state register of motorcyclists
Jonah 1982 Differences at baseline reported on age, sex, riding experience, time licensed, previous training and alcohol use
Confounding factors were dealt with through multivariate analysis
Selection: intervention group was selected from a list of training graduates and the control group was randomly selected from the Ontario motorcycle operator file
Mortimer 1984 Differences reported at baseline on age, licence status, riding experience, years licensed and helmet use Confounding factors age, years licensed and rider experience were dealt with through stratification and riding exposure through standardisation
Selection: intervention group was selected from a list of training enrolees and the control group was selected from motorcycle dealerships during three successive Saturdays
Cooper 1988 Differences reported at baseline on age, gender, licensure and highway experience
Confounding factors age, gender, riding exposure, rider characteristics, rider attitudes and behaviour were accounted for in a multivariate analysis
Selection: there was no information on how the intervention and control groups were selected and from where
Mortimer 1988 Differences reported at baseline on years licensed, riding experience and helmet use
Confounding factors age, years licensed and rider experience were dealt with through stratification and standardisation of riding exposure. A regression analysis was also conducted but poorly reported and not usable
Selection: intervention group was selected from a list of training enrolees and the control group was selected from motorcycle dealerships
Adams 1985 Differences at baseline reported on previous crash rates Confounding factors not controlled for in analysis
Selection: the intervention group was a non-random sample of those offered training within the Australia Post motorcycle delivery riders, the control group were the remaining Post riders
Leung 1987 Differences at baseline reported on age and sex
Confounding factors age and sex controlled for in analysis by stratification
Selection: those exposed to training were MRC graduates, those unexposed were taken from the licensing records
Table 1. Risk of selection bias (Continued)
McDavid 1989 Differences at baseline other than matched characteristics were not reported
Confounding factors age, ownership of car licence, years licensed, previous crashes and offences accounted for through matching. Other confounding effects not controlled
Selection: intervention group was selected from a list of training graduates and the control group was selected from Bureau of Motor Vehicle records
Kloeden 1994 Differences at baseline reported were in geographical area of residence and in riding exposure Confounding factors were accounted for through exclusion of participants from rural areas Other confounding factors were not reported
Selection: the Ridersafe course was phased in based on postcode of rider’s home address, analyses were based on a database of those who obtained motorcycle rider learner’s permits of which about 2,000 were Ridersafe riders and about 5,000 were control riders
Billheimer 1998 Differences at baseline reported on age and previous riding experience
Other potential confounding factors assessed were riding exposure, primary purpose of riding and helmet use
Confounding factors accounted for by matching (age, sex, primary purpose of riding), standardisation (riding exposure) and stratification (previous riding experience)
Selection: the intervention group were those who had taken the rider training programme, the control group were California motorcycle riders matched on the above variables but who had not taken a riding course.
Perrino 2002 Differences at baseline reported were a higher number of females in the trained group and a higher proportion of experienced riders in the untrained group
Confounding factors were not accounted for in the analysis
Selection: the intervention group were those who had done the Motorcycle Riding Course, the control group had not done the course. Both groups were identified through a register of licensed motorcyclists
Kraus 1975 Population based case-control study
Cases: all motorcycle riders with a confirmed medically treated motorcycle injury (including fatalities) from all hospitals in study base and peripheral area hospitals and all deaths due to motorcycle crashes in the study base. All serious injuries (leading to hospitalisation) and fatalities likely to be included Community controls: a random sample of registered motorcycle owners in the study base
Potential confounders assessed were age, sex, weight, height, riding experience, motorcycle use, charac-teristics of motorcycle, and previous crashes and offences
Confounding factors were accounted for through exclusion of females and stratification by age and motorcycle use
Selection: cases and controls drawn from the same population
Hurt 1981 Population based case-control study
Cases and controls not drawn from the same population
Cases: motorcycle riders who had a motorcycle crash. Not all reported cases included
Community controls: motorcycle riders who passed the crash site at the same time of day and day of week that the crash occurred, but 2 years later
Potential confounders assessed were age, sex, time, type of motorcycle, roadway alignment, helmet use, weather conditions, road surface conditions
Confounding factors were accounted for through matching for time of day and day of week that crash occurred and stratification
Table 1. Risk of selection bias (Continued)
community controls from randomly selected sites matched for same time of day/day of week as the crash occurred
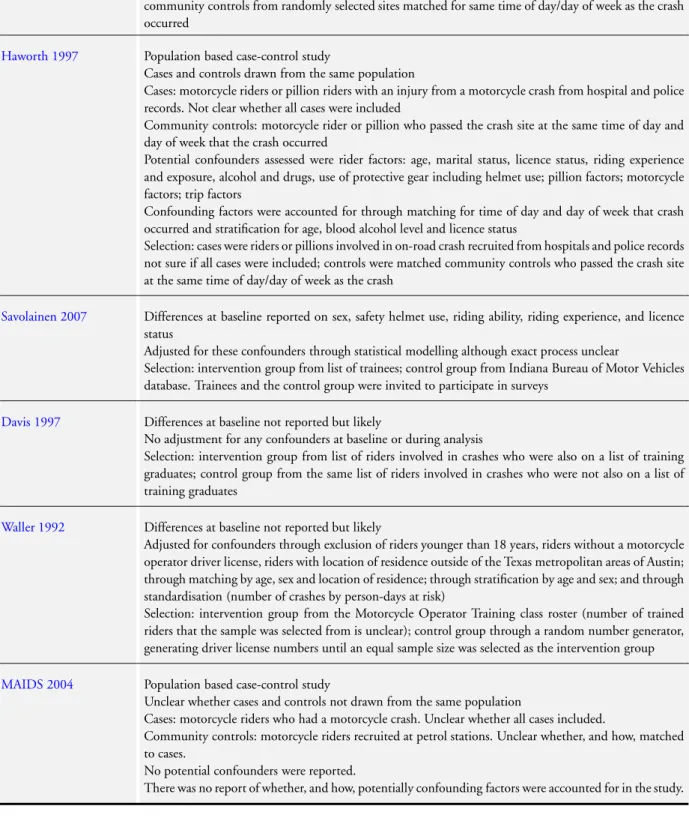
Haworth 1997 Population based case-control study
Cases and controls drawn from the same population
Cases: motorcycle riders or pillion riders with an injury from a motorcycle crash from hospital and police records. Not clear whether all cases were included
Community controls: motorcycle rider or pillion who passed the crash site at the same time of day and day of week that the crash occurred
Potential confounders assessed were rider factors: age, marital status, licence status, riding experience and exposure, alcohol and drugs, use of protective gear including helmet use; pillion factors; motorcycle factors; trip factors
Confounding factors were accounted for through matching for time of day and day of week that crash occurred and stratification for age, blood alcohol level and licence status
Selection: cases were riders or pillions involved in on-road crash recruited from hospitals and police records not sure if all cases were included; controls were matched community controls who passed the crash site at the same time of day/day of week as the crash
Savolainen 2007 Differences at baseline reported on sex, safety helmet use, riding ability, riding experience, and licence status
Adjusted for these confounders through statistical modelling although exact process unclear
Selection: intervention group from list of trainees; control group from Indiana Bureau of Motor Vehicles database. Trainees and the control group were invited to participate in surveys
Davis 1997 Differences at baseline not reported but likely
No adjustment for any confounders at baseline or during analysis
Selection: intervention group from list of riders involved in crashes who were also on a list of training graduates; control group from the same list of riders involved in crashes who were not also on a list of training graduates
Waller 1992 Differences at baseline not reported but likely
Adjusted for confounders through exclusion of riders younger than 18 years, riders without a motorcycle operator driver license, riders with location of residence outside of the Texas metropolitan areas of Austin; through matching by age, sex and location of residence; through stratification by age and sex; and through standardisation (number of crashes by person-days at risk)
Selection: intervention group from the Motorcycle Operator Training class roster (number of trained riders that the sample was selected from is unclear); control group through a random number generator, generating driver license numbers until an equal sample size was selected as the intervention group
MAIDS 2004 Population based case-control study
Unclear whether cases and controls not drawn from the same population
Cases: motorcycle riders who had a motorcycle crash. Unclear whether all cases included.
Community controls: motorcycle riders recruited at petrol stations. Unclear whether, and how, matched to cases.
No potential confounders were reported.
Table 2. Risk of allocation bias
Anderson 1980 Allocation concealment: unclear
Hall 1988 Allocation concealment: unclear
Swaddiwudhipong 1998 Allocation concealment: unclear
Table 3. Risk of detection bias
Anderson 1980 Blinding of outcome assessors: not reported
Driver records holding police recorded crashes and offences: not validated
Hall 1988 Blinding of outcome assessors: not reported
Driver records holding police recorded crashes and offences: not validated
Swaddiwudhipong 1998 Blinding of outcome assessors: not reported
Police and hospital records. Post mortem examination for deaths: not validated
Adams 1985 Blinding of outcome assessors: not reported
Australia Post crash records: not validated but argued that underreporting is unlikely
Leung 1987 Blinding of outcome assessors: not reported
Driver records holding police recorded crashes and offences
Raymond 1979 Blinding of outcome assessors: not reported
Self-report through personal interviews or questionnaires - both methods validated
Osga 1980 Blinding of outcome assessors: not reported
Self-report through structured questionnaires: validated by cross-checking with police recorded crash records
Satten 1980 Blinding of outcome assessors: not reported
Self-report through structured interviews or questionnaires - both methods were not validated
Intervention group were given telephone interviews but the control group mailed ques-tionnaires
Jonah 1982 Blinding of outcome assessors: not reported
Self-report through structured interviews: not validated. Driver records holding police recorded crashes and offences
Mortimer 1984 Blinding of outcome assessors: not reported
Self-report through questionnaires: not validated
Intervention group received mailed questionnaires but the control group received ques-tionnaires personally at the motorcycle dealership
Cooper 1988 Blinding of outcome assessors: not reported
Table 3. Risk of detection bias (Continued)
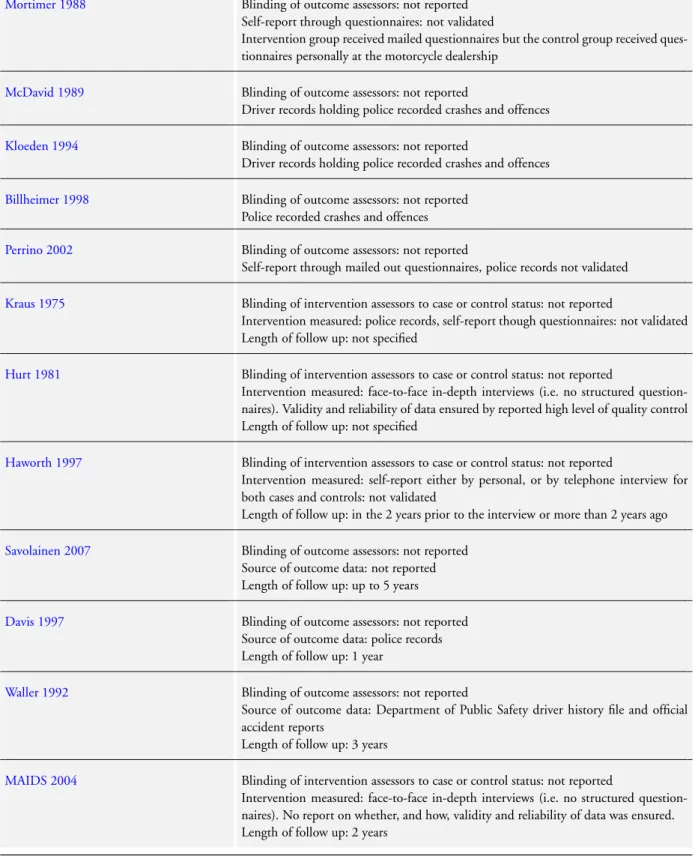
Mortimer 1988 Blinding of outcome assessors: not reported
Self-report through questionnaires: not validated
Intervention group received mailed questionnaires but the control group received ques-tionnaires personally at the motorcycle dealership
McDavid 1989 Blinding of outcome assessors: not reported
Driver records holding police recorded crashes and offences
Kloeden 1994 Blinding of outcome assessors: not reported
Driver records holding police recorded crashes and offences
Billheimer 1998 Blinding of outcome assessors: not reported
Police recorded crashes and offences
Perrino 2002 Blinding of outcome assessors: not reported
Self-report through mailed out questionnaires, police records not validated
Kraus 1975 Blinding of intervention assessors to case or control status: not reported
Intervention measured: police records, self-report though questionnaires: not validated Length of follow up: not specified
Hurt 1981 Blinding of intervention assessors to case or control status: not reported
Intervention measured: face-to-face in-depth interviews (i.e. no structured question-naires). Validity and reliability of data ensured by reported high level of quality control Length of follow up: not specified
Haworth 1997 Blinding of intervention assessors to case or control status: not reported
Intervention measured: self-report either by personal, or by telephone interview for both cases and controls: not validated
Length of follow up: in the 2 years prior to the interview or more than 2 years ago
Savolainen 2007 Blinding of outcome assessors: not reported
Source of outcome data: not reported Length of follow up: up to 5 years
Davis 1997 Blinding of outcome assessors: not reported
Source of outcome data: police records Length of follow up: 1 year
Waller 1992 Blinding of outcome assessors: not reported
Source of outcome data: Department of Public Safety driver history file and official accident reports
Length of follow up: 3 years
MAIDS 2004 Blinding of intervention assessors to case or control status: not reported
Intervention measured: face-to-face in-depth interviews (i.e. no structured question-naires). No report on whether, and how, validity and reliability of data was ensured. Length of follow up: 2 years
Table 4. Risk of attrition bias
Anderson 1980 Percentage of participants in analysis: 99% for the total group. Unclear for intervention and control groups separately
Hall 1988 Percentage of participants in analysis: 96%-97% for all intervention groups and 98% for the control group Swaddiwudhipong 1998 Percentage of participating sub-districts in analysis: 100% for both intervention and control sub-districts Raymond 1979 Percentage of participants in analysis: 74% for the intervention group and less than 57% for the control
group
Osga 1980 Percentage of participants in analysis: 73% for the intervention group and 100% for the control group Satten 1980 Percentage of participants in analysis is unknown. Initial sample size is unclear
Jonah 1982 Percentage of participants in analysis: 23% for the intervention group and 45% for the control group Mortimer 1984 Percentage of participants in analysis: 35% for the intervention group and 84% for the control group Cooper 1988 Percentage of participants in analysis: 98 % for the total group. Unclear for intervention and control
groups separately
Mortimer 1988 Percentage of participants in analysis: 40% for the intervention group and 90% in the control group Adams 1985 Percentage of participants in analysis: 61% for the total group. Unclear for intervention and control groups
separately
Leung 1987 Percentage of participants in analysis: unclear because initial sample size was not reported McDavid 1989 Percentage of participants in analysis: 40% of final matched cohort
Kloeden 1994 Percentage of participants in analysis: 39% for the intervention group and 6% for the control group Billheimer 1998 Percentage of participants in analysis: unclear percentage of the initial sample size
Perrino 2002 Percentage of participants in analysis: unclear percentage of the initial sample size Kraus 1975 Percentage of participants in analysis: 58% of cases, 59% of controls
Hurt 1981 Percentage of participants in analysis: 18% of cases, < 29% of controls Haworth 1997 Percentage of participants in analysis: 70% of cases, 47% of controls
Savolainen 2007 Percentage of participants in analysis: 18% for the intervention group and 15% for the control group Davis 1997 Percentage of participants in analysis: 100% for the intervention group and unclear for the control group
Table 4. Risk of attrition bias (Continued)
Waller 1992 Percentage of participants in analysis: unclear percentage for the intervention group and 100% for the control group
MAIDS 2004 Percentrage of participants in analysis: unclear for both cases and controls
R E S U L T S
Description of studies
See:Characteristics of included studies;Characteristics of excluded studies;Characteristics of ongoing studies.
Our search resulted in 102 studies that seemed relevant, of which we excluded 79 studies because they did not meet the criteria for considering studies for this review (seeCharacteristics of excluded studies).
Based on our criteria we included a total of 23 studies in this review. There were three randomised trials (Anderson 1980;Hall 1988; Swaddiwudhipong 1998), two non-randomised trials (Adams 1985; Leung 1987), 14 cohort studies (Raymond 1979;Osga 1980;Satten 1980;Jonah 1982;Mortimer 1984;Cooper 1988; Mortimer 1988; McDavid 1989;Waller 1992;Kloeden 1994; Davis 1997;Billheimer 1998;Perrino 2002;Savolainen 2007), and four case-control studies (Kraus 1975;Hurt 1981;Haworth 1997;MAIDS 2004).
Over half of the studies were conducted 20 or more years ago and the oldest was conducted 31 years ago. Only three studies were from this decade (Perrino 2002, MAIDS 2004, Savolainen 2007). Over 60% of the studies were conducted in the USA (Kraus 1975;Anderson 1980;Osga 1980;Satten 1980; Hurt 1981;Mortimer 1984;Leung 1987;Hall 1988;Mortimer 1988;Waller 1992;Davis 1997;Billheimer 1998;Perrino 2002; Savolainen 2007), three in Australia (Adams 1985;Haworth 1997; Kloeden 1994), three in Canada (Jonah 1982; Cooper 1988; McDavid 1989), one from the United Kingdom (Raymond 1979), one from Europe (with sampling areas located in France, Ger-many, Netherlands, Spain and Italy) (MAIDS 2004), and one in Thailand (Swaddiwudhipong 1998). Only seven studies were published in peer reviewed journals (Kraus 1975; Jonah 1982; Mortimer 1984;Cooper 1988;Mortimer 1988;McDavid 1989; Swaddiwudhipong 1998). The other studies were reports for high-way safety and road traffic organisations.
The studies by Anderson 1980, Hall 1988, Kloeden 1994, Billheimer 1998(the basic California Motorcyclist Safety Program component of the study) and Perrino 2002 examined manda-tory pre-licence training. Cooper 1988, McDavid 1989 and
Swaddiwudhipong 1998assessed non-mandatory training that, when passed, resulted in a licence.Raymond 1979,Osga 1980, Satten 1980,Jonah 1982,Mortimer 1984,Adams 1985,Leung 1987,Mortimer 1988,Waller 1992;Davis 1997,Billheimer 1998 (the Experienced Rider Course component of the study) and Savolainen 2007assessed non-mandatory training that could be taken by motorcycle riders with and without a licence. The case-control studies (Kraus 1975;Hurt 1981;Haworth 1997) assessed ‘any’ type of rider training and therefore could not be grouped by pre- or post-licence rider training. TheMAIDS 2004case-control study did make a distinction between participants having received compulsory pre-licence training or additional (non-compulsory) training. We did not find a study that compared one form of pre-or post-licence training (e.g. on-road, off-road, thepre-ory, pre-or a com-bination) versus another form of training. All studies compared either mandatory or non-mandatory formal training versus no for-mal training, with the exception ofHaworth 1997, who compared different levels of training courses (beginner, intermediate and ad-vanced).
We have presented a more detailed description of the individual studies inCharacteristics of included studies. We have provided a description below of the types of motorcycle rider training that were evaluated in the included studies.
Types of motorcycle rider training evaluated in the studies
The types of training were varied. Duration of training ranged from two or three hours to 24 hours administered over two or three days. Most training consisted of a theoretical and a practical component, usually off-road. The content ranged from provid-ing riders with manuals, lectures, discussions, showprovid-ing films and administering knowledge and skill tests. Little information was provided about the qualifications of trainers who conducted the training.
Six studies (Osga 1980;Satten 1980;Mortimer 1984;Mortimer 1988;Waller 1992;Savolainen 2007) assessed the effectiveness of the USA-based Motorcycle Safety Foundation’s Motorcycle Rider Course (MSF MRC). This course was released in 1976. It com-prises eight hours of theory (lectures, discussions, films and multi-ple choice tests), a textbook and 12 hours of off-road practice. The Motorcycle Safety Foundation is a national, not-for-profit
organ-isation sponsored by manufacturers and distributors of motorcy-cles. Many USA states have adopted the MSF Basic Rider Course and Experienced Rider Course (www.msf-usa.org) since its release in 1976.
The Motorcycle Operators Skill Test was also developed by the USA Motorcycle Safety Foundation in coopera-tion with others ( http://www.webbikeworld.com/motorcycle-training/motorcycle-test/). The MOST is a licensing test consist-ing of a manual, knowledge and skill test (comprisconsist-ing eight exer-cises of increasing difficulty and skill requirements) and a mini-skill test conducted with a simulator. Some studies compared this alternative licensing test to the standard licensing test. However, as the MOST is not a type of rider training, we have included only the two studies that assessed the MOST in combination with one or more training components in this review. BothAnderson 1980 andHall 1988assessed the MOST in combination with a train-ing component of three hours’ duration, consisttrain-ing of instructions about the skills needed to pass the MOST (30 minutes of the-ory and two and a half hours on the motorcycle).Hall 1988also assessed the MOST in combination with the Motorcycle Safety Foundation’s Motorcycle Rider Course as described above. Other USA studies evaluated the Wisconsin motorcycle rider course, a 22-hour off-street programme that teaches the basic rules of safe motorcycling (Leung 1987); the USA Maryland Motorcy-cle Rider Course (MRC), a mandatory (for those younger than 18 years) pre-licence 20-hour course comprising eight hours of theory and 12 hours of practice and created by the Maryland Motor Vehi-cle Administration in 1985 (Perrino 2002); the California Motor-cyclist Safety Program (CMSP), a mandatory (for those younger than 18 years) pre-licence 16-hour basic course (Billheimer 1998); and Experienced Rider Course (ERC) of eight hours’ duration (Billheimer 1998). The CMSP still offers these courses (http:// www.ca-msp.org/), but they are now MSF courses as described above.Davis 1997did not give any information about the assessed rider training.
The Canadian studies evaluated the British Colombia Safety Council’s 37-hour motorcycle safety programme (no further in-formation on the content was provided) (McDavid 1989); and the Canada Safety Council Motorcycle Training Program (MTP) comprising four hours of theory and 16 hours of practice (six hours on-road) over two weekends (Jonah 1982). The MTP course was made available in 1974 and is still being offered in Canada (http://www.safety-council.org/training/mtp/mtp.htm). Cooper 1988did not give any information about the assessed rider train-ing. However, the study was conducted in British Colombia in Canada in 1988, the same time as theMcDavid 1989study was conducted.
In the United Kingdom,Raymond 1979assessed the non-manda-tory RAC/ACU (Royal Automobile Club/Auto-Cycle Union) training scheme. The training programme consisted of either 24 one-hour sessions or 13 two-hour sessions. Twelve hours of the training focused on theory about basic operational procedures,
traffic laws and highway codes. The practical session focused on basic operational skills, riding on a training area and riding in traf-fic with an instructor. A protraf-ficiency test was administered at the end of the course.
One study from rural Thailand (Swaddiwudhipong 1998) evalu-ated a community-based rider education programme consisting of theory on motorcycle injury risk, helmet use, traffic laws, vehicle regulations and traffic signs, and a written and skill test leading to a licence.
The Australian studies evaluated a rider training course of 12 hours over two consecutive days (four hours of theory and eight hours of practice) administered to Australia Post telegram deliverers (Adams 1985), and a mandatory pre-licence Ridersafe course consisting of two tiers: the first tier being a training course on the basics of motorcycle riding, where a pass entitled the rider to obtain a learner’s permit; and the second tier being a skill test where a pass entitled the rider to obtain a probationary motorcycle licence. The training course consisted of two four-hour training sessions on separate days involving instruction, videos and actual riding on motorcycles. The skill test consisted of a four-hour preparation course of 74 minutes of lecture/discussion, 38 minutes of video and 75 minutes of on-course riding which was the testing phase (Kloeden 1994). The Rider Safe course is still being provided by Transport South Australia, a state government organisation (http:/ /www.transport.sa.gov.au).
The duration or content of rider training in the four case-control studies (Kraus 1975;Hurt 1981;Haworth 1997;MAIDS 2004) was not described.
Risk of bias in included studies
We describe the methodological quality of the included studies by study type below. More detailed information can be found in Table 1,Table 2,Table 3, andTable 4.
When considering the findings from these studies it is important to note the quality (or lack thereof ) of reporting of the studies. Quality of reporting is the extent to which a report provides in-formation about the design, conduct and analysis of a study (Jüni 2001).Huwiler-Müntener 2002found that even though trials may be well reported, it does not mean that the methodological quality is of equal standard; and well-conducted trials may never-theless be reported badly. The reporting quality of most studies in this review was poor. Most studies were old and did not meet con-temporary reporting standards. This made data extraction com-plicated. It also made it difficult to contact authors for additional information.
Because of significant heterogeneity between studies, as well as the poor quality of most studies, pooling of study results to calculate an overall measure of effect was not appropriate. Instead, we provided a description of our judgement of risk of bias in the text.
Risk of bias in the randomised trials
There were three randomised trials (Anderson 1980;Hall 1988; Swaddiwudhipong 1998).Anderson 1980andHall 1988had an initial sample size of 41,188 and 26,464 motorcycle licence ap-plicants respectively. Both studies assessed the effectiveness of the pre-licence MOST with a training component.Swaddiwudhipong 1998evaluated the effectiveness of a community-based rider ed-ucation programme in six districts.
Allocation bias
Anderson 1980reported using random birth date tables to allocate participants to either the intervention or control group.Hall 1988 reported the use of a computerised algorithm set in a central of-fice, but also used manual random assignment when the computer went down. Swaddiwudhipong 1998 reported ‘simple random sampling’ for the delivery of the intervention where the sampling frame included nine districts. Three districts were excluded since they were too hard to access. The remaining six districts were ran-domly allocated to the intervention (three) and the control (three) groups. Systematic sampling was then used, ordered by village size, for the villages within districts. Allocation concealment was not reported in any of the studies. The descriptions of randomisation in these studies suggest that there may have been limitations to the process, resulting in a lack of equivalence of the intervention and control groups at baseline, and therefore the possibility of allocation bias.Swaddiwudhipong 1998reported that before the intervention, the annual incidence rate of motorcycle-related in-juries was slightly (but not statistically significant) higher in the intervention areas than in the control areas. Participants in the intervention districts were also more likely to have a valid licence, and to wear a helmet more often than participants in the control districts.Anderson 1980measured differences at baseline on the participant and prior driving record variables and found these to be negligible.Hall 1988did not report on baseline differences between the intervention and control groups. As the Anderson 1980andHall 1988studies had sample sizes of over 40,000 and 26,000 respectively and used some form of randomisation, it is likely that any confounding factors at baseline would have been equally distributed between comparison and intervention groups.
Selection bias
After randomisation, Anderson 1980 and Hall 1988 excluded 0.8% and 3% participants, respectively, because of assignment to the wrong group, administration of the wrong intervention, or other reasons. The resulting lack of analysis by ’intention-to-treat’ can introduce bias by removing the effectiveness of randomisation. Nonetheless, the percentage excluded was small and the number of overall participants large, so it is unlikely to have had a major effect on the final results. In theSwaddiwudhipong 1998study, villages were systematically sampled into intervention or control
groups. The intervention was implemented, and outcomes of in-jury and death were measured, at a community level. Intervention and control districts were randomly selected, however there were only three intervention and three control communities.
Detection bias
None of the randomised trials reported blinding of outcome as-sessors. Data collection tools used byAnderson 1980andHall 1988were driver records holding police recorded crashes and of-fences.Swaddiwudhipong 1998used police and hospital records at a district level, and post-mortem examination for deaths. None reported on validity or reliability for any of the instruments.
Attrition bias
Anderson 1980andHall 1988had driver records available for 96% to 100% of participants. They also collected self-reported data but the response rate to the questionnaires was very low (low-est response rate 42% and 30% respectively). Attrition bias in Swaddiwudhipong 1998was not an issue, as outcome data were available for all sub-districts included in the trial.
The intervention reported inAnderson 1980andHall 1988 tri-als had an unanticipated effect on the participants. In both tritri-als, an average of only 28% of licence applicants in the intervention group eventually obtained their licence, compared to 35% in the control group. This indicates that the licensing process in general seems to have deterred applicants from obtaining a licence and, although no statistical tests of the difference were conducted, this deterrence appears even greater for those who had rider training. This is not true attrition bias, as the studies did not experience differential loss to follow up from outcome measurement. Instead, differential attainment of the intermediary step of licensure pre-cluded participants from being at risk for the outcomes of interest: they are not driving a motorcycle hence they are not at risk for motorcycle-related crashes, injury, death or offences. In short, it is not possible to assess whether a reduction in crashes in the inter-vention group would be due to changes in riding habits as a result of training, or simply due to delayed or never attained licensure.
Intervention integrity
NeitherAnderson 1980norHall 1988reported on the consis-tency in the way the intervention was administered; the possible ‘contamination’ of participants in the intervention group by other types of formal or informal rider training, or of participants in the control group by the intervention.Swaddiwudhipong 1998did not report on the number of villagers in each group that actually attended the intervention. However, they did report on a number of other potential training courses that were being implemented at the same time.
Analysis
Anderson 1980andHall 1988, acknowledging the ‘deterrent ef-fect’ described above, conducted two separate analyses. The first analysis included the total study population of licence applicants over two years from the time of their application (the population denominator). The second analysis was performed on the licensed (intervention and control) subgroups only, two years from the time of obtaining their licence (the licensed rider denominator). As only a third were licensed and exposed to riding the motorcy-cle, it was impossible to determine whether reported differences in crash rates across groups were due to the intervention or to other ‘confounding’ characteristics of those who were determined in their efforts to obtain the licence. When analysis was restricted only to those who gained their licence, the same difficulties re-mained. The benefits of the randomisation process were thus lost due to this lack of licensure of riders during the process. As there were only three intervention and three control groups in the study reported bySwaddiwudhipong 1998, analyses were hindered by small numbers for outcome comparisons between the intervention and the control districts.
Risk of bias in the cohort studies and non-randomised trials
We discuss the methodological quality of cohort studies (seven prospective studies (Raymond 1979;McDavid 1989;Waller 1992; Kloeden 1994;Billheimer 1998;Perrino 2002;Savolainen 2007) and seven retrospective studies (Osga 1980;Satten 1980;Jonah 1982; Mortimer 1984; Cooper 1988; Mortimer 1988, Davis 1997)) and non-randomised trials (Adams 1985;Leung 1987) in the one section as the biases for the two study types are similar. The quality of these studies was, in general, poor.
Selection bias
The confounding factors expected to have been addressed in the studies were: sex, age, riding experience, prior driving records (of-fences, crashes), previous training, and the following proxies for risk taking behaviour: helmet use, speed and alcohol/drug use. All of these factors have been shown to be associated with an increased risk of motorcycle crash (Peden 2004;Zambon 2006). The pos-sible source of bias in cohort studies and non-randomised trials is that groups may differ on important characteristics at baseline; participants ‘self-select’ into either the rider training group by de-ciding to undertake a rider training course, or into the ‘control group’ by deciding not to undertake a course. Participants who undertake a non-mandatory rider training course may differ from those who choose not to, on characteristics such as age, sex, rid-ing experience and ridrid-ing behaviour as well as other possible con-founders. For example, riders who take a training course may be more safety-conscious or, on the contrary may do so because they have previously experienced a crash, or because they perceive that
they have poor riding skills. Therefore ideally all participants in the intervention group need to be included in the study, as well as a random sample of controls taken from the same population as the intervention group. If that is not possible, intervention and control groups either need to be carefully matched to make them comparable, or differences at baseline need to be adjusted for in the analysis.
Most of the studies using a non-randomised trial or cohort design compared an intervention group to a control group that differed on a number of important factors. The studies in general failed to adjust for important differences found at baseline and their results cannot be meaningfully interpreted. Ten studies (Raymond 1979; Osga 1980;Satten 1980;Jonah 1982;Mortimer 1984;Mortimer 1988;McDavid 1989;Waller 1992;Davis 1997;Savolainen 2007) assessed intervention and control groups that were not drawn from the same population. In most of these cases the intervention group was selected from a list of training graduates who were usu-ally young, female and less experienced riders, whereas controls were recruited from a general population of motorcycle riders who were usually older, male and experienced riders. For three stud-ies it was unclear how they were selected (Leung 1987;Cooper 1988;Perrino 2002). OnlyKloeden 1994recruited groups from the same population of motorcycle applicants andAdams 1985 from a group of professional riders. Nevertheless, due to non-ran-dom selection of intervention and control groups, differences at baseline are likely, even though study groups were from the same population. Three studies adjusted for some confounding fac-tors found at baseline through matching (McDavid 1989;Waller 1992;Billheimer 1998). However, matching has limitations in terms of controlling for multiple confounders, especially those that are unknown to influence the effect of rider training on the out-comes. One study matched the control and intervention groups by excluding controls (approximately 3500 (66% of initial con-trol group) that differed from the intervention group) (Kloeden 1994). Five studies (Osga 1980;Satten 1980;Adams 1985;Davis 1997;Perrino 2002) did not adjust for differences between study groups at baseline, either in the study design or analysis. Results from these studies are therefore not reliable. The other six stud-ies (Raymond 1979;Jonah 1982;Mortimer 1984;Cooper 1988; Mortimer 1988;Leung 1987;McDavid 1989;Billheimer 1998) adjusted for some differences between groups at baseline by either bi-variate or multi-variate analyses, or stratification and standardi-sation of riding exposure (outcome/miles driven), or stratification by age group. The limitation of stratification is that it is difficult to control for many variables simultaneously because a large number of strata will need to be generated, resulting in small numbers that cannot be meaningfully analysed.Savolainen 2007developed sta-tistical models to assess the probability of a crash after taking the rider training course in an intervention and control group, while examining differences by sub-groups (e.g. age). Participation rates were also very low in this study, with only 558/4000 (13.95%) in the eligible intervention group and 588/4000 (14.7%) for the
control group completing surveys.
Detection bias
None of the studies reported blinding of outcome assessors to the intervention or control status of the participants. Seven studies used driver records containing police recorded data as their main measure of outcome (Leung 1987;Cooper 1988;McDavid 1989; Waller 1992;Kloeden 1994;Davis 1997;Billheimer 1998). An-other four studies (Raymond 1979;Satten 1980;Mortimer 1984; Mortimer 1988) only used self-report.Raymond 1979was the only study using self-report as the main outcome measurement in which study instruments were validated. Self-report might prevent the underreporting that has been described for the use of police-driver records (see ’Risk of bias’ in the randomised trials above) but has other risks of bias, especially if questionnaires or inter-view methods have not been validated and tested for reliability. Recall bias arises from mistakes in recollecting events, both be-cause of failures of memory and bebe-cause of looking at things ‘with hindsight’ and possibly changed views (http://www.cochrane.org/ resources/glossary.htm). As many studies were retrospective, risk of recall bias is likely and may have increased with length of follow up. For studies that used self-reported outcomes only, it is also possible that social desirability response bias played a role where participants in the training group may have felt it was ‘expected’ to report good driving histories. Multiple methods to measure the same outcome for both groups decreases the risk of detection bias, for example because self-reported answers can be cross checked with other sources of information such as driver records. In this regard, three studies (Osga 1980; Jonah 1982; Perrino 2002) used both self-report and driver records.Osga 1980found that for both intervention and control groups, more crashes were reported through self-report than on state crash records: an aver-age of 54% of self-reported crashes could be found back on state crash records. One industry-based study (Adams 1985) used oc-cupational health records which were not validated, but which are unlikely to suffer from underreporting due to work cover claims. Savolainen 2007used information on rider crashes for a five-year period, but did not specify from where this information was ob-tained.
Attrition bias
The majority of studies (Raymond 1979; Satten 1980;Adams 1985;Leung 1987;Kloeden 1994;Davis 1997;Billheimer 1998; Perrino 2002) inadequately reported on losses of participants to the study. We can therefore not be certain that there were no sys-tematic differences in the characteristics between the intervention and control group participants.Savolainen 2007reported the re-sponse rates to their baseline survey, but did not report on the per-centage of outcome data that was available for their study sample. A similar deterrent effect of rider training as described for the ran-domised trials (Anderson 1980;Hall 1988) occurred in two
stud-ies.Jonah 1982reported that 65% (1499/2310) of the trained rid-ers stopped riding, compared to 47% (949/2029) of the untrained riders. They excluded non-active and non-licensed riders before the study commenced so the differential choice to continue riding after training did not affect their analyses.Leung 1987reported that the percentage of participants in the intervention group ob-taining their licence was 50% (no number provided by authors) lower than in the control group. This may have biased the mea-surement of outcomes because unlicensed participants will not be exposed to riding the motorcycle and therefore not be at risk of being involved in a crash or violation. As explained above, this makes it difficult to assess whether the reduction in crashes in the intervention group is due to a change in driving habits or simply due to delayed licensure.
Mortimer 1984andMortimer 1988describe that about 44% and 30% of course graduates, respectively, were excluded from analysis because they had not ridden a motorcycle in the previous year. However, because these studies were retrospective and the controls were active riders at the time of recruitment, a decision on whether the deterrent effect was differential between the two groups could not be made. Though not reported quantitatively,Kloeden 1994 also describes the effect of rider training deterring individuals from becoming licensed and hence exposure to riding and risk of crash, death or offences involving a motorcycle.Osga 1980reported that 27% of the trained riders did not ride after the course, and excluded these from the analysis.
Use of different data collection strategies may have contributed to differential loss to follow up in the cohort studies.Satten 1980, for example, interviewed the intervention group over the tele-phone, but mailed questionnaires to the control group.Mortimer 1984andMortimer 1988distributed questionnaires in person to the control group, but mailed them to the intervention group. This may have played a role in the observed differential response rates where more subjects responded in the personally approached groups.
Survival bias
For those studies that assessed offences, crashes and injuries, but not death, survival bias may have also played a role. Motorcyclists who were fatally or seriously injured in crashes during the follow-up period after the intervention would have been less likely or unable to respond to surveys. This could bias the effect measures towards or away from the null. None of the studies wrote about this issue or examined the characteristics of those lost to follow up in order to address the possibility of survival bias.
Intervention integrity
Although the interventions were intended for the entire ‘exposed’ groups, most studies reported difficulty in tracking participants who received the intervention and those who did not.Adams 1985
estimated that 62% of the total study sample received the interven-tion. The remaining studies did not report the percentage of the study population that received the intervention as was intended, or reported that this percentage was unknown (Raymond 1979; Kloeden 1994;Satten 1980;Jonah 1982;Mortimer 1984;Leung 1987;Cooper 1988;Mortimer 1988; Billheimer 1998;Perrino 2002;Savolainen 2007). OnlyRaymond 1979reported the degree to which their intervention was delivered as intended. No studies reported on possible ‘contamination’ of participants by other inter-ventions than the one to which they were allocated. BecauseOsga 1980,Satten 1980,Jonah 1982,Mortimer 1984,Cooper 1988, Mortimer 1988,Waller 1992andDavis 1997were retrospective studies and participants were recruited from a list of graduates, it was known that they had completed and passed the course.
Analysis
In some studies, some participants who reported at baseline that they were untrained decided to enroll in a rider training pro-gramme after the baseline survey. The non-randomised trial by Adams 1985experienced this move of subjects from the untrained to the trained group, but failed to conduct analyses by ‘intention-to-treat’. This can bias the results in randomised and non-ran-domised trials if participants who changed groups differ signifi-cantly with regard to potentially confounding characteristics. On the other hand,Perrino 2002also experienced this move of sub-jects from the untrained to the trained group: more than 100 riders (5% of the total sample) originally stated that they were untrained at baseline, but then received training between the baseline and follow-up surveys. Yet, since thePerrino 2002study was a cohort, their analyses then proceeded by including those riders who were ‘newly’ trained as exposed. Riders who were ‘newly’ trained since baseline, but with a programme other than the one under study, were excluded from the analysis. Nevertheless, confounding fac-tors were not accounted for in the analyses.
McDavid 1989 matched exposed with unexposed subjects but could not find suitable matches for the majority (60%) of their subjects. They could therefore only conduct analysis on the result-ing 40% (139/346), which is an inappropriate and inefficient anal-ysis. Some studies that reported on the issue of non-active licensed riders (Satten 1980;Jonah 1982;Mortimer 1984;Mortimer 1988; Kloeden 1994) excluded non-active riders from analysis, intro-ducing selection bias as it is likely that riders who continued to ride differed with regards to potentially confounding character-istics across intervention and control groups.Kloeden 1994, for example, conducted several analyses to assess the effect of various sub-sets of the control group. Original analyses included all con-trols and led to erroneous results, since only a small proportion of controls had gone on to get a licence after their learner’s permit and were actually exposed to the possibility of experiencing a crash. Subsequent analyses compared only intervention and control sub-jects who had a licence.Waller 1992reported crashes by
person-days of exposure but did not explain how they could be sure that each study intervention and control participant was an active rider and actually exposed to the risk of experiencing a crash. Potential confounders that are unequally distributed by study arm at baseline need to be dealt with in the analysis.Satten 1980, Adams 1985andDavis 1997did not take into account any con-founding factors, either by design or in the analysis.McDavid 1989,Waller 1992andBillheimer 1998accounted for potential confounding factors at the design stage by matching the subjects in the intervention and control groups. Other studies (Raymond 1979;Mortimer 1984; Mortimer 1988;Perrino 2002and also Waller 1992) adjusted for one or two confounders by stratifica-tion or standardisastratifica-tion (e.g. crashes/miles driven, age group).Osga 1980conducted a univariate analysis of crash rates in which no po-tential confounders were accounted for, but also calculated cumu-lative crash rates by mileage travelled. OnlyJonah 1982,Cooper 1988andSavolainen 2007conducted a multivariate analysis.
Risk of bias in the case-control studies
A case-control design is suitable for the assessment of risk fac-tors for outcomes such as motorcycle crashes, injuries or deaths, but not appropriate for the evaluation of an intervention such as motorcycle rider training. It can potentially result in spurious conclusions regarding the efficacy of the intervention because the intervention has not been applied at random to an intervention and control group. Even with the control of possible confounders, using a case-control design to evaluate an intervention can lead to these kinds of results, since those who choose to undertake rider training may differ on important prognostic factors that affect the outcome, compared to those who do not choose to participate in rider training.
Selection bias
A potential source of bias in case-control studies, as with all other study types where the intervention is not randomly allocated to participants, is that comparison groups are likely to differ on po-tentially confounding characteristics. This means that ideally all cases need to be included in the study as well as a random sample of controls taken from the population that gave rise to the cases. If that is not possible, cases and controls either need to be carefully matched to make them comparable, or differences at baseline need to be adjusted for in the analysis. All four case-control studies were population based.Kraus 1975included all fatalities and injured cases leading to hospitalisation, and appropriately recruited a ran-dom sample of controls from the same population.Hurt 1981did not manage to recruit all, or a random sample of cases. Only half of the notifications of crashes to the police were received in time by the researchers; the research team, for unreported reasons, was only able to respond to half of those again. Data collection was therefore completed for only about a fifth of all cases. Neverthe-less, this was still a large sample of 900 cases.Haworth 1997, using
a similar study design was more likely to have included all cases, but this is not entirely clear from the study reported. It is unclear for example whether fatalities were included, as they did not use coroner’s reports for the recruitment of cases. TheMAIDS 2004 study was conducted in five European countries but it was unclear how cases were recruited; whether they were all cases during the two years that the study lasted or a random sample of all cases; what the response rates were etc. Controls were recruited from randomly selected petrol stations but it was likewise not clear what the eligibility criteria for inclusion in the study were, how they were recruited (e.g. randomly), and what the response rate was. Hurt 1981andHaworth 1997both matched controls to cases by recruiting them at the same time of day and same day of week as the crash occurred.Hurt 1981, however, recruited controls two years later, and it is likely that there would have been differences between the two comparison groups. One important difference was that during data collection for cases, there was very little specialised motorcycle training available in the study region, whereas two years later, when control data were collected, there was some training available.
These four case-control studies also suffered from selection bias due to potential differences between those that gave consent to participate in the study and responded to interviews and question-naires and those that did not. None of the studies have assessed such differences, althoughHurt 1981did acknowledge that con-trols giving consent to cooperate may have differed from those motorcyclists who did not.
Detection bias
Measures that can be taken to reduce detection bias in case-con-trol studies are: blinding of interviewers for case or concase-con-trol status; blinding of the participant for the study factor of interest; validat-ing measurement instruments and usvalidat-ing these in an identical way for cases and controls; and cross checking self-reported informa-tion with other, more objective sources such as registers. None of the studies reported blinding of the intervention assessors to case or control status but all used consistent measurement methods for both case and control groups.
All case-control studies used self-report as their main measure to assess whether cases and controls had received rider training and if so, the type of training. The major potential source of bias in case-control studies, when self-report is used as a measure, is recall bias. One way of reducing recall bias is by double-checking self-reported data with more objective data.Kraus 1975also used po-lice accident reports for information on rider characteristics but such information was not available about rider training.Haworth 1997andMAIDS 2004did not report on any measures to limit recall bias. Hurt 1981reported further questioning of cases by the interviewer when answers did not make sense or when par-ticipants seemed to contradict themselves as part of the in-depth unstructured interview technique. This qualitative research
tech-nique can result in valuable information, but as interviewers were not blinded to case or control status of the participants, it may have led to more thorough examination of cases compared to the controls, and thus differential detection bias.
Intervention integrity
The level of detail about the rider training provided in the case-control studies differed significantly but was minimal for each. Kraus 1975simply asked whether ‘any’ motorcycle rider training had ‘ever’ been carried out;Hurt 1981asked participants whether they had been self taught, informally taught or completed formally taught rider training courses.MAIDS 2004asked whether partic-ipants had had pre-license training, additional (non-compulsory) training, other training, or no training, whereasHaworth 1997 asked about the number of courses that a participant had com-pleted, whether they were basic, intermediate or advanced courses, and how long ago the training had been done. None of the case-control studies reported collecting information about further de-tails about any training programmes (e.g. type of training, cur-riculum, duration of training).
Analysis
Kraus 1975accounted for confounding factors through the exclu-sion of females, and stratification by age and frequency of motor-cycle use.Hurt 1981matched cases and controls for time of day and day of the week that the crash occurred, and did not adjust for any confounding factors in the analysis.Haworth 1997matched groups for time of day and day of the week that the crash occurred, and stratified by age, blood alcohol level and licence status in the analysis. None of the studies used multivariate methods.MAIDS 2004did not provide any information about any participant char-acteristics other than the study exposures of interest, and did not describe any methods to adjust for potential confounding factors.
Effects of interventions
We have presented the results in a descriptive manner due to the substantial heterogeneity in study types, interventions and out-comes, and the generally poor quality of the studies. We have grouped the interventions by mandatory and non-mandatory pre-licence rider training and post-pre-licence rider training, and further by study type and by outcome (crashes, injurious and fatal crashes, and offences). We discuss results that are reported as statistically significant (whether a P value was reported or not).
Pre-licence rider training - mandatory