THE UPWARD SHIFT OF THE DRY SNOW LINE
ON THE NORTHERN ANTARCTIC PENINSULA
Frank Rau
Department of Physical Geography, University of Freiburg, Werderring 4, D-79085 Freiburg, Germany
Phone: +49-(0)761-2033550 Fax: +49-(0)761-2033596 e-mail: frank.rau@ipg.uni-freiburg.de
ABSTRACT
The central and northern parts of the Antarctic Peninsula are regions of Antarctica, where substantial climate warming has been documented over the past decades. However, as most information is restricted to the coastal areas, detailed information on the impact of the actual warming on the higher parts of the central mountain chain of the Peninsula is still lacking. Due to the absence of direct measurements in these areas, mapping the dry snow line by means of SAR-imagery provides an effective tool for monitoring purposes. Hereby, the dry snow line is regarded as the uppermost limit of frequent or occasional surface melt. It separates the dry snow zone covering the highest parts of polar glaciers and ice sheets from the percolation zone of the lower areas. In SAR-imagery, the corresponding dry snow radar zone is characterised by an extraordinary spatial and temporal radiometric stability of the backscatter values. It is not affected by any seasonal variations. The only mechanism that is believed to be able to cause a significant upward shift of the dry snow line is a change of the snow cover properties under melting conditions. Conversely, a downward shift of this boundary line is a consequence of continuous accumulation of dry and fine-grained snow and the absence of any melt event at the corresponding altitude range during several years. The present study based on multi-year ERS-1/2 data (1992 – 2000) investigates the dry snow line position on the eastern Antarctic Peninsula between 65.0° and 68.0° South. While there is no evident signal from the northern part detectable, a significant upward shift of the dry snow line was detected in the south of 65.7°S in the investigated area. This is interpreted as a direct response to the increasing number of high temperature events during the 1991-2000 decade.
INTRODUCTION
Antarctica is often considered to be a barometer of climate change. The white continent is an integral part of the global climate system and is interconnected by a variety of processes on different temporal and spatial scales to the lower latitudes. As a consequence, Antarctica influences and is influenced by global climate variabilities and changes. In particular, the margins of the highly glaciated Antarctic continent are of special interest to climate research. Their location at the border between terrestrial and marine geo-systems, as well as in the transition of various atmospheric circulation systems, results in a high sensitivity towards changes and regional shifts in these systems.
As the only terrestrial link between the polar parts of the central Antarctic Continent and the temperate northern latitudes, the Antarctic Peninsula is a key area for investigating the impact of climate change. It has become increasingly apparent over the past few years that the peninsula, already the warmest sector of Antarctica, is subject to a severe regional warming. Meteorological records revealed an increase of mean annual air temperatures with a significant trend of 0.02 - 0.04 K a-1 over the past five decades for both the western and the eastern side (1). As a consequence of changing atmospheric pressure systems, changes in the precipitation regime (2) are expected to cause an alteration of the accumulation and ablation patterns of the glacial systems. The recession
of glaciers and the rapid disintegration of ice shelves (summarised in 3) dramatically indicate the changing environmental conditions in this region (Fig. 1).
Figure 1: Indicators of a climatic change on the Antarctic Peninsula. The rapid disintegration of ice shelves on both sides of the Antarctic Peninsula indicates the changing environmental conditions of this region. However, these spectacular events are only the most dramatic indicators of pronounced climatic and glaciological changes in this area.
Although the Antarctic Peninsula is the region with the densest network of permanently operating research stations and the longest meteorological records on the Antarctic continent, most information is restricted to the northern coastal areas, which invariably neglects the peninsula’s mountainous topography and the longitudinal extension of more than 1,200 km. Data from higher regions, particularly the central plateau area with mean altitudes over 1,500 m asl, are scarce or entirely lacking. Consequently, immense uncertainties remain about the spatial and temporal variabilities of the glacial systems and the impact of the actual climatic change on these areas. As field work is generally hindered by harsh environmental conditions and logistical difficulties, remote sensing techniques therefore offer a powerful means of monitoring changes in higher altitudes at a variety of temporal and spatial scales. Due to the frequent cloud cover and the extensive periods of darkness during the polar winter, especially data from orbital synthetic aperture radar (SAR) sensors facilitate the analysis of surface properties of these areas. Due to the fact that microwave radar signals penetrate the snow surface providing sub-surface information on snowpack
properties, SAR data furthermore enables different snow cover types to be classified. In general, the suitability of SAR-imagery for mapping glacier snow zones or snow facies zones in polar regions has previously been demonstrated by several authors (e.g. 4, 5, 6, 7). Since the formation and distribution of these snow zones that can be observed in SAR-imagery depend on the prevailing weather conditions prior to and during image acquisition, the actual positions of the boundary lines between different zones provide information on actual and recent meteorological parameters (8). Previous results from a regional case study from the Marguerite Bay indicated an upward shift of the dry snow line on the eastern side of the Antarctic Peninsula at 68° S during the decade 1991 - 2000 (9). This paper focuses on the derivation of the dry snow line position on the central Antarctic Peninsula north of 70° S from ERS-1/2 repeat pass imagery and discusses its interpretation as an indicator of climatic changes impacting the highest sectors of the peninsula’s central plateau area. Radar Glacier Zones
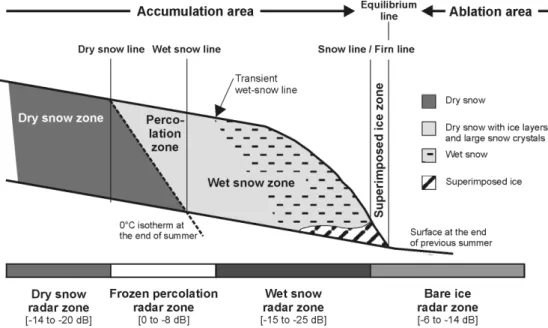
The backscatter signal from snow and glacier surfaces is affected by sensor parameters as well as by snow cover parameters. SAR-images of polar glaciers and ice sheets show a typical sequence of alternating dark and bright signatures. These signatures are caused by specific backscatter mechanisms, which in turn are affected by the prevailing snow cover parameters such as liquid water content, snow density, grain size, stratigraphy, and surface roughness. Due to its sensitivity to liquid water within the snowpack, SAR data offer the possibility of discriminating wet and frozen snow zones on a glacier. Since SAR data also provide information from deeper layers of a dry snow cover, a more detailed classification of snow zones on glaciers is facilitated. Depending on the actual snow properties resulting from metamorphic processes driven by the prevailing meteorological conditions, these snow zones are dynamic on a time scale from days to weeks and show remarkable seasonal variations. Consequently, they do not necessarily coincide with the characteristics of the classical glaciological snow zones (10), and as such they should be referred to as radar glacier zones (e.g. 5, 7, 8; Fig. 2).
Figure 2: Glacier snow zones and the corresponding radar glacier zones with typical backscatter values from the Antarctic Peninsula (situation during ablation season).
In this study, we adopt the classification scheme proposed by (7) which distinguishes between the dry snow, frozen percolation, wet snow, and bare ice radar glacier zones. Hereby, the dry snow radar zone is restricted only to the highest areas, in which the temperatures never rise above freezing. On the Antarctic Peninsula, high accumulation rates, the absence of melt events, and the prevailing dry snow metamorphism result in small grain sizes of the snow crystals and a moderately layered snow-pack without ice layers. Due to the high penetration depth and dominating volume
scattering, the dry snow radar zone on the Antarctic Peninsula is characterised by low backscatter values. Contrary to that, significantly higher radar returns from the dry snow zone can be observed in central Antarctica, where extremely low accumulation rates and formation of depth hoar layers lead to a more distinct stratification of the snow-pack and, therefore, to higher backscatter values due to enhanced signal reflection at the layer boundaries (11). In the snow-pack of the frozen percolation radar zone, frequent or occasional melt-freeze-cycles lead to the formation of numerous subsurface ice bodies and large grain sizes. While in a dry and frozen state, both ice layers and large snow grains act as strong scatterers of the radar beam. This results in high backscatter values from the frozen percolation radar zone. During melt events, the liquid water content in the snow-pack increases. As liquid water absorbs a large portion of the incoming microwave, the penetration depth is reduced to the uppermost centimetres. If the snow surface is smooth, specular reflection causes the dark appearance of a melting snow cover in a SAR-image. In the bare ice radar zone, surface scattering causes a relatively strong backscatter signal in comparison to the wet snow radar zone.
Figure 3: Summer distribution of radar glacier zones on the Antarctic Peninsula north of 70° South (5 January 1999; left) and spatial distribution of the dry snow radar zone on the central plateau of the Peninsula (right). The box indicates the position of ERS-1/2 SAR-mosaics (RADARSAT ScanSAR-mosaic, Polarsterographic Projection).
The Dry Snow Radar Zone on the Northern Antartic Peninsula
In general, a dry snow zone can only be found on the highest parts of polar glaciers and ice sheets. On the northern Antarctic Peninsula, it is limited to the upper parts of the plateau-like central mountain chain, that are characterised by a mean annual surface air temperature below –11°C (12; Fig. 3). Analysis of RADARSAT ScanSAR data resulted in a total size of the dry snow radar zone on the Antarctic Peninsula north of 70° S of 23,300 ± 2,000 km² which corresponds to 19.7 ± 1.7% of the land surface disregarding the ice shelves (9).
Dry snow metamorphism caused by compaction due to gravity and wind action, and recrystallisation due to internal temperature and moisture gradients determine snow cover properties. Under these conditions, the dominating factors which affect the backscatter coefficient are snow density, crystal size and crystal form. The low radar returns that can be observed on the Antarctic Peninsula consistently throughout all seasons are caused by a high penetration depth and predominant volume scattering of the radar signal. Surface scattering is negligible. Typical backscatter values of the dry snow radar zone on the Antarctic Peninsula range from –14 to –18 dB. Generally the dry snow radar zone is characterised by an extraordinary spatial and temporal radiometric stability of the backscatter values and is not affected by seasonal variations (6).
Downwards, the dry snow radar zone is bounded by a transition zone, where backscatter values increase from –14 to –8 dB, leading to the lower lying frozen percolation radar zone, which is identifiable by values above –8 dB (6, 8). The dry snow line can be identified as a temporarily and spatially persistent feature in SAR-imagery. The only mechanism that is believed to cause a significant upward shift of the dry snow line is a change from dry to wet snow metamorphism. This implies at least a short-term impact of high temperatures close to the melting point leading to enhanced grain growth, and therefore higher backscatter values. Conversely, a downward shift of this boundary line is an indicator of continuous accumulation of dry and fine-grained snow and the absence of any melt event at the corresponding altitude during several years. Model results indicate that backscatter values decrease sharply when the layer of accumulated dry snow exceeds the penetration depth of the radar signal (8). Hence, analysing the dry snow line by means of multi-temporal SAR-imagery facilitates the posterior detection of singular extreme high temperature events impacting even the highest areas. It also enables periods with minor variations of meteorological conditions and therefore constant snow cover properties to be recognized (8, 9). Satellite Imagery and Data Processing
A set of 9 repeat pass ERS-1/2 PRI images (descending orbit, frame 5013, track 467), acquired between 8 July 1992 and 26 February 2000, were used to analyse the dry snow line position on the plateau region of the inner sectors of Marguerite Bay (68.0° South, 66.5° West). Additionally, two orbit stripes, each composed of 6 ERS-1/2 PRI images from 8 July 1992 and 26 February 2000 respectively, were used to generate 2 SAR-mosaics covering the central part of the Antarctic Peninsula between 65.0° and 68.0° southern latitude. All imagery was recorded at the German Antarctic Receiving Station (GARS; Antarctic Peninsula). For all images, normalised backscatter coefficients were computed (including corrections for the backscatter coefficient dependence on incidence angle and for Analogue to Digital Convertor (ADC) non linearities; 13) using the ESA SAR Toolbox. Further image processing included ortho-rectification, projection (Polar Stereographic, standard parallel 71° South; WGS 84), co-registration and mosaicking using ERDAS Imagine 8.5. Elevation data was provided by the RADARSAT Antarctic Mapping Project Digital Elevation Model (RAMP DEM; 14). Image speckle was reduced applying a 5*5 median filter. The spatial extent of the dry snow radar zone on the Antarctic Peninsula was identified by mapping all areas with a backscatter coefficient of less than –14 dB. This threshold value was derived from backscatter modelling based on snow pit and ice core data (8, 9). In addition, analysis of SAR-imagery from ERS-1/2 and RADARSAT indicates that this threshold is appropriate to identify the dry snow radar zone on the Antarctic Peninsula, because it consistently demarcates the uppermost areas, which are characterised by low backscatter values and the absence of any multi-temporal signatures (6). A sensitivity study using imagery of both sensors was performed to verify the integrity of this approach. This study indicated that classification results vary only slightly when incrementally decreasing threshold values are applied. Contrary to that, a similar increase with increments of 0.5 dB led to significant changes in both the spatial distribution and the absolute dimension of the classified area. Furthermore, comparison of nearly concurrent imagery from ERS-1 (22 March ERS-1996) and ERS-2 (23 March ERS-1996) displayed excellent agreement of both data sets.
The accuracy of the approach is estimated to approximately ± 1.0 dB, which is in the same magnitude as the calibration accuracy of ERS-1/2 (absolute: ± 0.4 dB; 13). Furthermore, the influence of different sensor polarisation can be neglected, as the SAR backscatter returns from such a dry snow-pack result predominantly from volume scattering and no significant differences can be detected for co-polarised data (11). Due to insufficient DEM resolution, no further corrections for terrain-induced incidence angle variations were applied.
RESULTS AND DISCUSSION
The temporal variation of the dry snow line was investigated in a regional case study from the inner Marguerite Bay, near the Argentine research station San Martín (68.1°S, 67.1°W; Fig. 3) by means of ERS-1/2 imagery acquired between 1992 and 2000. Applying the threshold approach described above, the position of the dry snow line was identified in each scene (Fig. 4). While on the precipitous west-facing slopes a potential position change may be obscured by the relief, a significant upward shift of this boundary line can be monitored on the gently inclined eastern slopes of the central mountain chain.
Figure 4: Upward shift of the dry snow line on the eastern side of the central plateau of the Antarctic Peninsula near the Argentine research base San Martín (Marguerite Bay, 68° South) during the 1990s.
In the image acquired on 8 July 1992, the dry snow line on the eastern side of the plateau region can be identified at an altitude range of between 1,000 and 1,150 m asl. Hereby, lower dry snow line positions can be identified on slopes with a southerly aspect, whereas higher positions generally correspond to north-facing areas. During the 1992/93 summer season, a significant upward shift of the dry snow line can be detected. In the subsequent years, a steady increase of the dry snow line altitude can also be observed. A particularly significant upward shift occurred between 1993 and 1996 and between 1998 and 2000, resulting in an altitudinal range between 1,200 and 1,300 m asl for the dry snow line position in 2000. For the entire time period, a maximum increase of more than 200 m in some areas on the plateau can be measured, while shift rates on the steeper slopes leading
down to the Larsen Ice Shelf are lower. In the entire area displayed in figure 4, mean shift values range from 100 to 150 m (1992 – 2000).
Based on the same approach, dry snow line positions on the eastern Antarctic Peninsula between 65.0°and 68.0° South were derived from two ERS-1/2 SAR-mosaics of 8 July 1992 and 26 February 2000, respectively (Fig. 5). In 1992 the dry snow line altitude increased steadily with decreasing latitude, from 1,000 to 1,150 m asl in the South to 1,600 to 1,800 m asl in the northern parts of the investigated area. This is in agreement with the corresponding climatic conditions. In comparison, analysis of the SAR-mosaic from 2000 revealed a significant upward shift of 100 to 150 m in the southern sector south of 65.7°S; whereas no consistent change in the dry snow line position is detectable in the northern part. Although an increase of dry snow line altitude in the range of 50 to 100 m can be measured in some parts of this sector, only minor variations or even constant positions are identifiable in others.
Figure 5: Positions of the dry snow line on the central Antarctic Peninsula between 65° and 68 ° South.
The observed upward shift of the dry snow line on the eastern side of the Antarctic Peninsula south of 65.7°S is interpreted as a direct response to high temperature events that have led to enhanced metamorphic processes affecting the snow cover, even in the high plateau area. An analysis of the frequency of daily maximum air temperatures from the San Martín record (Fig. 6) clearly indicate the increase of events exceeding +5°C during the decade 1990-99. In particular, the marked upward shift during the 1992/93 summer season is attributed to the impact of the extraordinarily high number of events exceeding +5°C, which were recorded on San Martín base in that period. These results are further supported by the findings of (15) and (3), who consistently report an increase in the number of days with snowmelt for the 1991-2000 decade in the northern sector of Marguerite Bay and the Larsen Ice Shelf, respectively. The measured rise in elevation of the dry snow line
indicates an increase of maximum temperatures at these altitudes of more than 2 K during the investigated period.
Figure 6: Frequency of diurnal surface air temperature maximums exceeding +5°C derived from the San Martín record (1976-99).
For the northern sector of the study area, further research is necessary in order to draw detailed conclusions on changes affecting the uppermost plateau regions. Since various climate indicators in this sector of the peninsula, including meteorological records and the ongoing disintegration of the Larsen Ice Shelf, clearly indicate severe changes of the climatic conditions, the lack of a significant signal from SAR-derived snow cover records might be attributed to higher precipitation rates in these regions due to changed atmospheric circulation patterns. Thus, the enhanced advection of warm and moist air masses from north-westerly directions and the consequently enhanced accumulation in high altitudes would obscure the effects of summer high temperature events impacting the snow cover in the corresponding areas.
CONCLUSIONS
Based on the analysis of multi-temporal ERS-1/2 SAR-imagery, the position of the dry snow line on the eastern side of the northern Antarctic Peninsula was identified. An approach using a threshold of -14 dB was employed to delimit the dry snow radar zone. The practicability of this approach was confirmed previously by analysis of RADARSAT ScanSAR data (9) and by consistent identification of the dry snow line in nearly synchronously acquired imagery from the tandem phase of ERS-1 and ERS-2 in March 1996. Remaining uncertainties are predominantly caused by errors in the topographic data-base.
The position of the dry snow line increased from a minimum altitude of approximately 1,000 m asl at 68.0° South to 1,600 m asl at 65.0° South with observed deviations being attributed to locally varying conditions such as altitude, aspect, and local accumulation rates. The observed upward shift of this boundary line in the southern sector during the investigated time period of 1992 to 2000 is interpreted as a direct result of the increasing number of high temperature events affecting the snow cover in the uppermost regions. Due to missing ground truth information and the lack of higher temporal resolution of available SAR data, no explicit statements can be made regarding changing conditions for the northern section of the study area.
The presented observation adds another aspect to the effects of the regional warming trend on the Antarctic Peninsula already reported. Furthermore, these findings also confirm the capability of SAR-derived dry snow lines to serve as indicators of climate variability in remote high-altitude areas of the polar regions.
ACKNOWLEDGEMENTS
The results presented are part of the activities of the Department of Physical Geography (University of Freiburg) as Regional Center ‘Antarctic Peninsula’ in the project ‘Global Land Ice Measurements from Space’ (GLIMS). This research is supported by the Deutsche Forschungsgemeinschaft (SA 694/2-2). Satellite imagery was provided by the European Space Agency (ESA) projects 'Monitoring of dynamic processes in Antarctic geosystems' (AO2.D149) and ‘Midterm monitoring of snow cover characteristics by ERS-1/2 SAR-imagery on the Antarctic Peninsula’ (AO3.D196). The author would like to thank the Instituto Antártico Argentino (Buenos Aires) and the crew from Base San Martín. Special thanks to Steffen Vogt, Robert Steiner and Scott Hemphill for helpful comments and final proof-reading.
REFERENCES
1. Comiso, J. C. 2000. Variability and trends in Antarctica surface temperatures from in situ and satellite infrared measurements. J. Climate. 13: 1674-1696.
2. Turner, J. S., Colwell, R. and Harangozo, S. 1997. Variability of precipitation over the coastal western Antarctic Peninsula from synoptic observations. J. Geophys. Res. 102 (D12): 13999-14007.
3. Scambos, T. A. et al. 2000. The link between climate warming and break-up of ice-shelves in the Antarctic Peninsula. J. Glaciol. 46 (154): 516-530.
4. Jezek, K. C. et al. 1993. Analysis of synthetic aperture radar data collected over the southwestern Greenland ice sheet. J. Glaciol. 39 (131): 119-132.
5. Smith, L. C. et al. 1997. Seasonal climatic forcing of alpine glaciers revealed with orbital synthetic aperture radar. J. Glaciol. 43 (145): 480-448.
6. Partington, K. C. 1998. Discrimination of glacier facies using multi-temporal SAR data. J. Glaciol. 44 (146): 42-53.
7. Rau, F. et al. 2000. Monitoring multi-year snow cover dynamics on the Antarctic Peninsula. Polarforschung. 67 (1/2): 27-40.
8. Rau, F. et al. 2001. Radar glacier zones and their boundaries as indicators of glacier mass balance and climatic variability. Proceedings of the 2nd EARSeL Workshop - Special Interest Group Land Ice and Snow, June 16-17, 2000, Dresden: 317-327. EARSeL eProceeding No. 1, Paris.
9. Rau, F. and Braun, M. 2002. The regional distribution of the dry snow zone on the Antarctic Peninsula north of 70° South. Ann. Glac. 34: 95-100.
10. Benson, C. S. 1996. Stratigraphic studies in the snow and firn of the Greenland ice sheet. SIPRE Res. Rep. 70 (Revised edition of 1962 report).
11. Rott, H., Sturm, K and Miller, H. 1993. Signatures of Antarctic firn by means of ERS-1 AMI and by field measurements. Proc. First ERS-1 Symposium. ESA SP 359: 227-233.
12. Peel, D. A. 1992. Spatial temperature and accumulation rate variations in the Antarctic Peninsula. The contribution of Antarctic Peninsula ice to sea level rise edited by Morris, E. M. British Antarctic Survey Ice & Climate Special Report No. 1.
13. Laur, H. et al. 1998. Derivation of the backscattering coefficient σ° in ESA ERS SAR PRI products. ESA Document ES-TN-RS-PM-HL09, Issue 2, Rev. 5b.
14. Liu, H., Jezek, K. C. and Li, B. 2000. RADARSAT Antarctic Mapping Project Digital Elevation Model. National Snow and Ice Data Center. Data available by FTP.
15. Fox, A. J. and Cooper, A. P. R. 1998. Climate-change indicators from archival aerial photography of the Antarctic Peninsula. Ann. Glaciol. 27: 636-642.