Representation and visualization of variability in a 3D anatomical
atlas using the kidney as an example
Silke Hacker and Heinz Handels
Department of Medical Informatics, University Medical Center Hamburg-Eppendorf, Martinistr. 52,
20246 Hamburg, Germany
ABSTRACT
Computer-based 3D atlases allow an interactive exploration of the human body. However, in most cases such 3D atlases are derived from one single individual, and therefore do not regard the variability of anatomical structures concerning their shape and size. Since the geometric variability across humans plays an important role in many medical appli-cations, our goal is to develop a framework of an anatomical atlas for representation and visualization of the variability of selected anatomical structures. The basis of the project presented is the VOXEL-MAN atlas of inner organs that was created from the Visible Human data set. For modeling anatomical shapes and their variability we utilize “m-reps” which allow a compact representation of anatomical objects on the basis of their skeletons. As an example we used a statistical model of the kidney that is based on 48 different variants. With the integration of a shape description into the VOXEL-MAN atlas it is now possible to query and visualize different shape variations of an organ, e.g. by specifying a person’s age or gender. In addition to the representation of individual shape variants, the average shape of a population can be displayed. Besides a surface representation, a volume-based representation of the kidney’s shape variants is also possible. It results from the deformation of the reference kidney of the volume-based model using the m-rep shape description. In this way a realistic visualization of the shape variants becomes possible, as well as the visualization of the organ’s internal structures.
Keywords: Visualization, Visible Human, variability, shape modeling, anatomical atlas
1. INTRODUCTION
Computer-based 3D models of the human body have become an important tool for learning and teaching anatomy. In contrast to the classical knowledge representation in books and printed atlases, computerized anatomical atlases that are based on such models allow interactive exploration of the human anatomy and make it easier to comprehend spatial relationships. 3D models of the human body can be constructed from cross-sectional images generated e.g. by computer tomography (CT) or magnetic resonance imaging (MRI). With the Visible Human project1,2 high resolution cross-sectional photographic images became available that are suited for the generation of high-quality models. Similar projects with photographic datasets of even higher resolutions followed, as e.g. the Chinese Visible Human or the Visible Korean Human. data set. Using these datasets numerous research projects for the development of digital atlases and 3D models of the human body came into life.
Besides the high quality computer-based anatomic atlases have reached these days, there are still improvements to be made. A major limitation is that in most cases 3D atlases are derived from one single individual, and therefore are not representative for the human anatomy in general. Yet, anatomical structures exhibit major differences with respect to size and shape, which is partly due to natural variability, but also subject to factors like age, gender, diseases and habits. Since the morphological variability across humans plays an important role in many medical applications, the inclusion of variability into an anatomical atlas would be a great advancement. Such an atlas might be able to answer questions like the following:
- What range of variation of organs is considered “normal”? - How does their shape change during growth and ageing? - In what way is it affected by disease?
- How is the shape of an anatomical structure related to factors like gender, age or environmental influences?
Medical Imaging 2006: Visualization, Image-Guided Procedures, and Display, edited by Kevin R. Cleary, Robert L. Galloway, Jr., Proc. of SPIE Vol. 6141, 61410B, (2006)
1605-7422/06/$15 · doi: 10.1117/12.653504 Proc. of SPIE Vol. 6141 61410B-1
Size and shape of anatomical structures and their variability have always played an important role in medical education and research. The analysis of anatomical shapes can improve the understanding of processes behind growth, ageing or diseases and support medical diagnosis and therapies. Knowledge about variability in anatomy has tradi-tionally been imparted in an enumerated way, as in collections of pictures or preparations. The integration of variability in an anatomical atlas is a complex and challenging problem not yet generally solved. So far, most progress has been achieved for population-based atlases of the brain3,4. Here a reference anatomy is elastically transformed onto individual anatomies. The deviations can then be described by deformation fields and represented e.g. by means of color-coded visualizations. However, such an approach seems to be less suitable for an atlas that e.g. represents the inner organs. Since not only the shape of organs but also their varying positions and orientations are reflected in the deformation fields, their interpretation is difficult. In this paper we present a new concept for the representation of geometric variability in a 3D anatomical atlas using an organ-based approach, i.e. describing anatomical objects by means of shape models. This way, a description and characterization of organs is possible independent of their position.
2. MATERIAL AND METHODS
2.1. The VOXEL-MAN atlas of the inner organs
The basis of this project is the VOXEL-MAN atlas of the inner organs5 that was developed at our institute. It has been created from the photographic cross-sections
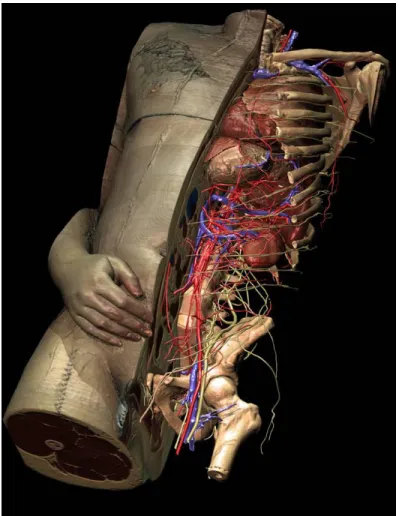
of the Visible Human Male2. It is a volume-based model of the human body – hence, not only the organs’ surfaces can be viewed but also their interior e.g. by placing cutting planes. The model is characterized by a high level of detail and contains more than 650 3D anatomical structures. The anatomical objects are textured with their original color. Using a special visualization technique the surfaces of the segmented objects are reconstructed with subvoxel resolution6. That way a nearly photo-realistic quality is achieved (fig. 1).
The spatial model is connected to a sym-bolic model which contains descriptive in-formation about the anatomical structures. Interrelations between objects are described with a semantic network7. Examples of re-lations are “part of”, “has a” or “supplied by”. Using the integrated knowledge base, organs can be addressed and visualized by their names. Furthermore, organ specific context information is represented in the knowledge base and can be viewed additionally.
A volume-based model allows a highly realistic representation of the anatomy, but it is not suitable for an efficient representation of anatomical variability based on larger populations. Therefore, we extended the VOXEL-MAN system by a shape descrip-tion that is connected to the volume model. A wide range of shape models is available that are suited for different kinds of
Figure 1: 3D model of the inner organs derived from the Visible Human data set. The representation exhibits a high degree of realism. Yet, the model does not contain any information about inter-individual variability of human anatomy.
.1.
b
A
1
r
applications. For modeling anatomical shapes and their variability we decided to use the “m-rep” description8,9 (“medial representations”) which allow a compact representation of anatomical objects on the basis of their skeletons.
2.2. Shape representation with m-rep models
The m-reps were introduced by Pizer10 for modeling and visualization of 3D objects and are mainly used in the field of medical image processing and analysis. An m-rep model is a sampled medial description of an object based on the medial axis of Blum11. The basic components of an m-rep model are the “medial figures” that have a single, non-branching medial surface and are represented as a mesh or chain of “medial atoms”. Simple objects can be described by a single figure like the kidney in figure 2, whereas more complex objects can be built as a collection of connected figures.
A medial atom is described by a parameter vector that contains the atom’s position x, the local width r (the radius of the inscribed sphere), the object angleθ and an orthonormal local frame parameterized by (b, b⊥, n) that describes the local orientation, where the vector n is normal to the medial manifold and b gives the direction in the tangent plane of the fastest narrowing of the object (fig. 3). The parameters contain local shape information of the object and can be interpreted intuitively. Local as well as global shape properties can be derived from m-rep-parameters, e.g. bending, widening or narrowing of an object.
A precondition for a comparative examination of shape variants is the establishment of an appropriate geometric correspondence between objects. An m-rep model possesses a figural coordinate system, on the basis of which the correspondence is defined. To each point on the m-rep surface or in the m-rep volume figural coordinates are assigned that describe its relative position to the medial mesh. Points on different shape variants with the same figural coordinates are considered as correspondent. However, correspondence can only be defined between m-rep models that have the same topology, i.e. the same number of medial figures and the same kind of medial mesh. For the representation of shape variability within a volume-based atlas we have chosen the m-reps because of the following reasons:
- They offer a compact and efficient description of shape.
- Geometric correspondence of shape variants can be established not only between surface points but also between volume points.
- The model parameters invoke an intuitive understanding of the local and global form as they quantify terms like bending, thickness or elongation.
Figure 3: Medial atom with a
cross-section of the boundary it implies (from Fletcher et al. 2003)12.
Figure 2: An m-rep model of a kidney and the implied boundary surface. The model is composed of a single medial figure with a mesh of 3 x 5 medial atoms.
I
2.3. Data basis and data preprocessing
For the development of the system we have used a population of 48 left kidneys that are based on CT data of the abdo-men. An m-rep model of the kidney with a single medial figure and 3 x 5 medial atoms (fig. 2) was adapted to each of the segmented kidneys (fig. 4).
This way for each shape variant we had an m-rep model with the same medial structure. The adaptation was carried out using the automatic optimization provided by the software “Pablo”, developed by the Medical Image and Display Group at the University of North Carolina. Based on the m-rep parameters we have calculated an average kidney that is shown in figure 5.
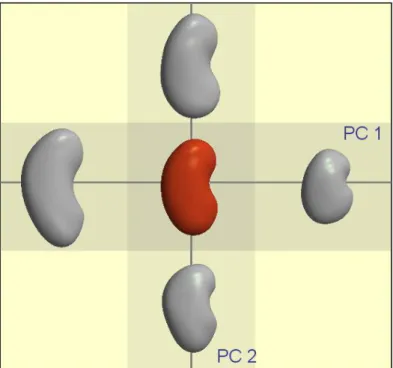
Principal component analysis (PCA) is a prevalent technique for describing model variability13. The statistical framework is well understood when the parameters of objects are elements of the Euclidean vector space. However, shapes that are represented by m-rep models operate in a figural space and are not elements of Euclidean space. Therefore the PCA has been extended by Fletcher et al.12,14 to principal geodesic analysis which is valid for m-rep parameters. Using this method we have calculated the first principal components of the population of 48 kidneys that are shown in figure 5.
2.4. Integration of shape variability into the VOXEL-MAN atlas
For the integration of a population of shape models into the VOXEL-MAN atlas it is first of all necessary to establish a geometric correspon-dence between the shape models and the corresponding organ in the volume-based model. For that, we fitted the average kidney model to the segmented left kidney of the Visible Human data by an optimization procedure using the Software Pablo. The received m-rep model of the Visible Human kidney serves as a reference model and
possesses the same medial structure as the other kidney models, so that a geometric correspondence between the m-reps can be defined.
For a surface visualization of an m-rep model the RGB values from the photographic Visible Human data set are used, giving the organs their natural colors. For a correct color mapping the geometric correspondence between the reference model and the m-rep model of interest is utilized.
To obtain a volume-based representation of a shape variant represented by an m-rep model a method was developed that allows the deformation of the volumetric model according to the m-rep coordinates. For each voxel belonging to the organ of interest a coordinate transformation is calculated: first from voxel to figural coordinates (using the reference
m-Figure 4: Boundary surface display of the m-rep models of the left kidneys (part of the population of the 48 kidneys).
Figure 5: The average kidney of the population (center) and the first two modes of deformation.
—
rep model of the organ), and then from figural (now using the m-rep model of the shape variant) back to voxel coordinates. The transformation developed enables the visualization of surface and internal structures in high quality.
3. RESULTS
With the integration of a shape description into the VOXEL-MAN atlas it is now possible to query and visualize different shape variations of an organ, e.g. by specifying a person’s age or gender. Also, it becomes possible to display
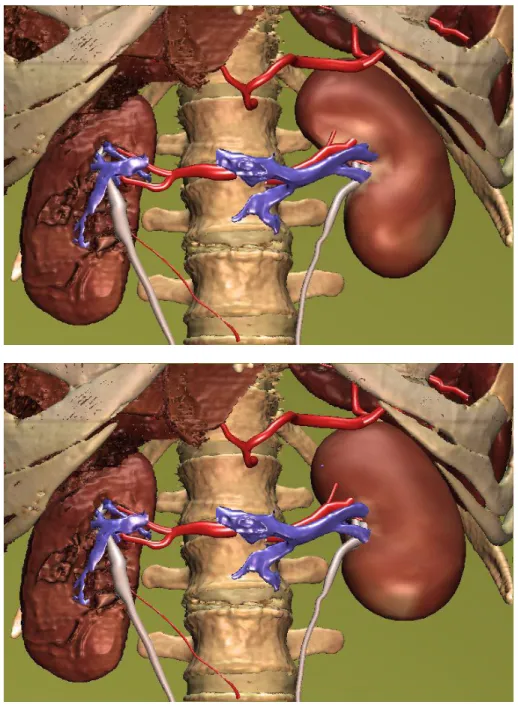
Figure 6: Visualization of shape variants of the kidney within the VOXEL-MAN atlas. The left kidneys (in the pictures on the right hand side) are surface representations on the basis of m-rep models. Top: left kidney of the Visible Human. Bottom: average shape of a population of 48 kidneys.
iii
the organs in a sorted sequence, whereby the individual organs can be arranged according to local shape parameters (e.g. width, bending, widening) or according to the patient’s age. In addition to the representation of individual shape variants, the average shape of a population can be displayed (see fig. 6).
The shape variants may be depicted as surface models which can be calculated rapidly from the m-rep models. In this way a quick overview can be gained about the shape variability of a population of organs. The surface models are visualized in the organs’ natural colors giving them a more realistic look (fig. 6). However, as the surface colors were derived from the Visible Human data set, they do not reflect the original colors of the individual shape variants.
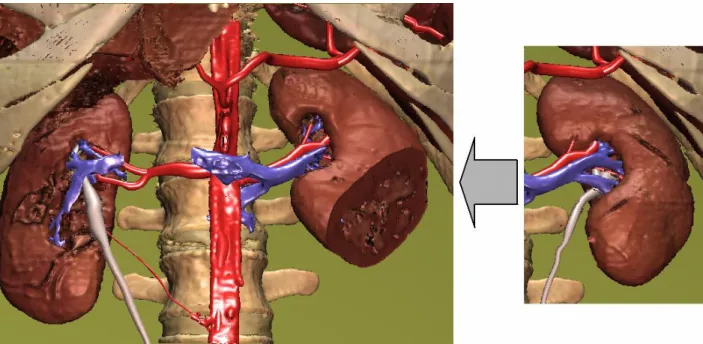
Besides a surface representation, a volume-based representation of the kidney’s shape variants is also possible. It results from the deformation of the reference kidney of the volume-based model according to the m-rep shape description. This way a realistic visualization of the shape variants is made possible, as well as the visualization of the organ’s internal structures, for example shown after the application of cutting operations (fig. 7). It should be obvious that the approach presented is not reasonable for pathological variants that show substantial morphological differences to a healthy kidney. However, all healthy and pathological structures and organs with similar shape can be represented in the atlas by this technique.
4. CONCLUSION
The inclusion of anatomical variability in a 3D atlas is a desirable yet challenging goal. We presented a new concept for the representation and visualization of the variability of anatomical structures using an organ based approach. For modeling anatomical organs and their variability organ specific m-rep models are generated which allow a compact re-presentation of anatomical objects on the basis of their skeletons. With the connection of a volume based atlas and the m-rep shape description the advantages of both methods are combined. The volume based model allows a realistic re-presentation of anatomical structures and the m-reps permit a compact description of shape variability.
As an example a statistical shape model of the kidney based on 48 different variants was presented. With the integration of the shape description into the VOXEL-MAN atlas it is possible to query and visualize different shape Figure 7: Volume based representation of shape variants of the left kidney in the VOXEL-MAN atlas. Right: Reference kidney from the original volume model. Left: Shape variant of the kidney based on an m-rep description (The cut-away gives a view of the interior of the kidney).
variations of an organ. In addition to the representation of individual shape variants of the kidney, the average kidney shape can be computed as well as the first principal components of the population showing typical shape variations.
One of our next steps is the extraction of suitable shape parameters from the m-rep models which allow a characterization and a classification of various shape variants. These parameters as well as information about the patient’s age and gender will be integrated into the VOXEL-MAN knowledge base in form of a semantic network. Furthermore, dynamic processes in the human body like respiratory motion of lungs and inner organs as well as the beating of the heart will be modeled by m-reps to visualize the dynamic shape variations of organs in the atlas environment. Using the techniques presented, motion behavior of a patient’s lung or heart is transferred to the reference organ in the atlas. Hence, the user can get a realistic impression of the respiratory motion of inner organs or the shape variations of a beating heart.
ACKNOWLEDGMENTS
We thank Stephen Pizer and the image processing group (MIDAG) of UNC in Chapel Hill for the provision of the software “Pablo” and the support in all problems and questions regarding the m-reps. We are also grateful to the members of the radiation oncology at UNC for providing the kidney data. We thank Karl-Heinz Höhne for the possibility to extend the VOXEL-MAN atlas in this project. This project is being supported by the German Research Council (DFG).
REFERENCES
1. Ackermann M J. The Visible Human Project: a resource for anatomical visualization. Medinfo 1998; 9, 2: 1030-2. 2. Spitzer V, Ackermann M, Scherzinger A, Withlock D. The Visible Human Male: A Technical Report. J Am Med
Inform Assoc 1996; 3, 2: 118-30.
3. Mazziotta JC. A probabilistic atlas and reference system for the human brain. In: Toga RW, Mazziotta JC: Brain Mapping – The Methods. Academic Press, San Diego: 727-755, 2002.
4. Toga A W, Thompson P M. Multimodal brain atlases. In S. Wong (ed.): Advances in Biomedical Image Databases. Academic Press, New York, 1999.
5. Höhne K H, Pflesser B, Pommert A, Riemer M, Schubert R, Schiemann T, Tiede U, Schumacher U. A Realistic Model of Human Structure from the Visible Human Data. Method Inform Med. 40; 2001: 83-89.
6. Tiede U, Schiemann T, Höhne K H. High quality rendering of attributed volume data. In Ebert D, Hagen H, Rushmeier H (eds.): Proc. IEEE Visualization 1998. Research Triangle Park, NC, 1998: 255-262.
7. Pommert A, Schubert R, Riemer M, Schiemann T, Höhne K H. Symbolic modeling of human anatomy for visualization and simulation. In: Robb R A (ed.): Visualization in Biomedical Computing 1994. Proc. SPIE 2359. Rochester, MN; 1994: 412-423.
8. Joshi S, Pizer S M, Fletcher P T, Yushkevich P, Thall A, Marron J S. Multiscale deformable model segmentation and statistical shape analysis using medial descriptions. IEEE Trans Med Imaging, vol. 21; 2002: 538-50. 9. Pizer S M, Fletcher P T, Joshi S C, Stough J, Thall A, Chen J Z, Fridman Y, Fritsch D S, Gash G, Glotzer J M,
Jiroutek M R, Lu C, Muller K E, Tracton G, Yushkevich P A, Chaney E L. Deformable M-reps for 3D Medical Image Segmentation. IJVC, vol. 55, 2003.
10. Pizer S M, Thall A, Chen D. M-reps: A new object representation for graphics. Tech. Rep. TR99-030, University of North Carolina, Chapel Hill, NC, 1999.
11. Blum T O. A transformation for extracting new descriptors of shape. In Wathen-Dunn (ed.): Models for the Perception of Speech and Visual Form. MIT Press. Cambridge, MA, 362-380.
12. Fletcher P T, Lu C, Joshi S. Statistics of Shape via Principal Component Analysis on Lie Groups. CVPR, 2003. 13. Jollife I T. Principal Component Analysis. Springer-Verlag, 1986.
14. Fletcher P T, Joshi S, Lu C Pizer S M. Gaussian Distribution on Lie Groups and their application to Statistical Shape Analysis. IPMI, 2003.