IdEP Econom ic Papers
2016 / 02
S. Galletta, A. Redonda
Corporate flat tax reforms and businesses’ location
choices. Evidence from Switzerland.
Corporate Flat Tax Reforms and Businesses’ Location
Choices. Evidence from Switzerland
∗Sergio Galletta† University of Lugano
Agustin Redonda‡ Council on Economic Policies January 29, 2016
Abstract
Profit taxation affects corporate investment decisions through several channels. This paper focuses on the impact of corporate income flat tax reforms on businesses’ location choices. Since 1990, Swiss states (cantons) have been switching from a gradu-ated to a flat tax rate scheme on profits. The paper assesses the effects of such a reform on the number of establishments by computing a difference-in-differences estimation. Our results show a negative impact on the number of firms in a given jurisdiction. Interestingly, the effect is considerably larger for riskier firms, suggesting the presence of an insurance effect from progressive taxation for risk-averse entrepreneurs.
Keywords: Corporate taxes, Business location, Flat-tax, Tax reform, Progressive taxation
JEL classification: H25, H32, H71, R3
∗
We are grateful to Johannes Abeler, Marius Brülhart, Sascha O. Becker, Katherine Cuff, Michael Devereux, Mario Jametti, Marcelin Joanis, Michael Keen and Patrick Lenain for valuable comments and suggestions as well as conference and workshop participants at CBT (Oxford), IIPF (Lugano) and SMYE (Vienna). We would also like to thank Raphaël Parchet for very helpful comments and the provision of useful data. Finally, we acknowledge financial support from the Swiss National Science Foundation (Sinergia Project grants No. 130648 and 147668, and grants Early Postdoc.Mobility No. 15860).
†
Institute of Economics (IdEP), University of Lugano, Via G. Buffi 6, 6904 Lugano, Switzerland; e-mail:
sergio.galletta@usi.ch. ‡
Council on Economic Policies (CEP), Seefeldstrasse 60, 8008 Zürich, Switzerland; e-mail:
1
Introduction
The effect of fiscal policies on investment decisions has been deeply studied in several sub-fields of economics such as industrial organization, economic geography and public economics.1 One of the most important investment decisions for an entrepreneur is where to locate her business and, in this context, fiscal policy is crucial for businesses choosing where to settle. Indeed, whereas the effective marginal tax rate (EMTR) affects the overall level of investment, firms’ location decision are influenced by the effective average tax rate (EATR) (Devereux and Griffith, 2003).2
Interestingly though, there are several channels through which the impact of fiscal policy can make a given jurisdiction more or less attractive for a firm. Taxation is probably the most important one. The most relevant taxes regarding such a decision are the ones levied on profits. Traditional tax competition models suggest that mobile firms should locate where corporate tax rates are the lowest because of the so-called level effect of corporate taxation.3 Nevertheless, this race to the bottom is mitigated by several factors such as the provision of public goods or agglomeration forces.4
This paper goes beyond the level effect to tackle the impact of a particular feature of the tax scheme on businesses’ location choices. The focus is on whether the corporate tax is implemented through a flat tax rate (FTR) scheme or a graduated tax rate (GTR) system. This is an issue with important policy implications and, hence, it has long been the subject of contentious political and public debates.5 Strikingly though, as mentioned
1
See, for example, Modigliani and Miller (1963), Miller (1977) and Cummins et al. (1996).
2"Conditional on the choice of location, the size of investment depends on the EMTR. But the choice
of location depends on the level of post-tax net present value (NPV); for a given pre-tax NPV in each location, the impact of taxation on the location choice is through its effect on the post-tax NPV. This can be measured by an "effective average tax rate..." (Devereux and Griffith (2003) p.108).
3
A comprehensive review of this literature is provided by Wilson (1999). For more recent references see, for example, Barrios et al. (2012) and Devereux and Griffith (1998).
4
Becker et al. (2012) find that the average German municipality needs to reduce its business tax rate by 20% to attract one foreign multinational firm. Hence, they conclude that the "pure" tax-competition game to attract multinational firms is only interesting for a few German municipalities. For the rest, there might be other factors such as the provision of public goods playing a significant role. Brülhart et al. (2012) show that agglomeration forces attenuate the impact of tax differentials on firms’ location choices.
5For instance, the Tax Reform Act of1986was approved in the United States after an intense debate. As
mentioned by the former Reagan’s White House adviser, B. Bartlett, the Tax Reform Act of1986was
prob-ably approved because "...was really a coming together of the liberal idea of getting rid of tax loopholes with the conservative idea of flattening the tax rates...and so each side felt that they had something to gain by the
effort." (www.npr.org/2011/10/17/141407285/times-have-changed-since-reagans-1986-tax-reform).
For more details on the Tax Reform Act of1986see, for example, Feldstein (1995) and Auerbach and
Slem-rod (1997). More recently, the intSlem-roduction of a flat tax has been a central component of the debate behind next US presidential elections. As stated in a recent blog by Kyle Pomerleau, director of Federal Projects at the Tax Foundation, "Several Republican presidential hopefuls have stated their support of the "Flat Tax." Ted Cruz, Ben Carson, and Rand Paul have all expressed interest in a tax reform plan that moves
by Keen et al. (2008), the strengths and weaknesses of FTR and GTR systems have been approached in a descriptive way, without giving neither scientific theoretical support nor conclusive empirical evidence of their effects.
We aim at filling the existing gap between rhetoric argumentation and empirical ev-idence by implementing a difference-in-differences approach to estimate the impact of switching from a GTR to a FTR (i.e. applying a flat tax reform on corporate taxes) on the number of establishments in Swiss states (cantons).6 Our identification strategy is based on the different timing in the implementation of the reform by switcher cantons. Since canton Jura switched from a GTR scheme to a FTR system in 1990, other cantons have been progressively applying such a reform on corporate taxes. By the end of 2014,17
out of26cantons had introduced a flat tax reform to their corporate income tax schedules. As it is often the case when computing a difference-in-differences estimation, one should be concerned about the validity of the common trend assumption as well as about self-selection. If the decision of cantonal governments to apply the reform is not orthogonal to observable and unobservable factors that also affect firms’ location choices, our results would be biased and, hence, their causal interpretation would not be valid. Throughout the paper, we tackle potential endogeneity issues in several ways and, therefore, we are confident about the causal relationship between the introduction of a flat tax reform on profits and the location decisions of businesses in Switzerland. Moreover, our data allow us to control for potential confounding factors and to apply a number of fixed effects.
In principle, a flat tax reform could have either a positive or negative effect on the number of enterprises in a given jurisdiction. On the one hand, a FTR scheme might create incentives for the creation of new activities because of the simplification of the tax code (Hall and Rabushka, 1984). Alternatively, a negative impact could arise through the so-called insurance effect, which is defined as follows: "Keeping the expected after-tax profits constant, progressive taxation reduces the variance of profits by more than linear taxation. As a consequence, tax progressivity serves as an insurance device: in bad times, an entrepreneur has to pay less than under a flat tax, whereas in good times the tax bill is higher." (Bacher and Brülhart (2013) p. 134). In other words, the insurance effect implies that a reduction in the level of progressivity has a negative impact on the stock of businesses. This said, a FTR does not necessarily reduce the progressivity level of the tax schedule with respect to the GTR that was in place. Theoretically, a flat tax reform can lead to a more/less progressive schedule depending on how the new flat tax rate compares
our current code to a new "Flat Tax." As a result, there is renewed interest in what a Flat Tax is, what its pros and cons are, and how it could impact different taxpayers." (http://taxfoundation.org/blog/what-are-flat-taxes).
6Throughout the paper, we consider, indistinctly, the number of firms, businesses or establishments.
This is due to particular features of the Swiss fiscal system that makes the latter to be the relevant unit of analysis (More details are given in Section 4).
to the previous graduated tax rates and on how the stated deductions were modified. Hence, the overall impact of a flat tax reform on firms’ location decisions is rather an empirical matter.
Our results suggest that the introduction of a flat tax reform has a (relatively small in magnitude) negative and statistically significant effect on the stock of establishments in a given jurisdiction. On average, firms tend to prefer to locate their activities in cantons where a corporate GTR schedule is applied.
After double-checking the cantonal laws to verify that, indeed, the reforms applied by Swiss cantons generated a reduction in the progressivity levels of the cantonal tax schemes, we compute a set of alternative estimations of our model to identify the mechanism behind our findings.
These specifications indicate that the reform has a larger impact on riskier firms that we proxy with smaller firms and firms developing their activities in riskier sectors. Our interpretation of these results goes through the insurance effect, which arises because risk averse entrepreneurs prefer tax schemes with higher levels of progressivity as this acts as an insurance device.
The contribution of this paper is two-fold. First, it focuses on corporate income flat tax reforms. Although flat tax reforms have been deeply studied, previous literature as-sesses the impact of flat tax reforms on personal income taxes. Strikingly though, flat tax reforms on profits have been largely neglected.7 This lack of conclusive empirical evidence concerning the potential effects of flattening corporate taxes is reflected in the heterogene-ity among the countries applying either GTR or FTR schemes. For instance; Japan, the United States and the United Kingdom raise graduate rate corporate income taxes. On the other hand, Canada, France, Germany, Italy, Spain and Switzerland apply propor-tional taxes on profits. Interestingly, when considering different tiers of government in a federation, both systems might coexist. Apart from Switzerland (of which fiscal system is described in Section 3), this is the case in the United States. In the US, 31 states levy flat-rate corporate income taxes and17 apply a GTR scheme (the remaining three states do not tax profits).
Second, when it comes to assessing the impact of a flat tax reform (either on personal or corporate income), the complexity of these reforms makes the data collection process and the definition of an identification strategy particularly difficult. Indeed, empirical papers assessing the effects of flat tax reforms are scarce. Whereas most of the existing papers use simulation techniques in order to model the effects of (personal income) flat tax reforms, we apply an empirical approach based on a neat and straightforward identification strategy.
7
We believe that this is a considerable advantage compared to previous studies in the field.8 There are two papers that are worth highlighting. In Gorodnichenko et al. (2009) the authors assess Russia’s flat tax reform on personal income using micro-data. They find that the reform decreased the levels of tax evasion and, to a smaller extent, had a positive productivity effect on the real side of the economy. This is an empirical study but, unlike our paper, the focus is entirely on personal income taxes. Bacher and Brülhart (2013) explores the implications of changes in the average tax burden, the progressivity of the tax schedule, and the complexity of the Swiss cantonal tax codes for entrepreneurial activity. The final objective (i.e. estimating the impact of the corporate income tax system on firms’ location decisions) is indeed very close to ours. Nevertheless, their focus is not on flat tax reforms. The authors rather exploit the cross-sectional variation of their data to empirically estimate the impact of corporate taxation on entrepreneurial activity through these three channels.
The rest of the paper is structured as follows. In Section 2 we discuss the links between both schemes (FTR and GTR) and progressivity. Moreover, we provide further details on the insurance effect. Indeed, this section provides both the theoretical background as well as the economic intuition behind our analysis. Section 3 presents a brief description of the fiscal context in Switzerland highlighting the features that make the Swiss Federation an almost ideal setting to develop our study. In Section 4 we describe the data set. Section 5 discusses the empirical framework and main estimation issues. In Section 6 we present and discuss our results and, finally, in Section 7 we provide some concluding remarks.
2
FTR vs GTR systems
This paper assesses how businesses’ location choices are affected by a specific reform on the tax schedule: a flat tax reform on corporate income. As it is described by Keen et al. (2008), the term "flat tax" was originally associated with Hall and Rabushka (1984) and Hall and Rabushka (1987).9 Strictly speaking, "only a flat rate tax without any tax relief is a "pure" flat tax as in this case the share of tax payments to income is constant for the whole income range." (Paulus and Peichl (2009) p.622). Nevertheless, the flat tax concept has evolved from this precisely defined structure to a vaguer definition and, in reality, flat tax reforms can actually differ from case to case. Most flat tax reforms include both the
8
Cassou and Lansing (2004) and Paulus and Peichl (2009) are some examples of studies based on simulation techniques.
9The flat tax à la Hall and Rabushka is a consumption-type, origin-based value-added tax (VAT)
supplemented by a (nonrefundable) tax credit against labor income. In other words, "their proposal is for a very precisely defined and coherent tax structure: a combination of a cash-flow tax on business income and a tax on workers’ income, both levied at the same, single rate (with a personal allowance available
flattening of personal and corporate income taxes. Some of them also introduce changes in capital taxes and, in the most extreme cases (such as Slovakia’s reform of 2004), even modifications on VAT structure.10
There are several arguments in favor of (and against) both tax systems. Flat-tax pro-ponents’ main argument regards its simplicity. Tax codes are often too complex. This hinders the business environment by increasing compliance costs and creating to inefficient loopholes and preferences in the tax code that are potential triggers of rent seeking. The simplicity of flat taxes is usually put on the table during political debates but its relevance is controversial for several reasons. First, for some sectors such as accounting and legal ser-vices, the variation in the complexity of the tax code should make no difference. Moreover, for the rest of the sectors, its impact is likely to be relevant only for small and medium sized enterprises (SMEs), where the owner-manager may deal with taxation issues by herself. Unlike SMEs, bigger firms (particularly multinational enterprises) are likely to have either an internal accounting department or an external accounting firm managing these tasks. For them, the impact of the simplicity effect is likely to be significantly less important than for SMEs, if relevant at all. Finally, and more importantly for our study, even assuming that the simplicity effect has a significant impact on firms’ location choices, this channel would only arise if the flat tax reform included a reduction in the complexity of the tax code (i.e. in the definitions of the tax base through exceptions, deductions or tax credits) rather than a simple reduction in the number of tax brackets. Slemrod and Bakija (2008) put it like this: "a graduate tax-rate structure does not by itself directly contribute any significant complexity to the taxpaying process. Once taxable income is computed, looking up tax liability in the tax tables is a trivial operation that is not perceptibly simplified by having fewer brackets."11
Those in favor of a GTR system instead, argue that such a schedule helps maximizing the tax revenue from each income group and has an important re-distributional impact.12 A crucial feature for their argumentation is the assumption that a flat tax reform necessarily reduces the progressivity level of the tax system. For instance, Dunbar and Pogue (1998) estimate the distributional effects of replacing the existing federal income tax scheme in the US with a flat tax. Using simulation modelling, the authors find a robust decrease of pro-gressivity.13 Interestingly, if this assumption held, on top of the potential re-distributional effects, risk averse entrepreneurs would be better off under a GTR scheme than under
10For more details on Slovakia’s flat tax reform see, for example, Brook and Leibfritz (2005) and Moore
(2005). 11
Slemrod and Bakija (2008), p.166. 12
See Diamond and Saez (2011). 13
In Section 1, we briefly mention that this is not necessarily the case. Indeed, under certain conditions, a FTR can leave the progressivity level of the tax system unchanged or even increase it. For a formal discussion on this issue, see Appendix B.
a FTR system because of the insurance effect. Let us recall the definition of the insur-ance effect given by Bacher and Brülhart (2013): "Keeping the expected after-tax profits constant, progressive taxation reduces the variance of profits by more than linear taxa-tion. As a consequence, tax progressivity serves as an insurance device: in bad times, an entrepreneur has to pay less than under a flat tax, whereas in good times the tax bill is higher." (Bacher and Brülhart (2013) p., 134).14 The mechanism through which this effect impacts corporate location decisions is not straightforward. Let us thus clarify the intuition behind the insurance effect through a simple numerical application of the model presented in Bacher and Brülhart (2013).
We start by assuming a risk averse firm that, with equal probability, could make either a50,000$ profit (bad outcome) or a150,000$ profit (good outcome) in timet+1. Further, let us assume that in timet, the entrepreneur chooses to settle her firm either in jurisdiction
iorj, which only differ in their tax schedules. The former applies a proportional or flat tax rate schedule while the latter applies a GTR one. Indeed, while jurisdictioniimplements a
20%flat tax rate, jurisdictionj applies a progressive tax schedule with two tax brackets: a
12%tax rate that applies to profits up to 50,000$ and a28%tax rate rate that applies to profits above that threshold. Thus, firms located in municipalityiwould make an after-tax profit of40,000 $ under the bad scenario or a120,000$ under the good one. Therefore, the expected tax payments would equal 20,000 $ and the expected net profit would be
80,000$. Similarly, for firms located in jurisdictionj, the after-tax profit would be44,000
$ under thebad scenario and116,000$ under the good one. Note that for the latter, both the expected tax payments and net profits are the same as those for firms in jurisdictioni
i.e. 20,000$ and80,000$, respectively. However, the expected profit variability decreases for firms settled in jurisdiction j. Therefore, given the risk aversion assumption, firms will prefer to locate in jurisdiction j where a progressive tax schedule is applied because the aforementionedinsurance effect reduces the uncertainty on future profits’ realizations. Hence, one would expect that the introduction of a FTR schedule has a negative impact on the attractiveness of a given jurisdiction for businesses.
3
The fiscal context in Switzerland
3.1 The tax system
The Swiss Federation has a unique fiscal system that provides an ideal context for our study.15 In particular, Switzerland is a highly decentralized country composed of three
14
Other papers discussing the insurance effect are Cullen and Gordon (2006) and Cullen and Gordon (2007).
15In this section we only describe the characteristics of the Swiss fiscal system that are relevant for
tiers of government: federal, cantonal and municipal ones. The lower tiers of government (cantons and municipalities) have important degrees of freedom concerning their fiscal competencies. Cantons are free to tax personal income and wealth as well as corporate profits and capital. Similarly, municipal governments have important autonomy in levying taxes on either of these items.
Whereas, around 80% of the total tax revenue raised on corporate income and capital is roughly equally divided among the federal government and cantons, municipalities collects less than 20% of the total. Moreover, while the federal government collects the main part of its tax revenue from indirect taxes such as the VAT and specific consumption taxes (e.g. the mineral oil tax), cantons and municipalities strongly depend on tax revenues coming from personal and corporate income and wealth taxes. In both cases, personal income tax accounts for the biggest portion of total tax revenue (61% for cantons and 68% for municipalities) whereas taxes on profits and capital represent18%(16%) and wealth taxes only8% (9%) of cantonal (municipal) tax revenue.
In Switzerland, corporate income tax rates are jointly determined by the federal govern-ment, cantons and municipalities. In 1998the federal government reformed its corporate tax schedule by introducing several modifications. For instance, since then, capital is not taxed at the federal level and corporate taxes shifted from a progressive to a FTR scheme. The federal government currently taxes profits at a flat tax rate of8.5%. Indeed, although the federal government also determines the corporate income tax rate, throughout the paper we only consider the lower tiers of government because the 8.5% federal flat tax rate scales up the effective tax rate in all cantons. Hence, the setting process of corporate taxes can be resumed as follows: In a first stage, each canton sets a tax schedule where, for example, a basic statutory tax rate and the level of deductions are defined. This tax sched-ule can only be changed by modifying the cantonal tax law. Then, every year, cantonal parliaments set a cantonal multiplier to be applied to the statutory tax rate and munici-palities (that take the cantonal tax schedule as given) do the same by setting a municipal tax multiplier on an annual basis.16 In other words, unlike corporate tax rates, the main characteristics of the corporate tax system such as its structure (i.e. the number of tax brackets to be applied) and the level of deductions are uniquely determined at the cantonal level. Hence, local jurisdictions do influence corporate tax rates but cannot determine the progressivity of the tax schedule. This is a key feature for our identification strategy.
A final feature that is crucial for the identification of our estimates concerns group consolidation. In the U.S., for instance, corporate tax consolidation among the different
(2003) and Parchet (2014). Moreover, this section describes the general tax setting process representing the majority of cantons and municipalities in Switzerland. Particular cases and exceptions are taken into account when working with the data.
16
There are cases in which other institutions such as parishes set their own tax multipliers applying a similar methodology.
establishments or firms belonging to a a same group is done through an apportionment formula. Instead, Switzerland has no special rules for group consolidation. Indeed, the Federation has no transfer pricing legislation and, thus, relies on the OECD’s arm’s length principle. This is a valuation principle that is commonly applied to commercial and finan-cial transactions between related companies and states that transactions should be valued as if they had been carried out between unrelated parties, each acting in his own best interest.
3.2 The flat tax reforms applied by Swiss cantons
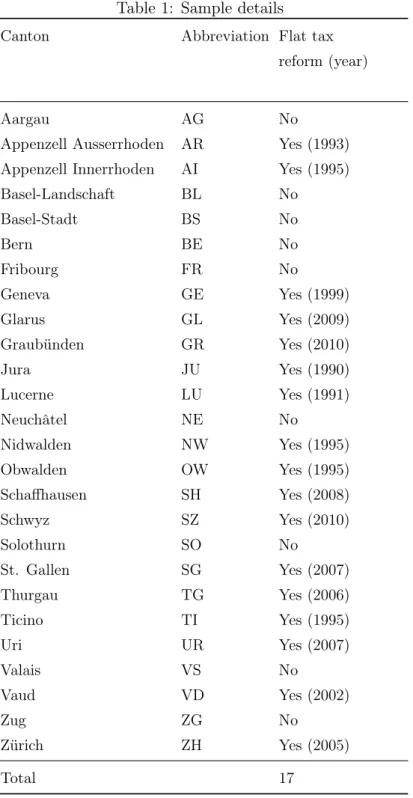
To estimate our model, we take advantage of the increasing number of cantons that have been introducing proportional corporate income tax systems. In1990, a large fiscal reform was approved by the Federal Parliament. This reform included a reduction in the number of tax brackets from 3 to 1. The reform was nonetheless rejected in1991by a referendum. Indeed, as mentioned before, it was only in1998 that the Federal government effectively introduced a flat tax on corporate income. Nevertheless, this first attempt to flatten corporate taxes by the federal government could have triggered the cantonal reforms that have progressively been introduced since then. Jura was the first canton to switch from a GTR to a FTR in 1990. Other cantons have followed since then and, indeed, as we can observe from Table 1, the number of cantons applying FTR schemes rose from 0 up to
14 during our sample period and, interestingly, no canton had switched from a flat to a progressive tax schedule.17
In Table 2 we describe the most relevant features of the reforms considered in this paper. There are two main characteristics that we are interested in, the simplicity and progressivity levels. In other words, we want to asses whether the implemented flat tax reforms resulted in simpler and less progressive schedules than the GTR schemes that were in place, as expected.
Let us start by the simplicity. In Section 2 we have describe the debate behind the actual impact of the simplicity of the tax scheme on businesses’ activity. Even taking for granted that the simplicity effect could have an effect on firms’ location decisions, this impact would only be relevant if a considerable simplification of the tax code rather than a simple reduction in the number of tax brackets was introduced.
All the reforms applied by Swiss cantons implied the introduction of a single corporate income tax rate. Interestingly for us though, the rest of the tax code was only slightly modified. A few marginal modifications regarding the definition of the tax base were introduced. Nevertheless, as we can observe in Table 2, these modifications almost uniquely included changes in the periods, rates and/or amounts applied to a given deduction rather
17
Note that three cantons (Glarus, Graubünden and Schwyz) had switched as well but are not included in our sample because they introduced the reform after 2008.
than a reduction in the number of deductions or even a simplification in the way in which the tax base is defined. Hence, we are confident about the relatively low impact of the simplicity effect on our estimates.
Coming back to the second feature we are interested in, the progressivity level of the tax scheme, we follow the theoretical framework defined by Davies and Hoy (2002). The authors assess the inequality of after-tax distribution of (personal) income and prove the existence of critical flat tax rates such that inequality is higher, the same or lower than with the previous GTR scheme. As suggested by them, one could expect to determine whether the introduction of a FTR increased (decreased) the level of progressivity with respect to the previous GTR based on two parameters, the marginal tax rate and the level of allowances or deductions.18
Unfortunately, estimating these parameters may be a hard task, if feasible at all. Paulus and Peichl (2009) put it like this: "...these theoretical regularities are only approxima-tions for empirical estimation because existing tax systems are further complicated by the presence of other tax deductions and allowances. Some systems do not even have a (well-ddefined) basic allowance to start with." (Paulus and Peichl (2009) p. 623). Hence, we are not able to directly classify the reforms implemented by Swiss cantons as being more or less progressive than the GTR schemes they replaced by following this framework. Nevertheless, let us use their setting to identify some features of the implemented reforms that will allow us to do this indirectly.
1. To the extent that the flattening in tax rates is accompanied by a scaling up of the deductions, the reform is more likely to increase progressivity. The framework devel-oped by Davies and Hoy (2002) refers to two parameters of interest, the marginal tax rate and the allowances that are the tax-free threshold stated by the personal income tax scheme. When it comes to the latter, assessing the direction of the impact of the reform is straightforward. One should only verify whether the allowance increased or decreased with respect to to the pre-reform tax-free threshold. In order to adapt their setting to the Swiss corporate tax system, one should assess whether the level of deductions increased or decreased after the reform was implemented. Neverthe-less, this is not as straightforward as for a flat tax reform on personal income. The corporate tax scheme allows for several deductions with no less than 6 items (com-mercial deductions, real estate maintenance, discounts and rebates, taxes (related to the other tiers of government), losses and public utility donations) that, at the same time, contain several sub-items.
In other words, when it comes to the deductions, the flat tax reform could have in-creased the progressivity level of the corporate tax system if it considerably scaled up
the deductions i.e. if new deductions were introduced and/or the eligibility conditions for existing deductions were softened.
As shown in Table 2, this is clearly not the case i Switzerland, where most of the cantons either did not modify the existing deductions or implemented minor changes to the deductions that were already in place. For instance, whereas the cantons of Geneva, Nidwalden and Zürich did not introduce any modification in the deduc-tions from corporate income taxes, Appenzell Innerrhoden eliminated deducdeduc-tions on housing maintenance and renovation and introduced a 10% cap on deductions from charitable donations. For this four cantons, it is clear that the deductions were not modified in order to increase the after-reform level of progressivity. Five other cantons (Luzern, Obwalden, St. Gallen, Thurgau and Uri) introduced minor modifications to one single item among the set of deductions i.e. charitable donations. The remaining four cantons (Jura, Schaffhausen, Ticino and Vaud) modified two items out of the whole set of deductions.19 The only canton that considerably changed the deduc-tions on corporate taxes is Appenzell Ausserrhoden. Indeed, cantonal authorities introduced modifications to all the six items previously listed.
To put it differently, we are confident that the information provided by Table 2 shows that the modifications introduced by Swiss cantons to the deductions on corporate taxes were marginal with respect to the complex set of available deductions. This evidence supports that in our sample, i) the simplicity effect is not relevant and, that ii) the modifications to the level of deductions were not important enough to impact the progressivity level of the whole tax scheme. Therefore, coming back to the framework developed by Davies and Hoy (2002), in order to assess the impact of the reform on progressivity, one should take a look at the remaining relevant parameter i.e. the marginal tax rate.
2. All else (including revenue) equal, adopting a flat tax is more likely to be progressive the higher is the single marginal rate it applies. In most of Swiss cantons the flat tax reform included a reduction of the marginal tax rate for the highest incomes, with cantons Schaffhausen and Uri setting the post-reform flat-tax rate at a level even lower than the minimum of the pre-reform brackets. Once again, the only exception is Appenzell Ausserrhoden that set the post-reform tax rate at a higher level than the highest of the pre-reform bounds.20
19Vaud introduced deductions on research and development entrusted to third parties (up to 10% of
taxable profit and with a cap of 1 million CHF) that did not exist before the reform but, at the same time, scaled back the deductions on charitable donations by introducing a 10% of net profits cap.
20
As a robustness check, we estimated our model without including Appenzell Ausserrhoden. This is the only canton for which there could be concerns regarding the reduction of post-reform progressivity with respect to both parameters of interest i.e. the deductions and the marginal tax rate. Our results are
To sum up, the characteristics of the reforms applied in Switzerland suggest that the FTR schemes introduced by switcher cantons i) did not significantly reduced the complexity of the tax codes and ii) reduced the progressivity level of the corporate tax schedules.
4
Data and descriptives
To estimate our model, we assemble a panel data set with information coming from different sources. First, the multi-annual Business Census (BC) carried out by the Federal Statistical Office that is the only exhaustive census to collect data on all private and public businesses and workplaces in Switzerland. The BC records establishments (of which there can be several per firm) and attributes them to a NACE sector according to their self-declared principal activity and gives information on the location and the employment level of all Swiss firms. As mentioned in Section 3, Switzerland has no specific legislation on group consolidation and follows the OECD’s arm’s length principle regarding transfer pricing. Hence, both commercial and financial transactions between related companies should be valued as if they had been carried out between unrelated parties, each acting in his own best interest. In concrete, establishments should react independently to corporate taxes, no matter whether they are part of a group or not. The BC had been conducted three times per decade (i.e. in years ending with 1, 5 and 8) and took place for the last time in2008.21 Therefore, we avail ourselves of data for7 years (1985,1991, 1995,1998,2001,
2005and 2008) over a23-years period. Second, we identify the presence of either a GTR or a FTR scheme looking at each cantonal tax law for the period 1985 to 2008. Moreover, we complement our cantonal data with information on corporate and personal income tax levels from the Swiss Federal Tax Administration (SFTA). Specifically, the corporate tax rates were directly taken from the SFTA’s annual publication for capital cities, which provides information on the cantonal average tax burden. We follow Feld and Kirchgässner (2003) by using the tax burden of a representative firm with2,000,000CHF of capital and a8%rate of return on capital to compute the cantonal tax rates on profits. Finally, we also control for socio-economic characteristics using data from the decennial Swiss census.22
Table 3 provides summary statistics for all the variables. Our main dependent variable is the totalnumber of firms and ranges from a minimum of774in the canton of Appenzell Innerrhoden to a maximum of more than70,000in the canton of Zürich. We also consider alternative dependent variables to test for heterogeneities in the impact of the reform that might by useful to identify the relevant channels behind our findings. Specifically, we compute the number of firms with one employee, the number of firms with more than 2
robust and are available upon request. 21
The Business Census was conducted until2008when it was substituted by STATENT.
22
We are thankful to Raphaël Parchet for having provided an important part of the information and data used to assemble this data set.
and less than 9 employees and the number of firms with more than 9 employees, which are indicators of firm size. Finally, we compute the number of low risk firms, number of medium risk firms and number of high risk firms. The three latter variables account for the number of firms in sectors that are respectively in the first, second and third tertiles of the distribution of an index of riskiness based on the variance of profits for each sector. Riskier sectors being those with a higher variance of profits.23
Our main explanatory variable, flat tax, is a dummy variable that equals 1 whenever a certain canton applies a flat tax schedule on corporate taxes and 0 otherwise. As it can be observed from Table 1, our cantonal sample includes14 switcher cantons: Appen-zell Ausserrhoden, AppenAppen-zell Innerrhoden, Geneva, Jura, Lucerne, Nidwalden, Obwalden, Schaffhausen, St. Gallen, Thurgau, Ticino, Uri, Vaud and Zürich, and 12 cantons that have always applied a GTR scheme: Aargau, Bern, Basel-Landschaft, Basel-Stadt, Bern, Fribourg, Glarus, Graubünden, Neuchâtel, Schwyz, Solothurn, Valais and Zug.
Moreover, whereas time invariant heterogeneities are captured by fixed effects, we in-clude a set of control variables aiming at controlling for time variant cantonal-level hetero-geneities. For instance,corporate tax rate,personal income tax rate andpopulation, which are based on annual data. We also control for demographic characteristics such as % in-active and unemployed, % young (≤15),% old (≥65),% foreigners, % German speaking population and % protestant population that are taken from the decennial Swiss census. Finally,% left votes in national ballots accounts for the votes received by the socialist and other left-wing parties in the previous national election.
5
Empirical framework
5.1 Empirical model
Our goal is to estimate the effect of switching from a GTR to a FTR scheme on the number of firms in a given canton. We use a panel-based difference-in-differences approach. This method accounts for time-invariant unobserved heterogeneity because it compares the change in the outcome in the treatment group (switcher cantons) before and after the implementation of the reform to the change in the outcome in the control group (non-switcher cantons). By comparing changes, we control for observed and unobserved time-invariant characteristics that might be correlated both with the decision of switching to a FTR system and with the location choices of businesses.
In other words, we exploit the different timing in the implementation of the reforms and estimate the impact of those reforms on the number of firms through the following
23
difference in differences model:
Ykt=βF Tkt+αXkt+δk+γt+kt, (1)
where k denotes the geographical unit (canton) and t the year. The dependent variable
Ykt accounts for the number of firms in canton kand year t. F Tkt is a dummy taking the
value of1 whenever a given canton applies a FTR scheme and0 otherwise. Xkt is the set
of control variables described in Section 4 andδk andγt are, respectively, canton and year
fixed effects. Finally,ktis the error term.
5.2 Identification
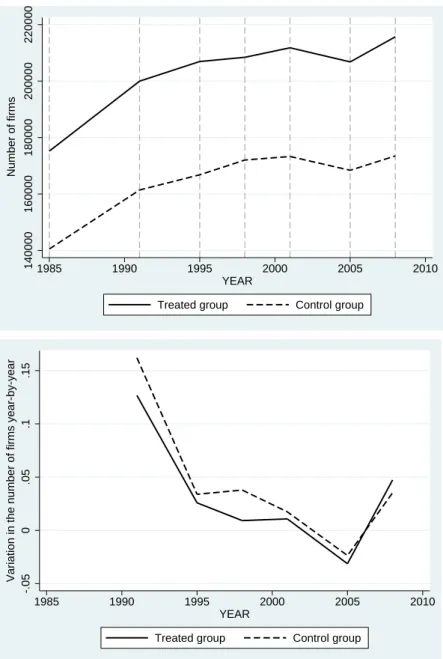
The crucial identifying assumption in a difference-in-differences estimation is the presence of a common trend of the dependent variable for both the treatment and control groups. Unfortunately, we cannot formally test the common trend assumption as we only have one year of pre-reform data. However, the two graphs in Figure 1 suggest that the common trend assumption is likely to hold. The upper panel shows the evolution in the number of firms for both groups (i.e. switchers and non-switchers ) over the 23-year time period. The lower panel shows the differences in the trends for both groups. Each point represents the average of the variation of the number of firms in a given canton, belonging to the specified group, in that particular year. For instance, whereas in2008the treated group includes 14 cantons, in1990just Jura and Lucerne were part of it. As it is shown in both graphs, the number of firms shows similar underling trends for both switcher and non-switcher cantons. Indeed, it is worth mentioning that eventually we also include cantonal time trends that control for potential differences in the slope of the common trends.
The other concern that often arises when applying difference-in-differences regards the potential endogeneity of the selection of switcher cantons. To put it differently, our estimates would be biased if the reforming decision is not orthogonal to observable and unobservable factors that affect, at the same time, the location decision of corporations. We take a number of steps to test whether self selection is an issue in our framework.
First, one could argue that the timing and the decision to reform in a given canton might depend on the stock of firms (or the difference) in previous years. This would be possible if the flat tax reforms took place as a reaction to particular conditions that directly or indirectly had an impact on the number of businesses in that jurisdiction. We tackle this issue by assessing the presence of potential feedback effects. Table 4 shows the results of a logit estimation, where the dependent variable is our flat tax dummy and the main regressor of interest is the number (or, alternatively, the variation) of firms in a given canton lagged 1 and 2 periods. The coefficients are not significantly different from zero. Hence, there are no feedback effects that might be a signal of endogenous selection into the treatment.
Second, the selection bias is likely to be stronger if the treated and the control groups are significantly different among each other. We thus check that the two groups are similar enough i.e. that there is pre-treatment balance between both groups. Table 5 shows the average value of a set of socio-economic characteristics for the two groups in1985, when no reform had taken place yet. Among them, only the percentage of left-wing votes shows a difference that is significantly different from0. However, as it we will be shown in Section 6, the inclusion of this variable has no effect on the final estimates.
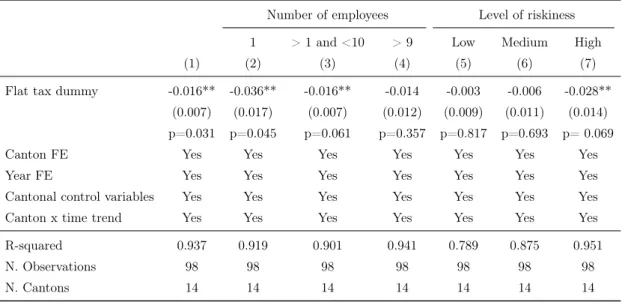
Finally, as a robustness check, in Table A.1, we replicate all the relevant estimations shown in Section 6, but constraining our sample to the treated cantons. Excluding the non-switcher cantons allows us to be confident about the causal interpretation of our estimates because, in this case, the identification relays solely on the randomness of the timing of the reform.
5.3 Inference
As it is described by Cameron and Miller (2015), whenever regression model errors are correlated within clusters, not controlling for within-cluster error correlation can overstate estimation precision by generating misleadingly small standard errors, misleadingly narrow confidence intervals and, thus, large t-statistics and low p-values. The need for such a control obviously increases with the magnitude of the within-cluster error correlation. In our model, theflat tax dummy equals1for the year that the flat tax reform was introduced and every year thereafter. Hence, we are in presence of high serial correlation and, thus, the default standard errors are expected to be downwards-biased. In order to get valid standard errors, we compute them by using the cluster-robust estimate of the variance matrix (Cameron and Miller, 2015) by clustering our standard errors at the cantonal level. As it is well known, the cluster-robust covariance matrix is consistent when the number of clusters tends to infinity. In practice though, the rule of thumb suggests that one should have, at least, between 20 and 50 clusters in order to avoid this issue. Given the low number of Swiss cantons, we are left with a too low number of clusters that might be an issue. Therefore, we follow Cameron et al. (2008) and report the p-value generated using the wild-bootstrap method.
6
Results
6.1 Baseline results
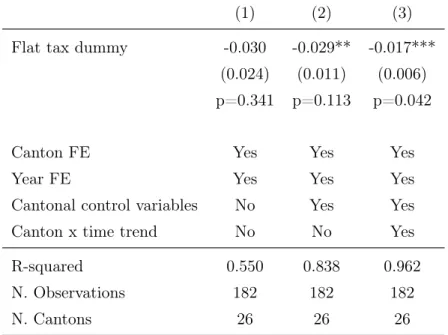
Our baseline results are shown in Table 6, where we estimate the model described in Equation (1). All columns show a negative effect of the flat tax reform on the number of firms in a given canton. Moreover, as shown in columns (2) and (3), the more demanding specifications in terms of included controls, the main regressor is statistically significantly
different from 0. It is worth mentioning that the inclusion of the time varying control variables do not have a strong impact on the size of the coefficient, reducing the concern about potential selection bias (Altonji et al., 2005). On the other hand, by adding cantonal time trends the size of the coefficient is reduced but the precision of the estimation increases i.e. the coefficient is statistically significantly different from 0 at the 1% level. It is worth mentioning that the precision of our estimates is not affected after we correct for the low number of clusters by applying wild bootstrap.
The dependent variable is the logarithm of the number of firms. Thus, the estimated coefficients for the flat tax dummy represent the semi-elasticity of the number of firms with respect to the introduction of the reform. Hence, the coefficient of theflat tax dummy
in our preferred specification (Column 3) suggests that, on average, introducing a FTR scheme on corporate taxes decreases the number of firms by roughly1.7%. For the average canton in our sample, this implies a reduction of roughly240firms.
6.2 Heterogeneities in the impact of the flat tax reform
In Section 2 we discuss both the intuition and theoretical framework behind the insurance effect, which we believe could be among the main factors explaining the average negative effect found in our baseline estimation. Similarly, we explain why, in our setting, the simplicity effect is likely to have a negligible impact on our dependent variable. In this section we compute a set of alternative estimations to identify heterogeneities in the impact of ourflat tax dummy and, thus, to shed some light on the channels behind our findings.
In other words, so far, our results suggest that, on average, introducing a flat tax reform on corporate income taxes reduces the number of firms in a given canton. We now want to assess whether the insurance effect could be a potential explanation of this effect. As discussed in Section 3.2, if the insurance effect played a role, riskier firms should react more than the average firm to the introduction of the reform because of the observed reduction in the progressivity level of the post-reform cantonal corporate tax schedules.
Ideally, to test this, we would have liked to compute the distribution of riskiness for all firms and estimate the heterogeneous impact of the flat tax reform depending on the riskiness of a given company. Unfortunately, the data do not allow us to follow this strategy. Hence, we follow several strands of literature that link the size of the firm to its riskiness and use the firm size as a proxy for its level of riskiness. For instance, Ballantine et al. (1993) analyses the connections between variations in profits and loss rates among firms in small-firm and large-firm size classes as reflections of uncertainty finding that, within industries, such variations are particularly important for smaller firms. Moreover, models of equilibrium credit rationing assessing moral hazard and adverse selection issues also suggest that small firms may be particularly vulnerable (Stiglitz and Weiss, 1981). These models highlight that small firms are often informationally opaque i.e. smaller firms are
a greater challenge for lenders because of difficulties in assessing risk due to, for instance, a lack of publicly available, transparent information (Cole et al., 2004). Finally, small firms are also vulnerable because of their dependency on financial institutions for external funding. These firms simply do not have access to public capital markets. As a result, shocks to the banking system can have a significant impact on the supply of credit to small businesses. In a recent study using U.S. data, for instance, Mills and McCarthy (2014) find a sharp decline in bank lending to small businesses during the 2008 financial crisis and a relatively slow recovery.
Our empirical strategy is as follows: we estimate Equation (1) by considering alternative definitions of the dependent variable. In the first three columns of Table 7, the dependent variable is the cantonal number of establishments with: 1 employee, between 2 and 9 employees and more than 9 employees. Our estimates are consistent with the presence of the insurance effect. As expected, the sensitivity of businesses with just one employee to the introduction of a flat tax reform is significantly higher than the one from our baseline estimation. Column (1) shows that introducing a FTR scheme reduces uni-personal firms by3.9%i.e. more than twice the coefficient found for the average firm (Column (3) in Table 6). Moreover, the magnitude of the estimates decreases as firms’ size increases i.e. whereas for small-medium sized enterprises, the coefficient is1.4% (Column 2), the one for bigger firms is0.7% and is not statistically significant (Column 3). Hence, our estimates suggest that, indeed, riskier firms (proxied by their size) react more than the average business to an introduction of a flat tax reform.
Moreover, our results confirm that the simplicity effect plays no role in our setting. As discussed in Section 2, if this effect had a significant role, its effect should only be relevant for SMEs. In other words, the positive impact of the simplicity effect on the number of firms in a given canton should reduce the size of our (negative) estimates more for smaller firms. This is clearly not the case.
One could be concerned that the observed heterogeneous impact of ourflat tax dummy
by firm size is driven by other factors than the insurance effect. In particular, a GTR scheme could create incentives for firms to open more than 1 legal entity to artificially shift income among them. Such a tax planning strategy would allow each of these entities to face the lowest tax bracket offered by the GTR system and, hence, the firm would reduce its overall tax liability. On the other hand, once a flat tax reform is introduced, the incentives to split would disappear and, thus, the firm could have interest to concentrate its activities under a single entity due to, for instance, economies of scale. If this was the case, our main regressor could be identifying firms "merging back" after having artificially split for tax reasons, rather than a real decrease in the number of businesses. To tackle this issue, we construct an alternative proxy for firm-level riskiness, which arises directly from the rational behind the framework developed by Bacher and Brülhart (2013) and that does
not present the potential issue of identification linked to tax planning behaviour described before. More precisely, we construct a riskiness indicator based on the sectoral variance of profits, which is independent of the strategic tax planning behaviour of businesses. We use data from Orbis (Bureau van Dijk), from which we gather comparable financial and business information on nearly3million firms from the EU-15countries over9years (2004
-2012).24 Ideally, we would have used a time-variant measure of riskiness. However, given that the data on profits are available just for 2 out of the 8 years of our panel, we use the time-average of the standard deviation of profits within sectors. In other words, we assume that the distribution of sectors among the different levels of riskiness in EU-15 is a good proxy for the Swiss distribution. In columns (4) to (6) of Table 7 we show the estimates for our second proxy of riskiness, the variance of profits among sectors. Once again, the results are consistent with the presence of the insurance effect. Whereas firms in low and medium risk sectors are not significantly affected by the introduction of cantonal flat tax reforms, those with activities in the riskiest sectors show a negative and statistically significant effect. In concrete, there is a2.7% reduction in the number of firms from risky sectors in switcher cantons compared to the number of businesses in those sectors were no reform was introduced. These estimates confirm that riskier firms are more sensitive to the introduction of a flat tax reform on profits and, at the same time, rule out potential concerns about strategic tax planning behavior affecting our estimates.
To sum up, the heterogeneous impact of the reform with respect to the riskiness of the firms (no matter how riskiness is measured) tends to confirm the presence of the insurance effect previously found in Bacher and Brülhart (2013).
7
Conclusion
This paper assesses the effect of introducing a flat tax reform on corporate income taxes on firms’ location choices. To estimate our model, we apply a panel-based difference-in-differences approach that exploits the different timing in the implementation of the reform by different Swiss cantons.
Our results show that the effect of such a reform is, on average, negative and statistically significant but rather small. Switching to a FTR system on profits reduces the number of firms by1.7%, which for the average canton in our sample implies a reduction of roughly
240firms.
Our interpretation of these results goes through the insurance effect. This effect sug-gests that, the reduction in the uncertainty on future profits’ realizations given by a progres-sive tax schedule acts as insurance for the entrepreneur and, hence, (risk averse) businesses
24
EU-15area countries are: Austria, Belgium, Denmark, Finland, France, Germany, Greece, Ireland,
prefer to locate in jurisdictions where a GTR scheme is in place. To empirically test for the presence of the insurance effect, we construct two indicators of firm-level riskiness i.e. the firm size and an indicator based on the sectoral variance of profits. The presence of heterogeneous effects among the different level of riskiness of the firm (whatever indicator of riskiness is used) indicates that riskier businesses are more sensitive to the introduction of a flat tax reform on profits than the average firm and, hence, confirms the presence of the insurance effect previously found in (Bacher and Brülhart, 2013).
In addition, our results i) confirm that the simplicity effect play no role and ii) rule out potential concerns about confounding factors such as strategic tax planning behavior.
Finally, let us briefly discuss some potential policy implications of our findings. First, as mentioned before, there is a widespread belief that flat tax reforms should consider-ably simplify the tax code and, thus, make a location more attractive to businesses. As shown by our estimations, this is not the case in Switzerland, where the introduction of proportional taxation has, on average, a negative impact on the number of firms in a given jurisdiction. From this perspective, our paper gives an important message to policy makers deciding which tax system to be applied. Second, in order to test for the presence of the insurance effect, we compute alternative estimations that show significant heterogeneities in the impact of the reform. Interestingly, these heterogeneous effects could be seen as a policy instrument per se. For instance, there is an important debate behind whether differential targeted policies are economically justified for SMEs.25 Our results show that the negative impact of a flat tax reform on profits is larger for smaller firms. Hence, even if the average effect on the tax base is rather small, policy makers would be better advised to internalize the heterogeneities regarding the impact of the reform as well as the potential redistribution issues that may arise once the flat tax reform is implemented.
25
140000 160000 180000 200000 220000 Number of firms 1985 1990 1995 2000 2005 2010 YEAR
Treated group Control group
-.05
0
.05
.1
.15
Variation in the number of firms year-by-year
1985 1990 1995 2000 2005 2010 YEAR
Treated group Control group
Table 1: Sample details
Canton Abbreviation Flat tax
reform (year)
Aargau AG No
Appenzell Ausserrhoden AR Yes (1993) Appenzell Innerrhoden AI Yes (1995)
Basel-Landschaft BL No Basel-Stadt BS No Bern BE No Fribourg FR No Geneva GE Yes (1999) Glarus GL Yes (2009) Graubünden GR Yes (2010) Jura JU Yes (1990) Lucerne LU Yes (1991) Neuchâtel NE No Nidwalden NW Yes (1995) Obwalden OW Yes (1995) Schaffhausen SH Yes (2008) Schwyz SZ Yes (2010) Solothurn SO No St. Gallen SG Yes (2007) Thurgau TG Yes (2006) Ticino TI Yes (1995) Uri UR Yes (2007) Valais VS No Vaud VD Yes (2002) Zug ZG No Zürich ZH Yes (2005) Total 17
T able 2: Can tonal flat tax reforms Can ton Flat tax adopted Corp orate income Capital Other changes T ax rates Changes in deductio ns T ax rates Before After Before After AI 1995 4%-8% 7% Deductions on hous ing main tena nce and reno v ation w ere elim inated. In tro duction of a 10% ca p for deductions on charitable donations. 1.5% 1.5% Minor mo dification in the capital tax base definition. AR 1993 0%-2.3% 2.6% Ma jor mo difications to the whole deductions structure (c hanges in al l items in the list of p ossible deductions). 0.7% 0.7% Minor mo dification in the capital tax base definition. GE 1999 6%-14% 10% 2% 1.8% (2% for firms that are non taxable on profits While b efore the reform, m unicipalities taxed corp orate income on the same basis as the can ton, afte r the reform they do it on an additional cen ts basis (the m unicipalit y increase the effec tiv e tax rate b y a certain amoun t rather than through a m ultiplier). Minor mo d ification in the corp orate income tax base definition. Before the reform, the o wn capital w as included in the form ula to compute the taxable income. JU 1990 2.3%-3.5% with a maxim um effectiv e tax rate (including the m ultipliers) of 6.5% 4% w ithout considering amoun ts smaller than 1000 CHF Before the reform, the first deductions on transf ers to p ension funds for emplo y ees had no limit and the follo wing ones w ere deductible up to 15% of the w ages. After the reform, these limits w ere eliminated. Th e p er io d for whic h previous losses are deductible increased from 3 (4 unde r authorization ) to 7 fiscal y ears. 0.6%-1.25% 1% The capital tax system also changed from a p rogressiv e to a flat ta x sc heme. Before the reform, if the can tonal m ultip lier more than doubled the sta tutory tax rate, it w as sub ject to a referendum.
T able 2: Can tonal flat tax reforms Can ton Flat tax adopted Corp orate income Capital Other changes T ax rates Changes in deductio ns T ax rates Before After Before After LU 1991 4%-7.2% 4% Deductions on charitable donations w ere in tro duc ed (up to 10% of taxable income with a ca p of 1000 CHF). 1% 1% The 32% cap for the total cor p orate tax (can tonal + m u nicipal + ch urc h) w as eliminated. NW 1995 1.8%-3.8% 3.2% 0. 4%-0.5% 0.35% The capital tax system also changed from a p rogressiv e to a flat ta x sc heme. O W 1995 1%-2.5% 2.1% Minor mo difications in the deductions on charitable donations (e.g., the net profits cap increased from 10% to 20%). 0.5% 0.4% Minor mo dification in the capital tax base definition. SG 2007 4.5%-7.5% 4,50% Deductions on charitable donations increased from 10% to 20% of rep orted profits. 0.2% 0.2% SH 20 08 6%-10% 5% The cap on deductions on charitable do nations w as incre ased from 10% to 20% of net income. Moreo v er, the p ossibilit y of deducting v ol un tary con tributions to the federal go v ernmen t, ca n tons, m unicipalities for public institutions w as in tro duced. 1.5% 1% TG 2006 3%-7% with a maxim um of 140.000 CHF 4% Minor mo difications in the deductions on charitable donations (in tro duction of the p o ssibilit y of deducting v ol un tary con tributions to the federal go v ernmen t, ca n tons, m unicipalities for their institutions). 1.5% 0.3% with a minim um of 100 CHF
T able 2: Can tonal flat tax reforms Can ton Flat tax adopted Corp orate income Capital Other changes T ax rates Changes in deductio ns T ax rates Before After Before After TI 1995 5%-18% of net profits with a maxim um effectiv e tax rate (including the m ultipliers) of 14% 13% of taxable profits The p erio d for whic h previous losses can b e deducted w as extended from 3 to 7 fiscal y ears. Deductions on charitable donations w ere in tro duc ed up to 5000 CHF. 3% 3% Minor mo difications in the capital tax base definition, main ly regarding the foreign capital fu nds that can b e treated as o wn capital fund s. UR 2007 4.5%-13% with a total maxim um of 13% 2% Minor mo difications in the deductions on charitable donations (e.g., the net profits cap increased from 10% to 20%). 0.5% 0% VD 2002 4%-14% 9,50% In tro duction of ded uctions on researc h and dev el opmen t en tru sted to third parties (up to 10% o f taxable profits with a cap of 1 million CHF). Minor mo dificati ons in the deductions on charitable donations (e.g., in tro duction of a 10% of net profits cap). 2% 1.2% Minor mo difications in the capital tax base definition (e.g. , an exception concerning the prop ortion of the capital represen ted b y shares of public compan ies for whic h no divid end is issued w as eliminated). ZH 2005 4%-10% 8% 1.5% 0.75% Minor mo difications in the capital tax base definition. Profits o n securities and liquidations w ere not taxable an y more after the reform. Source: The official comp endium of can tonal tax la ws, Steuern der Sc h w eiz, whic h repro duces the con ten t of all ca n tonal tax la ws in a standardized format.
Table 3: Summary statistics
Variable Mean Std. Dev. Min. Max. N
Number of firms 14179.79 14748.15 774 70179 182 Number of firms with 1 employee 3613.76 3951.3 182 21038 182 Number of firms with between 2 and 9 employees 7994.24 8108.18 479 36829 182 Number of firms with more than 9 employees 6185.54 6674.28 286 33827 182 Number of firms in low risk sectors 2766.29 2736.07 188 12032 182 Number of firms in medium risk sectors 7721.97 7838.45 402 34429 182 Number of firms in high risk sectors 5700.09 6493.89 202 33933 182
Flat tax dummy 0.264 0.442 0 1 182
Corporate tax rate 12.2 3.23 4.9 21.9 182
Personal income tax rate 23.10 4.91 10.76 32.08 182 Population (in1.000) 274.61 284.65 13.28 1332.73 182 % Inactive and unemployed 2.8 1.8 0.5 8.5 182
% Young (≤15) 18.2 2.4 11.4 24.2 182
% Old (≥65) 14.8 2.1 10.3 21.0 182
% Foreigners 16.5 6.4 6.2 38.1 182
% German speaking population 66.7 33.6 3.9 94.0 182 % Left-wing votes in national ballots 25.49 15.88 0 85.7 182 % Protestant population 28.5 1.85 4.7 77.0 182
Table 4: Feedback effects
(1) (2) (3) (4) Log Total number of firmst−1 2.781
(3.324) Log Total number of firmst−2 2.929
(4.798)
∆Log Total number of firmst−1 -7.867
(5.012)
∆Log Total number of firmst−2 3.882
(2.774)
Notes: The dependent variable isFlat tax dummy. All estimations also include: corporate tax rate,personal income tax rate,Log(population),% inactive and unemployed,% young (≤ 15),% old (≥65),% foreigners,% German speaking populationand% protestant population
and% left votes in national ballots. Standard errors (in parenthesis) are clustered at the cantonal level. * p<0.1, ** p<0.05 and *** p<0.01.
Table 5: Pre-treatment differences in cantonal characteristics
Control group Treated group Difference t-stat
(1) (2) (3) (4)
Number of firms 11711.42 12514.43 -803.01 -0.156 Number of firms with 1 employee 2493.30 2794.50 -301.20 -0.270 Number of firms with between 2 and 9 employees 6990.25 7388.92 -398.67 -0.132 Number of firms with more than 9 employees 4721.16 5125.5 -404.34 -0.190 Number of firms in low risk sectors 2585.08 2503.85 81.23 0.076 Number of firms in medium risk sectors 6944.25 7075.14 -130.89 -0.045 Number of firms in high risk sectors 3920.83 4724.42 -803.59 -0.397
Corporate tax rate 12.36 13.05 -.68 -0.526
Personal income tax rate 24.81 24.51 0.30 0.156 Population (in1.000) 251343.8 251312.4 31.39 0.00 % Left-wing votes in national ballots 25.20 17.20 8.00 1.633 % Inactive and unemployed 0.007 0.008 -0.001 -0.640
% Young (≤15) 0.200 0.207 -0.007 -0.633
% Old (≥65) 0.134 0.143 -0.008 -0.975
% Foreigners 0.126 0.135 -0.009 -0.0394
% German speaking population 0.68 0.66 0.02 0.103 % Protestant population 0.373 0.293 0.080 0.908
Notes: Each row shows the mean value of the variable for the control and the treated groups ( columns (1) and (2), respectively) at the beginning of our sample period (1985). Column (3) reports the difference between the two groups and Column (4) shows the t-value of the difference.
Table 6: Cantonal flat tax reforms and the number of firms (1) (2) (3)
Flat tax dummy -0.030 -0.029** -0.017*** (0.024) (0.011) (0.006) p=0.341 p=0.113 p=0.042
Canton FE Yes Yes Yes
Year FE Yes Yes Yes
Cantonal control variables No Yes Yes Canton x time trend No No Yes
R-squared 0.550 0.838 0.962 N. Observations 182 182 182
N. Cantons 26 26 26
Notes: The dependent variable is Log(total number of firms). Cantonal con-trol variables are:corporate tax rate,personal income tax rate,Log(population), % inactive and unemployed, % young (≤ 15),% old (≥ 65), % foreigners,% German speaking population and% protestant population and% left votes in national ballots. Standard errors (in parenthesis) are clustered at the cantonal level. Below the standard errors we report the p-values computed using wild bootstrap. * p<0.1, ** p<0.05 and *** p<0.01.
Table 7: Heterogeneous effect of flat tax reforms
Number of employees Level of riskiness 1 > 1 and <10 > 9 Low Medium High
(1) (2) (3) (4) (5) (6)
Flat tax dummy -0.039** -0.014** 0.007 0.002 -0.012 -0.027** (0.018) (0.007) (0.011) (0.009) (0.012) (0.013) p=0.060 p=0.074 p=0.229 p=0.888 p=0.379 p=0.068
Canton FE Yes Yes Yes Yes Yes Yes
Year FE Yes Yes Yes Yes Yes Yes
Canton control variables Yes Yes Yes Yes Yes Yes Cantonal x time trend Yes Yes Yes Yes Yes Yes R-squared 0.949 0.944 0.946 0.874 0.901 0.968
N. Observations 182 182 182 182 182 182
N. Cantons 26 26 26 26 26 26
Notes: The dependent variable is, in each column,Log(total number of firms)of each specific group. Cantonal control variables are:corporate tax rate,personal income tax rate,Log(population),% inactive and unemployed,% young (≤15),% old (≥65),% foreigners,% German speaking populationand% protestant populationand% left votes in national ballots. Standard errors (in parenthesis) are clustered at the cantonal level. Below the standard errors we report the p-values computed using wild bootstrap. * p<0.1, ** p<0.05 and *** p<0.01.
Appendix A
Table A.1: Robustness check - Only treated cantons
Number of employees Level of riskiness 1 > 1 and <10 > 9 Low Medium High
(1) (2) (3) (4) (5) (6) (7)
Flat tax dummy -0.016** -0.036** -0.016** -0.014 -0.003 -0.006 -0.028** (0.007) (0.017) (0.007) (0.012) (0.009) (0.011) (0.014) p=0.031 p=0.045 p=0.061 p=0.357 p=0.817 p=0.693 p= 0.069
Canton FE Yes Yes Yes Yes Yes Yes Yes
Year FE Yes Yes Yes Yes Yes Yes Yes
Cantonal control variables Yes Yes Yes Yes Yes Yes Yes Canton x time trend Yes Yes Yes Yes Yes Yes Yes R-squared 0.937 0.919 0.901 0.941 0.789 0.875 0.951
N. Observations 98 98 98 98 98 98 98
N. Cantons 14 14 14 14 14 14 14
Notes: Whereas in Column (1) the dependent variable isLog(total number of firms), in the other columns it isLog(total number of firms)of each specific group. Cantonal control variables are:corporate tax rate,personal income tax rate,Log(population),% inactive and unemployed,
% young (≤15),% old (≥65),% foreigners,% German speaking populationand% protestant populationand% left votes in national ballots. Standard errors (in parenthesis) are clustered by canton. Below the standard errors we report the p-values computed using wild bootstrap. * p<0.1, ** p<0.05 and *** p<0.01.
Appendix B
Davies and Hoy (2002) show that, given a distribution of before-tax income and revenue neutrality, after-tax inequality is monotonically declining in the rate of the FTR scheme in which the allowances adjust to generate the same tax yield.26 Proposition 1 summarizes their main results.
Proposition 1 For any revenue neutral tax reform, which replaces a GTR with a FTR, there exists a critical flat tax rate (tF) such that compared to the GTR, after-tax income progressivity is:
1. lower (for any inequality index) with any tF ≤tlF, 2. higher (for any inequality index) with any tF ≥tuF,
3. the same for a given inequality index at a specific flat tax rate between the lower and upper boundaries (tlF < tF < tuF).
The lower bound (tlF) corresponds to the flat tax rate which provides a revenue neutral solution if the deduction is kept at the same level as for the GTR. The upper bound (tuF) is given by the flat tax rate ensuring that individuals with the highest incomes pay the same tax under both schemes. Finally, note that in comparison to the GTR, bothtl
F and tuF should lie between the lowest and highest graduated tax rates.
26
Davies and Hoy (2002) derive these conditions focusing on revenue neutral reforms. Nevertheless, by applying the Hemming–Keen result for non-equal yield comparisons developed in Hemming and Keen (1983), Keen et al. (2008) describe that the results used above continue to apply when the reform is not revenue neutral.
References
Altonji, Joseph G., Todd E. Elder, and Christopher R. Taber (2005) ‘Selection on observed and unobserved variables: Assessing the effectiveness of catholic schools.’ Journal of Political Economy 113(1), 151–184
Atkinson, Anthony Barnes (1996) ‘Public economics in action: the basic income/flat tax proposal.’ OUP Catalogue, Oxford University Press
Auerbach, Alan J., and Joel Slemrod (1997) ‘The Economic Effects of the Tax Reform Act of 1986.’Journal of Economic Literature 35(2), 589–632
Bacher, Hans, and Marius Brülhart (2013) ‘Progressive taxes and firm births.’International Tax and Public Finance 20(1), 129–168
Ballantine, John W, Frederick W Cleveland, and C Timothy Koeller (1993) ‘Profitability, uncertainty, and firm size.’Small Business Economics 5(2), 87–100
Barrios, Salvador, Harry Huizinga, Luc Laeven, and Gaëtan Nicodème (2012) ‘Interna-tional taxation and multina‘Interna-tional firm location decisions.’Journal of Public Economics
96(11), 946–958
Becker, Sascha O., Peter H. Egger, and Valeria Merlo (2012) ‘How low business tax rates attract mne activity: Municipality-level evidence from germany.’Journal of Public Eco-nomics96(9-10), 698–711
Brook, Anne-Marie, and Willi Leibfritz (2005) ‘Slovakia’s introduction of a flat tax as part of wider economic reforms.’ OECD Economics Department Working Papers 448, OECD Publishing
Brülhart, Marius, Mario Jametti, and Kurt Schmidheiny (2012) ‘Do agglomeration economies reduce the sensitivity of firm location to tax differentials?’ Economic Journal
122(563), 1069–1093
Cameron, A. Colin, and Douglas L. Miller (2015) ‘A practitioner’s guide to cluster-robust inference.’Journal of Human Resources 50(2), 317–372
Cameron, A. Colin, Jonah B. Gelbach, and Douglas L. Miller (2008) ‘Bootstrap-Based Im-provements for Inference with Clustered Errors.’The Review of Economics and Statistics
90(3), 414–427
Carey, David, Kathryn Gordon, and Philippe Thalmann (1999) ‘Tax Reform in Switzer-land.’ OECD Economics Department Working Papers 222, OECD Publishing