University of Nebraska - Lincoln University of Nebraska - Lincoln
DigitalCommons@University of Nebraska - Lincoln
DigitalCommons@University of Nebraska - Lincoln
Cornhusker Economics Agricultural Economics Department
3-2012
Nebraska Farmland Values Soar
Nebraska Farmland Values Soar
Bruce Johnson
University of Nebraska-Lincoln
Follow this and additional works at: https://digitalcommons.unl.edu/agecon_cornhusker
Part of the Agricultural and Resource Economics Commons
Johnson, Bruce, "Nebraska Farmland Values Soar" (2012). Cornhusker Economics. 570.
https://digitalcommons.unl.edu/agecon_cornhusker/570
This Article is brought to you for free and open access by the Agricultural Economics Department at
DigitalCommons@University of Nebraska - Lincoln. It has been accepted for inclusion in Cornhusker Economics by an authorized administrator of DigitalCommons@University of Nebraska - Lincoln.
C
ORNHUSKER
E
CONOMICS
University of Nebraska–Lincoln Extension
March 7, 2012
Institute of Agriculture & Natural Resources Department of Agricultural Economics http://agecon.unl.edu/cornhuskereconomics
Nebraska Farmland Values Soar
Market Report
Yr Ago
4 Wks
Ago 3/2/12
Livestock and Products, Weekly Average
Nebraska Slaughter Steers,
35-65% Choice, Live Weight. . . . Nebraska Feeder Steers,
Med. & Large Frame, 550-600 lb.. . . . Nebraska Feeder Steers,
Med. & Large Frame 750-800 lb. . . . . Choice Boxed Beef,
600-750 lb. Carcass. . . . Western Corn Belt Base Hog Price Carcass, Negotiated. . . . Pork Carcass Cutout, 185 lb. Carcass, 51-52% Lean.. . . . Slaughter Lambs, Ch. & Pr., Heavy, Wooled, South Dakota, Direct. . . . National Carcass Lamb Cutout, FOB. . . . $112.78 151.00 128.00 172.67 81.68 91.19 184.50 370.64 $123.95 184.46 156.82 183.34 85.93 84.88 148.25 383.49 $129.25 186.96 169.96 198.51 86.92 85.10 * 374.35 Crops,
Daily Spot Prices Wheat, No. 1, H.W.
Imperial, bu. . . . Corn, No. 2, Yellow
Omaha, bu. . . . Soybeans, No. 1, Yellow
Omaha, bu. . . . Grain Sorghum, No. 2, Yellow Dorchester, cwt. . . . Oats, No. 2, Heavy
Minneapolis, MN , bu. . . . 7.44 6.84 13.62 11.46 3.83 6.40 * * 10.98 3.39 6.36 * * 11.25 3.35 Feed
Alfalfa, Large Square Bales, Good to Premium, RFV 160-185 Northeast Nebraska, ton. . . . Alfalfa, Large Rounds, Good
Platte Valley, ton. . . . Grass Hay, Large Rounds, Good Nebraska, ton. . . . Dried Distillers Grains, 10% Moisture, Nebraska Average. . . . Wet Distillers Grains, 65-70% Moisture, Nebraska Average. . . . 14.00 72.50 * 201.00 76.00 250.00 145.00 100.00 196.00 75.00 225.00 145.00 100.00 215.25 75.50 *No Market
The 2012 UNL Nebraska Farm Real Estate Survey confirms what most people close to agriculture already knew – agricultural land values across the state have shot upward in recent months. Preliminary survey results show the state’s all-land average value as of February 1, 2012 to be at $2,410 per acre, 31 percent above the year-earlier level (Figure 1 and Table 1, on following pages). The annual gain, in both dollar amount and percentage, is the largest ever recorded in the 34-year history of the UNL land market survey series.
Cropland, particularly, showed pronounced value gains in every region of the state over the past year. In several areas of the state, values for some of the cropland classes rose 35 percent or more during the 12-month period. Clearly, a booming cash–grain economy in 2011 translated into spirited bidding for cropland. And at the same time that demand was robust, the amount of land for sale in any given local area was generally minimal. UNL survey reporters frequently commented that the land transfer market has been “so thin” (limited sales activity) that it is difficult to get a good reading on the market. In short, there are many “wannabe buyers” with few “wannabe sellers.”
The grazing land classes showed more modest value gains for the year, but overall for the state still showed a 19 percent increase for non-tillable grazing land. The tillable grazing land class (land considered to be potentially converted to cropland) recorded significantly higher values and larger higher percentage value gains in those areas of the state where no moratoriums are precluding further irrigation expansion.
Reflecting the great resource diversity across the state (land quality, water availability, climate, etc.) the per-acre values of land vary significantly. For example, the average value of center pivot irrigated land (pivot not included in the value) ranges from about $2,600 per acre in the Northwest District, to nearly $8,000 per acre in the East
E xtension is a D ivision of the Institute of A griculture and N atural R esources at the U niversity of N ebrask a–Lincoln cooperating w ith the C ounties and the U .S . D epartm ent of A griculture. U niversity of N ebrask a E xtension educational program s abide with the non-discrim ination policies of the U niversity of N ebrask a–Lincoln and the U nited S tates D epartm ent of A griculture.
District, with the highest quality irrigated land exceeding $10,000 per acre. Dryland cropland values show an even greater spread of more than seven-fold from west to east. In addition, the relative mix of cropland and grazing land in the all-land configuration is extremely variable, such that district all-land average values show nearly a ten-fold variation from west to east.
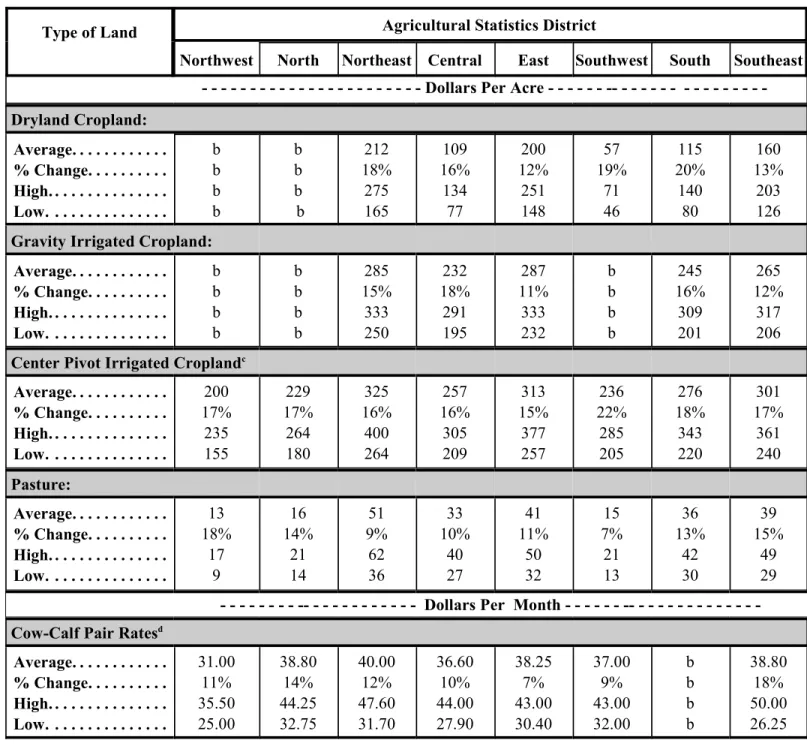
UNL survey reporters also reported higher cash rental rates for 2012 for all the land classes. But the percentage advances of cash rents over the previous year were considerably below the value advances (Table 2 on following page). For cropland, our preliminary cash rental rates reported for 2012 generally were up from 15 to 20 percent across most of the state. For contracts that are kept current every year, the 2011 to 2012 change would likely be more in the 10 to 15 percent range. While UNL reporters often commented that some contracted 2012 cropland rents were extremely high in their localities, they noted that they were the exceptions to a more deliberate pattern to rental negotiations. While high income earnings for cash-grain producers in 2011 have had some forward momentum into 2012, both landowners and tenants are aware that 2012 is not likely to be as profitable.
Pasture and grazing land rates are also reportedly higher in 2012. For most of the state, favorable rainfall patterns and good forage production in Nebraska have been quite a contrast to the pervasive drought conditions in the Southern Plains that have led to cow herd reductions. That, in combination with a recent return to profitable levels for the cattle industry, is behind much of the increase in 2012 rents, both on a per-acre and cow-calf pair basis.
A final note: these recent percentage value gains to Nebraska farmland beg the question, “Are they really sustainable?” If one assumes that farm incomes remain at 2011 earnings levels or higher, then one may answer with a guarded yes. However, more likely is an immediate future that is economically volatile for production agriculture – triggered by weather patterns, the strength of the dollar, interest rates, international financial fallouts and political unrest both here and abroad. That said, there is no question that some retreat of these value advances could easily happen in the next few years. Call it a realityreset. And it may be just what is needed as market participants are able to more accurately assess the underlying market fundamentals
.
Bruce Johnson, (402) 472-1794
Professor, Dept. of Agricultural Economics
University of Nebraska-Lincoln
bjohnson2@unl.edu
Figure 1. Average Value of Nebraska Farmland, February 1, 2012 and Percent Change from Year Earlier. PRELIMINARY
Table 1. Average Reported Value of Nebraska Farmland for Different Land Types and Sub-State Regions, February 1, 2012a PRELIMINARY
Type of Land and Year
Agricultural Statistics District
Northwest North Northeast Central East Southwest South Southeast Statec
Dryland Cropland (No Irrigation Potential) $/acre % Change 670 23 1050 31 4680 36 2180 36 5360 34 1240 42 2250 29 3845 31 2480 34
Dryland Cropland (Irrigation Potential) $/acre % Change 690 25 1625 35 5730 36 3485 48 6390 34 1290 43 2945 41 5140 41 4363 37
Grazing Land (Tillable) $/acre % Change 415 22 880 19 2640 26 1675 46 3160 34 570 16 1500 36 2400 34 1015 27
Grazing Land (Nontillable) $/acre % Change 330 18 440 13 1565 29 1005 24 1960 28 460 11 1080 34 1485 24 583 19 Hayland $/acre % Change 600 9 850 8 2025 36 1425 30 2525 37 950 36 1450 34 1600 28 1208 24
Gravity Irrigated Cropland $/acre % Change 2500 26 2430 19 6250 39 5160 31 7155 25 2865 45 5170 31 5710 33 5283 30
Center Pivot Irrigated Croplandb
$/acre % Change 2615 32 3905 32 6910 35 6065 34 7920 28 3815 38 5900 32 6820 36 5777 33
All Land Averagec
$/acre % Change 642 23 855 21 4908 35 2925 34 6044 31 1327 34 3352 32 4293 36 2410 31 SOURCE: 2011 and 2012 UNL Nebraska Farm Real Estate Market Developments Survey.
a
Value of pivot not included in per acre value.
b
Weighted averages.
c
Table 2. Reported Cash Rental Rates for Various Types of Nebraska Farmland and Pasture: 2012 Averages, Percent Change from 2011 and Ranges by Agricultural Statistics District. a
PRELIMINARY
Type of Land Agricultural Statistics District
Northwest North Northeast Central East Southwest South Southeast - - - Dollars Per Acre - - - -- - - - - - Dryland Cropland: Average. . . . % Change. . . . High. . . . Low. . . . b b b b b b b b 212 18% 275 165 109 16% 134 77 200 12% 251 148 57 19% 71 46 115 20% 140 80 160 13% 203 126
Gravity Irrigated Cropland: Average. . . . % Change. . . . High. . . . Low. . . . b b b b b b b b 285 15% 333 250 232 18% 291 195 287 11% 333 232 b b b b 245 16% 309 201 265 12% 317 206
Center Pivot Irrigated Croplandc
Average. . . . % Change. . . . High. . . . Low. . . . 200 17% 235 155 229 17% 264 180 325 16% 400 264 257 16% 305 209 313 15% 377 257 236 22% 285 205 276 18% 343 220 301 17% 361 240 Pasture: Average. . . . % Change. . . . High. . . . Low. . . . 13 18% 17 9 16 14% 21 14 51 9% 62 36 33 10% 40 27 41 11% 50 32 15 7% 21 13 36 13% 42 30 39 15% 49 29
Dollars Per Month Cow-Calf Pair Ratesd
Average. . . . % Change. . . . High. . . . Low. . . . 31.00 11% 35.50 25.00 38.80 14% 44.25 32.75 40.00 12% 47.60 31.70 36.60 10% 44.00 27.90 38.25 7% 43.00 30.40 37.00 9% 43.00 32.00 b b b b 38.80 18% 50.00 26.25 SOURCE: Reporters’ estimated cash rental rates (both averages and ranges) from the 2012 UNL Nebraska Farm Real Estate Market Developments
a
Survey.
Insufficient number of reports.
b
Cash rents on center pivot land assumes landowners own total irrigation system.
C
A cow-calf pair is typically considered to be 1.25 to 1.30 animal units (animal unit being 1,000 lb. animal). However, this can vary depending on weight
d
of cow and age of calf.