Commodity taxation and regulatory competition
∗
Simone Moriconi,
†Pierre M. Picard,
‡Skerdilajda Zanaj.
§July 18, 2013
Abstract
This paper studies competition in regulation and commodity taxation between trading countries. We present a general equilibrium model in which destination-based consumption taxes finance public goods and regulation of entry affects the number of firms in the markets. We find (i) no strategic interaction in commodity taxes; (ii)
regulation leads to lower commodity tax rates if demand for public goods is more sensitive to income than demand for private goods and (iii) regulation policy is a strategically complement instrument if consumers do not value product diversity too highly. We test our predictions using panel data for 21 OECD countries over the period 1990-2008. Our empirical analysis confirms the absence of strategic interactions for commodity taxes and show that domestic deregulation have positive effects on domestic commodity taxes. Countries also relax their regulation policies in response to the deregulation waves in their trade partner countries.
Keywords: Regulation, commodity tax, strategic interactions, fiscal federalism JEL:F0, H1, H7, H87, L5
∗We thank Anastasia Litina, Jacques-Francois Thisse and Gautham Tripathi for very helpful comments.
The paper has benefitted from presentations in seminars in Luxembourg, Milan, Brussels, and in the work-shop ”Public policies and spatial economics” in GATE, Lyon/Saint Etienne. The usual disclaimer applies. This project has been supported by the grant F2R-CRE-PUL-10EGQH at the University of Luxembourg.
†Universit`a Cattolica del Sacro Cuore, Department of Economics and Finance and University of
Luxem-bourg, CREA.E-mail: [email protected]
‡University of Luxembourg, CREA, L-1511 Luxembourg, and Universit´e catholique de Louvain, CORE,
Belgium. E-mail: [email protected].
1
Introduction
This paper studies competition in regulation and commodity taxation between trading coun-tries. A large literature in public economics investigates the existence and the impact of tax interactions between countries.1 Much less attention is devoted to the dependence between regulation and taxes and their interactions in an international context. This is puzzling because as Oates (2004, p. 377) writes, the “economic competition among governments makes use of a wide class of policy instruments including both fiscal and regulatory policies
[...]”. In particular, market regulation imposes costs on the production of goods and services and impedes the creation of new product varieties. It affects prices, product diversity and, consequently, consumer surpluses both at home and in foreign markets. As a result, we can expect interdependencies between the regulatory decisions of trading partners. This paper aims to fill this gap in the literature.
Importantly, the discussion of product market regulation cannot be disentangled from the issue of taxation, for two reasons. On the one hand, from an economic viewpoint, each country’s choice of commodity taxes depends on product market competitiveness, which is significantly influenced by market regulation. On the other hand, commodity taxation accounts for 18.9 percent of total government revenues in the OECD countries in 2003 (OECD 2005) and is, therefore, a policy instrument that should not be neglected in economic analysis. An extensive literature studies the strategic interactions among governments’ taxes and suggests that competition in commodity taxes is mitigated by the adoption of the destination principle (Mintz and Tulkens, [29]; Haufler et al, [21], Behrens et al. [6]; see Lockwood, [26] for a survey). However, the existence of strategic interactions between fiscal policies and market regulation has not been analyzed.
The contribution of this paper is three-fold. First, we investigate the existence and the nature of strategic interactions in commodity taxation under the destination principle, this regime being the one most widely used in developed countries. Second, we analyze the existence and nature of the strategic interactions in regulatory settings: does a country’s decision to weaken its regulatory setting entice trading partners to weaken or strengthen theirs? Third, we analyze how regulation policies affect commodity tax rates in an interna-tional context.
To investigate those points, we present a general equilibrium model where commodity taxes and regulatory pressures influence the creation of firms and products. Commodity taxes are used to finance a public goods while regulation is set by independent regulators who may seek rents. Commodity taxes are set under the destination principle while endoge-nous regulatory restrictions apply to a set of firms that sell their products under monopolistic competition. More specifically, we build a two-country trade model with immobile
als who consume private and public goods and work in firms, and with immobile firms that produce private goods, set prices and freely enter product markets. Public goods or services are supplied by public agencies. Regulation imposes additional costs on firms’ physical fixed costs. Benevolent governments set consumption taxes while regulators choose the regulation level. We combine two common views on regulation by assuming that regulators care for both consumers’ welfare and the rents from regulatory activities. Regulatory requirements are decided before commodity taxation in order to reflect governments’ greater flexibility in setting tax rates than in restructuring regulatory processes and standards. While a reform on tax rates often requires specifying a single tax figure on which parliament votes, regu-latory reform involves a long and cumbersome analysis of a nexus of laws and decrees and raises many industry specific contentions before any vote can be called.
The model generates three theoretical predictions. First, we show that commodity taxes are independent instruments under the destination principle. This result is in line with the literature on commodity tax competition, which finds strategic independence in commod-ity tax policies under the destination principle, in both perfect and imperfect competitive settings (see Lockwood, [26] for a survey). Second, regulation has a negative impact on com-modity tax rates if demand for public goods is more sensitive to income than demand for private goods. In this case, government lowers its commodity tax when regulation becomes stricter. Although this action leads to lower public good provision, it benefits consumers because it ‘neutralizes’ the negative impact of stricter regulation on private consumption. Finally, we show that regulation polices are strategic complement instruments as long as consumers do not excessively value product diversity. Under this condition, stronger foreign regulatory constraints oblige foreign firms to increase their production scale and lead to a deterioration in the foreign terms of trade. Since this improves domestic terms of trade and the competitive position of domestic firms, domestic regulators have incentives to strengthen domestic regulation in order to extract more rents.
In the empirical part of the paper, we investigate our three theoretical predictions using a unique dataset that combines information on product market regulation, consumption taxation, institutional characteristics and social preferences, for 21 OECD countries over the period 1990-2008. We estimate the model under a number of alternative specifications, accounting for potential endogeneity issues related to simultaneity, reverse causality, and spatial dependence, which are typical in empirical analyses of policy interactions (Brueckner, [8]). We use indicators of social distrust and materialist attitudes as instruments for product market regulation. In fact, the literature in cultural economics reports that the lack of trust and materialism are strongly correlated with local levels of product market regulation, while it does not identify any direct effect of these social attitudes with regulation of trading partners or with the local commodity taxation rates (see e.g. Inglehart [25], Aghion et al. [1]). To our knowledge, our paper is the first to exploit time variations of social preferences
to identify the impact of product market regulation on economic outcomes. Our baseline measure of product market regulation is the widely used ‘low level’ index which aggregates quantitative and qualitative information on entry barriers (Conway and Nicoletti [12]). We proxy consumption tax rates by average effective tax rates on consumption, following the methodology proposed by Carey and Rabesona [10]. That is, consumption tax rates are given by each country’s fiscal revenue from consumption taxes divided by the country’s total consumption. Since we focus on the destination principle, we exclude tax items that are likely to be affected by application of the origin principle (e.g. excise taxes) and we choose a weighting matrix that minimizes cross-border shopping between countries. The empirical results confirm the absence of commodity tax competition under the destination principle: domestic VAT policies have no significant effects on foreign ones. Our empirical results show also that, on average, stronger domestic regulations are associated with lower local consumption taxes, supporting the view that national governments use commodity taxes to ‘neutralize’ the negative welfare impact of long-lasting regulation. Finally, our results also show that, on average, OECD countries reduce domestic regulation in response to foreign deregulation, i.e., regulation policies are strategic complements. Our estimates suggest that medium term decisions regarding local deregulation have an important impact on a country’s ability to raise consumption taxes.
This paper contributes to the existing literature in the following ways. First, it revisits the theoretical foundation and empirical relevance of international competition in commod-ity taxation. The literature offers an extensive theoretical discussion of the welfare impact of commodity taxation under the destination and origin principles (see Lockwood, [26] for a survey). It also presents empirical evidence of strategic interactions under the origin prin-ciple. Egger et al. [16] find evidence of strategic complementarity of average effective tax rates on consumption using OECD panel data. Lockwood and Migali [27] show that the introduction of the EU Single Market in 1993 triggered strategic interactions among excise taxes in EU countries. Devereux et al. [13], using US panel data, find evidence of strate-gic complementarity of excise taxes on cigarettes. By contrast, the present paper presents empirical evidence of the absence of strategic interactions in destination-based taxation. Second, our paper investigates the impact of regulation policy on commodity taxation from both a theoretical and an empirical perspective. To our knowledge, there are no contribution in the public economics literature on this issue. There are some studies in environmental economics such as Oates and Schwab’s [33] discussion of impact of environmental regulations on taxes and welfare. Third, our paper contributes to the literature analyzing the regulation of entry and strategic interactions in regulation policy. Djankov et al [14] and Aghion et al. [1] analyze the social and cultural factors that affect entry regulation. Miyagiwa and Sato [28] analyze the optimal entry policy towards oligopoly in an globalized world and find
that globalization prevents countries from pursuing the optimal entry policy. However, these papers do not look at strategic interactions in regulation policy, which however are investi-gated in related fields, e.g. labor economics (e.g. Haaland and Wooton, [18]). Finally, the present paper discusses a general equilibrium framework where regulatory pressure inflates fixed costs and refrains the entry of firms. This modeling strategy conforms to the view that regulation is a market intervention refraining firms creation and creativity and to our mea-surement of regulatory pressure as the nexus of laws related to firm and product creation. It further allows us to disentangle the impact of regulation competition on product diversity and countries’ labor cost advantages (terms of trade), which has not yet been discussed in the literature.
The paper is structured as follows. Section 2 presents the theoretical model, Section 3 studies the strategic interactions in regulation and commodity taxation. Section 4 presents and discusses our empirical analysis. Section 5 concludes.
2
The model
We describe a general equilibrium economy with (i) commodity taxation with destination-principle and (ii) regulatory competition. We therefore assume two countries, home and foreign, with immobile unit populations. Variables pertaining to the foreign country are indexed by the superscript *. We describe the model for the domestic country, symmetric expressions holding for the foreign one.
Private good demand In the domestic country, consumers’ preferences are given by an increasing, separable, and concave utility function U(C, G) where C is a bundle of private commodities and G is a bundle of public goods, respectively. The bundle of private com-modities is defined over the varieties ω∈[0, N] such that:
C =Nξ Z N 0 c(ω)σ−σ1dω σ σ−1 , (1)
where c(ω) is the private consumption of variety ω and σ, σ > 1, is the elasticity of sub-stitution among varieties. The world number of varieties, N, is given by the sum of the endogenous numbers of domestic and foreign varieties, n and n∗. That is, N =n+n∗. As in Benassy (1996), the parameter ξ ∈[−1/(σ−1),0] measures the love for variety.2 Each consumer chooses her private consumption c(·) subject to her budget constraint
Z N
0
p(ω)c(ω)dω =W,
2There is no love for variety if ξ = −1/(σ−1) while love for variety is the same as the elasticity of
where p(ω) is the domestic (tax-inclusive) consumer price for variety ω and W is the con-sumer’s income. Hence, her demand for each variety is given by
c(ω) = p(ω) P −σ W P , (2) where P =hRN 0 p(ω) 1−σdωi 1 1−σ
is the domestic consumer price index.
Public goods supply and demand We assume a continuum of symmetric varieties of public goods. Each public good variety is produced by an independent public agency that uses private varieties in their production process. In particular, each public agency transforms a set of private varieties ω ∈[0, N] into its own variety of public good using the following technology: G=Nξ Z N 0 q(ω)σ−σ1dω σ−σ1 ,
whereq(ω) is the input demand of the public agency for varietyω. 3 The agency chooses the
input mix that maximizes the level G of its public good variety, taking all prices as givens and satisfying its budget constraint R0Np(ω)q(ω)dω =B, where B is the budget line of the agency. It naturally comes that the input demand is given by
q(ω) = p(ω) P −σ B P. (3)
Assuming symmetry of the consumers’ preferences and production technology across varieties of public goods, public agencies display the same demand for private varieties. Assuming further a unit mass of varieties of public goods, we readily have that the total demand for a private variety ω by the public sector and the bundle of public goods are given by q(ω) and
G.Similarly, the government budget for the production of public goods is equal to the agency budget line B. In the end, public and private consumptions are proportionate. Indeed, one can check that
q(ω)/c(ω) =B/W and G/C=B/W. (4)
Private production Each private firm has a production plant in a country and sell its products in the two countries under monopolistic competition. To be profitable, each variety must be produced by one and only one firm. Thus, firms can be indexed by ω ∈ [0, N]. A domestic firm ω has a profit given by
π(ω) = p(ω) τ −W [c(ω) +q(ω)] + p∗(ω) τ∗ −W [c∗(ω) +q∗(ω)]−f W,
3In this model, public agencies basically use outsourcing and procurement to supply the public good. A
large share of public infrastructures and services are supplied in this way. Furthermore, this approach yields analytical tractability. Similar results can be obtained using a public good provision produced with public labor and under constant returns to scale. Note that the parameterξreflects both the consumer’s love for diversity and the economies of scope in the production of public goods.
where p(ω) and p∗(ω) are its domestic and foreign prices, c(ω) and q(ω) are the demands from domestic private consumers and public agencies while c∗(ω) andq∗(ω) are the demand by foreign consumers and public agencies. To produce a unit of the good, each firm hires a unit of labor paying a wage equal toW and incurs a fixed labor inputf, which yields a fixed cost equal toW f. This fixed input f embeds the input needed to set up the firm’s economic activity (e.g. management, R&D, marketing, distribution, etc.) and the cost of complying to regulatory pressure (e.g. quality compliance, transfers to renters, etc.). The mechanism underlying this cost will be described in Section 3.2. For the sake of exposition, we measure domestic and foreign commodity taxes by the ratio between (tax-inclusive) consumer and (tax-exclusive) factory prices: τ > 1 and τ∗ >1. Commodity tax rates are simply equal to
τ −1 andτ∗−1. Taxes follow the destination principle and are set by governments.
Under monopolistic competition, each firm ω sets the domestic and foreign prices, p(ω) and p∗(ω) that maximize its profit taking all other variables as given. The optimal prices are given by p(ω) = σ σ−1τ W and p ∗ (ω) = σ σ−1τ ∗ W. (5)
Under monopolistic competition, firms enter until profits fall to zero. In the domestic coun-try, the above prices imply that each firm’s production scale x is equal to
x= (σ−1)f, (6)
which increases with setup costs. Similar expressions hold for the foreign country. Plugging optimal prices into the price indices we get the following property:
P τ = P∗ τ∗ = σ σ−1 nW1−σ+n∗W∗1−σ 1 1−σ . (7)
The cost of living is the same across countries once they are deflated by local commodity tax rates.
Labor and product market equilibrium In the domestic country, each firm demands
f +x = σf units of labor and the labor market clears when the total labor demand nf σ
equalizes its unit supply. Using (6) and applying the same argument for the foreign country we get the following number of firms
n = 1
σf and n
∗
= 1
σf∗. (8)
In each country, the number of firms is proportional to the labor force because they operate at the same production scale. Because of (6), setting the domestic regulatory entry cost f is equivalent to setting the domestic production scale and, ultimately, the number of domestic firms, n. For this reason, in the rest of the paper the choice of regulation is treated as the choice of the number of firms in the country.
For each domestic firm ω, the product supply x must satisfy the product demand: x =
c(ω) +q(ω) +c∗(ω) +q∗(ω). Using (2) and (3), this equality can be written as
x= p(ω) P −σ W +B P + p∗(ω) P∗ −σ W∗+B∗ P∗ .
Then, using (5) and (7), we obtain
x=W−σ σ−1 σ
(W +B)τ−1+ (W∗+B∗)τ∗−1
nW1−σ+n∗W∗1−σ ,
where the ratios on the right hand side are the same in both countries. As a result, given the production scale (6), wages satisfy
W W∗ = x x∗ −σ1 = f f∗ −σ1 . (9)
The relative wage falls with larger domestic production scales and therefore with larger domestic setup costs and stronger regulation. Indeed, when setup costs rise, domestic firms need to sell more to break even and therefore set a lower relative price. Since firms set constant markups over marginal costs and therefore wages, domestic firms can achieve a profit balance only when their relative wages fall. Ceteris paribus, a too strong regulation diminishes domestic prices and thus workers’ real wages and consumption. This is the effect of product market regulation on the domestic purchasing power, or equivalently, on the domestic terms of trade, W/W∗.
Government balance and consumption The government balances its tax revenues against its expenditures on the production of public goods,
(τ−1)W =B (10)
The equalities (6), (8) and (10) characterize the equilibrium in the product and labor markets and for a balanced budget. We can now compute the private and public consumption. The private consumption bundle is given by (1) and simplifies to
C = W
P N
ξ, (11)
and from (4) the public good consumption is equal to
G= (B/W)C= (τ −1)C. (12)
The consumption of private and public goods increase with real wages W/P. Using (7) and (9) real wages are given by
W P = σ−1 σ 1 τ n+n n∗ 1−σ1 n∗ σ−11 , (13)
wheren,n∗ and N =n+n∗ are given by (8). It is easy to check that taxes affect negatively the level of private consumption because they negatively affect real wages (see (11) and (13)). By contrast, a tax increase leads to a larger supply of public goods. Indeed, substituting (11) and (13) in (12) one readily finds that ∂G/∂τ > 0.
To check how private and public good consumption change with the number of goods produced domestically we substitute (13) in (11) and find
C = 1 τC0(n, n ∗) (14) where C0(n, n∗)≡ σ−1 σ n+n n∗ 1−σ1 n∗ σ−11 (n+n∗)ξ
is the consumption level in the absence of tax, which is a function ofnandn∗ only. It follows that G=C0(τ −1)/τ.
A stronger domestic regulation diminishes the level of domestic diversityn and therefore changes the utility from private consumption through two channels. On the one hand, it reduces the terms of tradeW/W∗, which reduces the term (n/n∗)1−1/σin the above expression
and therefore domestic consumers’ utility. On the other hand, it reduces product diversity and diminishes the utility from private consumption to the extent of the consumers’ taste for variety,ξ. When consumers express the same love for product diversity as under Stiglitz-Dixit preferences (ξ= 0), stronger regulation makes consumers worse off both because of a lower product diversity and worse terms of trade. However, things may slightly differ when consumers express no taste for variety (ξ = −1/(σ−1)). To show this, we compute the elasticity of private consumption with respect to n as follows:
∂lnC0 ∂lnn ≡Φ n n∗ = 1 (σ−1) " 1− 1 σ 1 1 + (n/n∗)σ1 # +ξ 1 1 + (n/n∗)−1. (15)
When consumers have love for variety (ξ = 0), this elasticity is obviously positive so that a rise in product diversity raises the domestic utility from private consumption. Instead, when ξ=−1/(σ−1), the sign of this elasticity depends on the balance between the effects of terms of trade and product diversity. Its sign is positive if the ratio n/n∗ is small enough (not too high above 1).4 In this case, the terms of trade dominate the effect of product
diversity. In the present model, this will be the most relevant case. By contrast, the sign of this elasticity can be negative if the ration/n∗ becomes large enough. In this case, a rise in domestic product diversity diminishes the utility from domestic private consumption.
We are now equipped to discuss the strategic interactions between governments and regulators.
4The elasticity ∂lnC
0/∂lnn is non-negative if σ(n/n∗) 1
σ −(n/n∗) ≥ 1−σ. This condition holds for n/n∗= 1 when countries have symmetric population sizes as in this model. The condition will not hold for very asymmetric population sizes so thatn/n∗is very large.
3
Strategic interactions between governments and
reg-ulators
In this paper, we consider government and regulatory agencies as independent entities. More-over, we take the view that regulatory processes and standards are less easy to restructure than commodity tax rates. Whereas a reform on the tax rate requires to specify a single tax figure on which parliament must vote, a regulation reform requires a long and cumbersome analysis of a nexus of laws and decrees and raises many industry specific contentions before any vote can be called for. We therefore model the interaction between government and reg-ulators as a sequential game in which regreg-ulators firstly set the firms’ entry requirements and then governments set their commodity tax rates. The game is solved by backward induction. We assume that each government is benevolent and maximizes its residents’ utility whereas each regulator has two facets: he cares for consumers’ welfare but also for his own rents. This provides a partial reconciliation of the two extreme views on bureaucracy. On the one hand, as in standard public economics, the regulator is benevolent in that it cares about the level of utility of the citizen. On the other hand, the bureaucrat has a Leviathan side aiming at increasing its own rents. More specifically, we assume that regulators weights their own rent and the residents’ welfare when deciding the level of regulations.
We begin with the analysis of the governments’ competition in commodity taxes.
3.1
Commodity tax competition
Each government sets the commodity tax rate that maximizes its residents’ utility, holding a balanced budget and taking the other tax and the regulatory setting as given. Because the domestic government maximizesU(C, G) or equivalentlyU[C0/τ, C0(τ −1)/τ)] and because
C0 is a function of only n and n∗, the optimal domestic commodity tax τ is independent
of the foreign tax. Indeed, in this setup, firms pass the entire commodity tax τ “through” consumers and the destination principle rules out cross border shopping.
Proposition 1 Under the destination tax principle, there exists no strategic interaction in commodity tax rates.
This is a known result in optimum taxation theory under the destination tax principle.5
Indeed, in their seminal paper, Mintz and Tulkens [29] show the absence of commodity tax competition under the destination principle in perfectly competitive markets. Haufler et al., [21] obtain the same result in imperfectly competitive markets where firms are perfectly mobile and sell their goods under monopolistic competition. The present paper confirms such a result in a similar monopolistic competition model. In contrast to Haufler et al. [21],
it gives a role to taxation as the provision of public goods, considers the taxation of all goods and does not use firms’ mobility as a factor that cancels fiscal externalities.
The choice of commodity taxes can readily be understood by reformulating the gov-ernment’s problem in the following way. Since C = C0/τ and G = C0(τ −1)/τ, we get
C+G = C0(n, n∗). As in [4], the aggregate of private and public consumptions aggregate
reduces to a simple expression that is independent from commodity taxes and eases our analysis. So, the government’s problem is simply to find the private and public consumption bundles that maximize each individual’s utility U(C, G) subject to the resource constraint
C+G=C0. This yields the standard Samuelson condition
UC0 /UG0 = 1 (16)
according to which the sum (over the unit mass consumers) of the marginal rate of substi-tution between public and private goods, UC0 /UG0 , equates the unit marginal rate of trans-formation between public and private goods. The optimal tax rate is given byτ−1 = G/C. A maximum is guaranteed under our standard concavity assumptions.
What is the impact of domestic regulation on domestic tax rates? It depends on income effects associated to public and private goods. Stronger regulation indeed decreases the num-ber of domestic firms n and therefore reduces the private consumption bundle C0(n, n∗) if
and only if∂lnC0/∂lnn >0. Suppose it is the case. Then, stronger regulation yields a
con-traction of the resource constraint C+G=C0(n, n∗). In consumer theory, this corresponds
to a fall in the income of a representative consumer whose income is given by C0(n, n∗) and
who faces identical prices for private and public consumption bundles. Then, suppose that the income effect on the demand of public goods is stronger than that on private goods. That is, the income expansion path or Engel function is biased toward public goods. Then a fall in resource or income must diminish the optimal consumption of public goods more than that of private goods. To achieve this outcome, the government will reduce the commodity tax rate. If the income effects go in opposite directions, the converse result obtains.
The impact of stronger domestic regulation on domestic tax rates can be formally ex-pressed by the following argument. The domestic government sets the commodity taxτ that maximizes the domestic utility level U[C0/τ, C0(τ−1)/τ)]. This yields the first order
con-dition, F ≡(d/dτ)U[C0/τ, C0(τ −1)/τ)] = 0, and the second order condition, dF/dτ <0.
The commodity tax falls with stronger regulation if it falls with a smaller number of domestic firms. This means that dτ /dn=−(dF/dn)/(dF/dτ)≥0. This condition is true and only if dτ /dn > 0 ⇐⇒ dF/dn ≥ 0. Some lines of computation show that the last condition is equivalent to
[UGG00 (τ −1)−UCC00 ]∂lnC0
∂lnn ≥0,
whereUCC00 and UGG00 are all negative. The last expression clearly depends on the response of domestic private consumption bundle C0 to n and on the concavity of the utility function
with respect to p rivate and public goods (CandG) and therefore on the degree of consumers’ satiety for those two kinds of goods. The above condition can be expressed in terms of the marginal rates of substitution, M RS ≡UC0 /UG0 , as
d lnM RS d lnC + d lnM RS d lnG ∂lnC0 ∂lnn ≥0
The term in parenthesis expresses the income effects on marginal rates of substitution. Indeed, take any ray,G/C =cst, on which private and public consumptions are proportionate (d lnC = d lnG). When income effects on public and private goods are the same, the marginal rate of substitution remains constant on the ray. Changes in regulation and thus in number of domestic firms have no impact on commodity tax rates. When income effects are stronger on the demand of public goods, marginal rates of substitution increase on this ray when consumptions rise proportionally so that the term in parenthesis becomes positive. As a result, a stronger regulation reduces the number of domestic firms and thus increases commodity taxes. This is what have informally explained in the previous paragraph.
We summarize our findings in the following proposition:
Proposition 2 Suppose that private consumption increases with the number of domestic
varieties (∂C0/∂n > 0). Then, a stronger product market regulation lowers commodity tax
rates if and only if income has a stronger effect on the demand of public goods than on that of private goods.
Empirically, the concavity of preferences, the marginal rates of substitution for private and public goods and the income effect on demand depend on the nature of each good. To our knowledge, the public economic literature has not identified clear and distinct patterns about those properties on private and public goods. The direction of commodity tax changes with respect to the number of firms and market deregulation is therefore an empirical issue that we will discuss in Section 4.
3.2
Regulatory competition
In this section, we discuss the governments’ interactions through their regulatory policies. From the previous section, we know that optimal commodity tax rates are independent instruments. Therefore, any change of domestic regulation implies a change of the foreign tax only from its impact on the number of local and foreign firms. For the sake of simplicity, we sterilize the effect of local regulation on local tax by assuming that the utility function of agents is log-linear, i.e., U(C, G) =αlnC+ (1−α) lnG,where α is the specific domestic preference for private consumption. This utility function allows us to discuss the regulatory competition stage. Under this assumption, the optimal commodity tax rate is equal to
τ0 = 1/α. The utility becomes V(C) = lnC0 + ln
αα(1−α)1−α
. Similarly, the foreign country sets a tax τ0∗ = 1/α∗.
We assume that domestic regulators follow an objective that mixes the consumers’ utility and their own rents. That is, their objective function is given by V(C) +Z(R) where Z
is an increasing and concave function of the consumption (rent) R that they grab from their regulatory activities. Rents are transfers from firms to regulators who have the same preferences as other consumers. For simplicity, we consider that regulators get a rent by imposing an extra input z on each firm’s fixed input f0. This takes place either in term
of additional employment z granted to the renters or in term of lump sum cash transfers equivalent to the amount W z. Since the input required for entry is equal to f =f0+z, by
(8), the extra input on fixed input is equal toz= 1/(σn)−f0. For the sake of simplicity and
realism, we assume that although the regulation applies to all firms in the country, regulators are able to grab a rent only in a limited number m of firms with which they interact more often or more effectively. Regulators therefore collect m times the nominal income W z per controlled firm. The total rent is equal to mzW and provides renters with a consumption level equal to R =mzC. In this setup, rents should be positive and the number of firm no smaller than the number of firms under controlm. Accordingly, we additionally require that 1/(f0σ)≥n≥m.
Domestic regulators therefore choose the regulatory setup that maximizes V(C) +Z(R) where R = mzC and C = C0(n, n∗)/τ0. This amounts to choose the number of domestic
firms n. The first order condition with respect ton can be written as [CV0 +RZ0]∂lnC0
∂lnn =−RZ
0∂lnz
∂lnn. (17)
Regulators balance the cost that this regulation imposes to society and to themselves (the left hand side) with their benefit from a stronger regulation (the right hand side). This cost increases with the elasticity of domestic consumption to domestic variety,∂lnC0/∂lnn. An
increase in domestic variety indeed increases the utility of both domestic consumers and regulators.
For analytical tractability, we set now Z(R) ≡ ρlnR where ρ is the weight regulators put on their own benefit. Domestic regulators therefore choose the regulatory setup that satisfies (17), which becomes
1 +ρ
ρ (1−f0σn)
∂lnC0
∂lnn = 1. (18)
Differentiating totally the first order condition (18) and using (15) we obtain d lnn d lnn∗ = n n∗ 1− f0σ 1−nf0σ Φ Φ0 −1 , (19)
Φ0(n/n∗) = 1 σ2(σ−1)(n/n ∗ )σ1−1 " 1 1 + (n/n∗)1σ #2 +ξ 1 1 +n/n∗ 2 .
When (19) is positive, domestic regulators increase n by reducing domestic regulation when foreign competitors do the same. At any equilibrium with symmetric regulator preferences we have ρ=ρ∗ and f0 =f0∗ and n/n
∗ = 1. Using (18), we get: d lnn d lnn∗ >0 ⇐⇒ ρ f0σ(1 +ρ) ≥ Φ 2(1) Φ0(1) = (2σ−1 +ξσ(σ−1))2 (σ−1) (1 +ξσ2(σ−1)). (20)
Let ˆρ be the solution of the last inequality when it binds. Then, the following proposition can be stated:
Proposition 3 Suppose symmetric regulator preferences and log linear utility functions. (i) For sufficiently low love for product diversity (ξ < −1/σ2(σ −1)), regulation policies
are strategic complement instruments for any regulator’s preference for rent ρ. (ii) For
large enough love for variety (ξ > −1/σ2(σ −1)) and low enough fixed input f0 (f0 <
(σ−1)/(σ(2σ−1)2)), regulations are also strategic complement instruments if regulators have sufficiently strong preferences for rents (ρ >ρˆ). (iii) Otherwise, regulation policies are strategic substitutes.
Proof. To prove (i) in Proposition 3, we sign the denominator (σ−1) (1 +ξσ2(σ−1)),
which is always negative when ξ < −1/σ2(σ−1). Hence, if ξ < −1/σ2(σ−1), then d lnn/d lnn∗ > 0. When instead ξ > −1/σ2(σ−1) (the case in (ii)) and moreover
f0 < (σ−1)/(σ(2σ−1) 2
), then d lnn/d lnn∗ > 0 if ρ > ρˆ. Otherwise (namely either if ξ > 1/σ2(σ−1) and f
0 < (σ−1)/(σ(2σ−1)2) and ρ < ρˆor if ξ > 1/σ2(σ−1) and
f0 >(σ−1)/(σ(2σ−1)2)) d lnn/d lnn∗ <0.
The intuition of Proposition 3 is as follows. Consider first the case where consumers do not put much value on product diversity. When the foreign country relaxes its regulation, foreign firms incur lower fixed input, reduce their production size, which puts an upward pressure on foreign wages and finally reduce foreign terms of trade. As a consequence, do-mestic wages fall in relative terms and dodo-mestic terms of trade becomes more favorable. This gives an incentive to domestic regulators to relax domestic regulation and to restore their purchasing power. By contrast, consider the case where consumers put a high value on product diversity. Regulators are harmed by their own regulation as the latter reduces domestic and global diversity. More precisely, when the foreign country relaxes its regu-latory pressure, it enhances the foreign and global product diversity. This mitigates the negative impact that domestic regulation has on domestic product diversity. As a result, a relaxation of foreign regulation entices domestic regulators to enhance their own regulatory constraints and rents. Regulatory decisions then become strategic substitutes. To sum up,
when consumers have low taste for product variety, regulation policies are strategic com-plements because regulations affect mainly the terms of trade. Conversely, when consumers have high taste for variety, regulation policies are strategic substitutes because they affect product diversity in their countries.
Before testing empirically the nature of regulatory competition, it is worth to note that existing empirical studies have already shown that consumer’s “love of variety” is significantly lower than what it is assumed in the Dixit-Stiglitz framework (see Hummels and Klenow [24] and Ardelan [5]).
4
Empirical evidence
4.1
Empirical strategy
In this section, we estimate the direction of the forces described in the theoretical setup, using a unique dataset that combines information on product market regulation, consumption taxation, institutional characteristics and social preferences for 21 OECD countries over the period 1990-2008.
We build an empirical model in which tax and regulation decisions are sequentially taken in a two-stage game. The link between taxation and regulation is determined by countries’ best reply functions obtained in the second stage game and solving equation (16). Our first empirical specification linearizes and generalizes those countries’ optimal tax rates:
τit= X j6=i aijτjt+bzit−2+c 0 Xit+di+et+uit, (21)
where i = 1, ..., I denotes the country, t = 1, ..., T the time-period. This specification does not assume the imposition of origin or destination taxation principle. We proxy the consump-tion tax rate, τ by the (implicit) average effective tax rate on consumption (CTAX), which measures consumption tax revenues as a percentage of total consumption (see Carey and Rabesona [10]). To focus on destination based commodity taxation, we include in theCTAX
definition only sales and value added taxes. In other words, we exclude excise taxes, customs and import duties, profits from fiscal monopolies and taxes in specific services, whose rev-enues may partly reflect the application of the origin principle to consumers’ transactions.6
Our primary measure of product market regulation, z is the Energy, Transport and Com-munication Regulation indicator (ETCR) (see Conway and Nicoletti [12]). We focus on the
6In contrast, existing studies adopt definitions of commodity taxes that (at least partly) reflect the
application of the origin principle. For instance, Egger et al. [16] computes the implicit average effective tax rate on consumption that accounts also for excise taxes, customs and import duties, profits from fiscal monopolies and taxes in specific services. Devereux et al [13] and Lockwood and Migali [27] focus on excise taxation.
“low-level” index that aggregates over a 0 to 6 scale qualitative and quantitative informa-tion on entry barriers (fixed costs) in seven non-manufacturing industries: electricity, gas, air passenger transport, rail transport, road freight, and postal services.7 The variables di
and etare country and time dummies, Xitis the vector of relevant characteristics of country
i at time t, including factors describing national consumption patterns, and finally uit is
the error term. Coefficients aij measure how the consumption tax in country i responds
to the consumption tax in each country j 6= i at time t. Our theoretical model predicts that strategic interactions in commodity taxation are absent. A significant zero value for
aij would provide evidence of the absence of strategic interactions and therefore confirm our
theoretical analysis as well as previous studies on the destination principle of commodity taxation (see Lockwood [26] for a synthesis). The coefficient b describes how government’s tax policy reacts to product market regulationzjt−2, wherej = 1, ..., I. The use of a two-year
lag8 reflects that implementation of the regulation policy is time consuming because of the
difficulties encountered in restructuring regulatory processes. Thus, current taxes are deter-mined by past regulation. According to our theoretical model, a significant negative value for b would indicate that the government uses commodity taxes to mitigate the negative impact of regulation on consumers’ welfare.
In the first stage of the model, regulators choose their regulatory pressure, anticipating and internalizing their effects on consumption taxes. Hence, from condition (17), regulator
i’s best reply to the regulation policies of her partner countries j = 1, ..., I is a function
zi =F(z−i, Yi), wherez−i = [z1, ..., zi−1, zi+1, ...zI] is the vector of regulation policies in each
partner country j 6= i and Yit is a vector of relevant country characteristics. The latter
include country specific factors that determine the national patterns of public and private consumption as well as regulator’s preferences. Our second empirical specification linearizes the function F(z−i, Yi) and generalizes it for T time periods as follows:
zit =
X
j6=i
αijzjt +β0Yit+γi+δt+µit, (22)
where γi and δt are country and time dummies and µit is the error term. The coefficients
αij measure howzi responds to zj. A significant positive (rep. negative) value forαij would
indicate that countryi’s regulation policy is a strategic complement (substitute) of country
j’s regulation.
7Conway and Nicoletti [12] distinguish the “low-level”ETCR index disaggregated by type of regulation
(entry barriers, public ownership, vertical integration) from the aggregate ETCR index that is a weighted average of the low level indicators.
8The idea that a product market reform takes two years to be implemented is consistent with descriptive
Degrees of freedom Equations (21) and (22) cannot be estimated because there are too many parameters. The usual approach is to aggregate the variables of partner countries as follows: τit=aτ−it+bzit−2+c 0 Xit+di+et+uit, (23) zit=αz−it+β0Yit+γi+δt+µit; (24) where τ−it = Pj6=iωijτjt and z−it = P
j6=iωijzjt are indices of trade partners’ tax and
regulation policies. Those indices are constructed with the nonnegative exogenous weights
ωij, normalized so that
P
j6=iωij = 1. The literature offers an extensive discussion about the
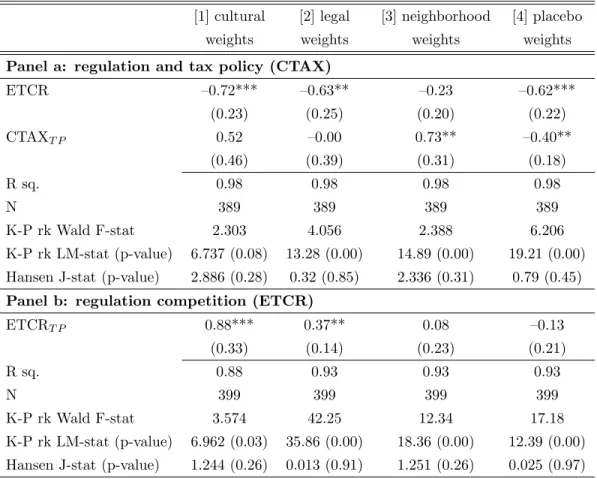
choice of the appropriate weights as they are likely to affect the magnitude of the coefficients of interest (see Brueckner, [8]). The idea is to construct z−i and τ−i by aggregating the
partner countries’ variables according to the relevance their interactions with country i. As for our theoretical model, we focus on the destination principle and exclude strategic interactions that stem from cross-border shopping. Thus, we construct weights ωij that
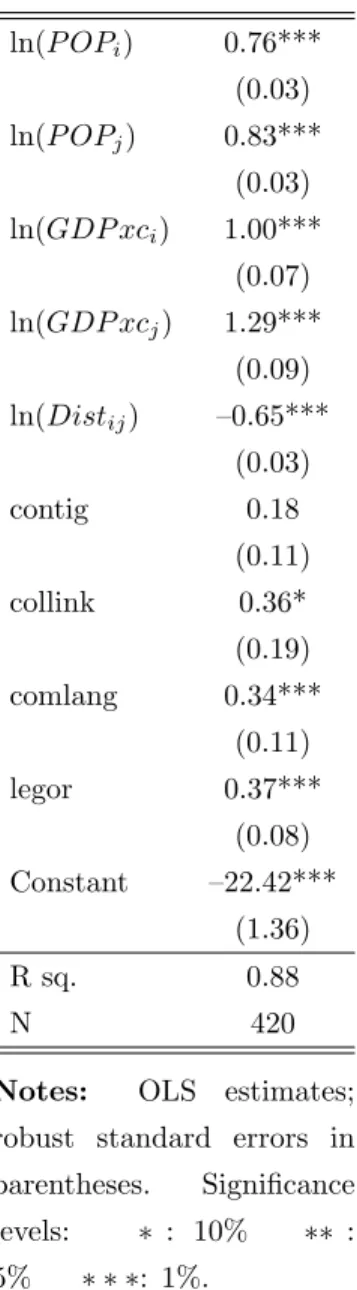
describe the countryi’s exogenous propensity to import from countryj and that are proxied by transportation costs between country i and country j. These transportation costs are derived from an augmented gravity equation that predicts domestic imports as a function of characteristics of countries such as size, and culture, as well as time invariant ‘dyadic’ characteristics such as legal origin, historical and cultural relationship between the importer and the exporter (Head, Mayer and Ries [23]. See also Appendix A for details). We use those exogenous weightsωij to compute the aggregate measure of product market regulation
and effective consumption tax rate in trade partner countries, ETCRT P and CTAXT P.9
Endogeneity As regulation and taxation levels in equations (23) and (24) are the outcome of spatially correlated policy decisions, the OLS estimates of the coefficients a, b and α are subject to endogeneity issues. A first problem of simultaneity stems from the presence of strategic interactions between countries. A second issue of reverse causality is present in equation (23) since regulators might set their regulatory pressure set as a function of prevailing taxes rather than governments set their taxes as a function of the regulatory environments as it is assumed in our study. Finally, there is an issue of omitted variable bias because τit,zit,τ−it and z−it may be affected by common unobserved shocks. In our context
for instance, we have ‘spatial error dependence’ because the error terms in (23) and (24) may include omitted country characteristics that are spatially correlated. As Brueckner [8]
9Our approach differs from the existing empirical literature on commodity tax competition. While we
focus on destination-based commodity taxation, previous papers highlight strategic interaction between governments in origin-based commodity taxation and use contiguity weights (see Lockwood and Migali [27], Devereux, Lockwood and Redoano [13]).
notes, ignoring spatial dependence implies that the estimated coefficients may provide false evidence of strategic interactions.
We address the endogeneity issues by means of an instrumental variables (IV) estimator. We use regulator’s preferences as an instrument for regulation and construct two empirical proxies based on two indicators collected in the World Value Survey (WVS) and European
Value Study (EVS).10 As in Aghion et al. [1], the first indicator measures the ’interpersonal
distrust’ as the percentage of respondents who answer ‘Can’t be too careful’ to the question:
‘Generally speaking, would you say that most people can be trusted or that you need to be very
careful in dealing with people?’ (DisTrust). A stronger feeling of low social trustworthiness
increases each citizen’s demand for local regulation in the hope to mitigate the negative effects associated with untrustworthy enviromnents. Following Inglehart [25], the second indicator measures the ‘materialist attitude’ as the percentage of individuals who respond
’maintaining order in nation’ to the question: ‘There is a lot of talk these days about what
the aims of this country should be for the next ten years, ..., If you had to choose, which
of the things on this card would you say is most important?’ (OrderNation). The social
values that emphasize the need for economic and physical security relatively to economic freedom and autonomy are also associated with a demand for stronger local regulation be-cause it is likely to enhance the level of order and security. As a result, we expect DisTrust
and OrderNation to be strongly correlated with the term zi in equation (23). Since both
DisTrust and OrderNation are pure belief-based measures, they are not directly associated
with respondent’s morality, altruism or risk aversion (see Sapienza et al. [34]). For this reason, we do not expect any direct correlation with τi, which implies that they are valid
instruments for zi in equation (23). Finally, we use the weightsωij to aggregate the level of
distrust and materialism across each country’s trade partners (DisTrustT P,OrderNationT P),
and use them as proxies of regulator’s preferences in trade partners. Since the transmission mechanism from social attitudes to regulation works only at the local level, we do not expect any direct correlation ofDisTrustT P andOrderNationT P withzi, which implies they provide
valid instruments for z−i in equation (24) as well.
We construct two instruments for the foreign commodity taxes, τ−i, by exploiting the
exogenous variations associated with two commodity tax reforms that occurred during the sample period.11 Our first instrument is the share of trade partners that switched from
10Regulator’s preferences determine the level of local regulation. We expect no correlation of those
pref-erences with local commodity tax policies and with foreign regulation. Let ri be the proxy of regulator’s
preferences in countryi, then we haveE[rizi]6= 0 whileE[riτi] = 0 andE[r−izi] = 0. These conditions hold
in our model with log-linear utility functions.
11For each reform, we construct a dummy variable that equals one if a country adopts the reform and
switches to the new system, and zero otherwise. We then use the weights ω to obtain the share of trade partners that implement the reforms. Variations result from the switch of countries between the tax systems during the sample period, and from the fact that each country has a different number of trading partners
a consumption-based to a VAT-based system of commodity taxation during the sample period (VATT P). VATT P is positively correlated with τ−i since the adoption of a VAT
system of commodity taxation enhances tax compliance and avoids double marginalization (OECD Consumption Tax Trends [31]). Since a country does not tax its exports under the destination principle, its commodity tax revenues cannot be affected by the VAT reforms introduced by its trading partners. For this reason, VATT P is not directly correlated with
τi, which implies thatVATT P is a valid instrument for foreign commodity taxes in equation
(23). Our second instrument for foreign commodity taxes,τ−i, is the share of each country’s
EU trade partners that have reformed the VAT cross-border transactions (EUVAT93T P).
In 1993, EU countries agreed to adopt a VAT system that applies the destination principle to firm transactions and the origin principle to consumers’ transactions. Together with the abolition of the border controls for intra-EU trade due to the creation of the Single Market, the differential VAT treatment for consumer and firm transactions has created new opportunities for VAT evasion in each country (see Nam et al. [30], ECSC [15]).12 For this
reason, we expect that a higher share of each country’s trade partners that implemented the EU VAT reform (i.e. a higher EUVAT93) is associated with lower trade partners’ average effective consumption tax rate (i.e. a lowerτ−i). Note that, the fact that the reform
consists of the application of the origin principle to consumer transactions may cast some doubts on the validity of our identification strategy. Cross-border shopping is known to link domestic tax reforms to the neighboring countries’ tax revenues (see e.g. Lockwood and Migali [27]). However, the validity of the instrument is guaranteed by the fact that we have isolated the goods sold under the destination principle. Indeed, our definition of commodity taxation excludes the tax revenues that are associated with the origin principle and our choice of the weighting matrix ωij minimizes cross-border shopping effects. Under
the destination principle, EUVAT93T P does not have any direct effect on τi, which implies
that EUVAT93T P is a valid instrument for trade partners’ commodity taxes in equation
(23).
To sum up, we estimate equations (23) and (24) with instrumental variables. The set of instruments described above are used predict the endogenous regressors in (23) and (24). The predicted values zbit−2, τb−it and bz−it are then used in the second stage of the regression
that switch tax system.
12In fact, the need for EU wide audits under the transitional VAT system is much greater than before 1993,
when cross-border transactions were still interfered with border controls. VAT control is still a national task in the EU, which creates a number of issues. First, insufficient financial resources are devoted by the individ-ual countries for VAT audit. Second, EU Member States maintained their nation-specific VAT control and collection methodology in spite of the creation of the internal market, which may create coordination failures between countries. Finally, tasks regarding the administration and control of VAT matters are increasingly transferred to local and regional authorities. This development could more easily lead to permitting tax evasion and fraud on the local level (see Nam et al. [30] for further details).
equations (23) and (24) to obtain consistent estimates baIV,
bbIV and b
αIV, respectively.
4.2
Data and descriptive statistics
We exploit a unique data set that combines information about product market regulation, consumption taxation, institutional characteristics and social preferences for 21 OECD coun-tries over the period 1990-2008. The councoun-tries we consider are: Australia, Austria, Belgium, Canada, Denmark, Finland, France, Germany, Greece, Ireland, Italy, Japan, Netherlands, Norway, New Zealand, Portugal, Spain, Sweden, Switzerland, United Kingdom and the United States.13
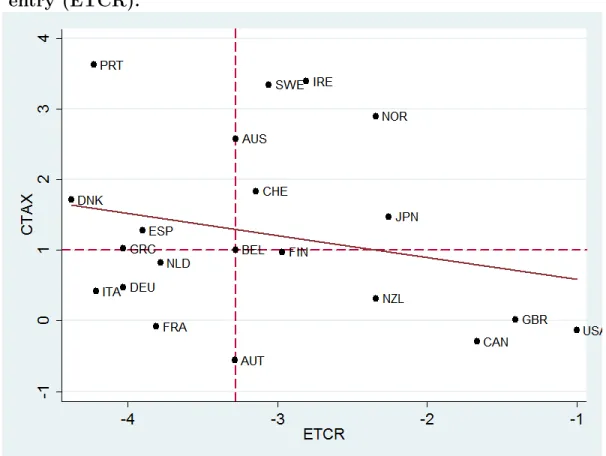
Figure 1 plots each country’s effective commodity tax rate, CTAX, against the indicator of entry barriers, ETCR. Data are taken in differences between the final period (i.e. 2004-2008) and the initial period (i.e. 1990-94). Countries present negative variations in their
ETCRindicators during the sample period. The figure suggests to distinguish between three groups of low, intermediate and high reformers. The low reformers include the countries that experienced a reduction ofETCR by less than 2 points (i.e. USA, UK and Canada). Those countries supported important deregulation waves before the 1990s and have entered the sample period with a low level of product market regulation.14 The intermediate
reform-ers include the countries that present a deregulation pace very close to the OECD median. These countries generally started their reform efforts in the mid-eighties (i.e. Sweden, Fin-land, Norway and Australia) or after 1995 (i.e. Austria, Belgium, Switzerland). The high reformers incur a fall in ETCR by more than 3.5 points. These are EU countries that were heavily regulated until 1995 and accelerated their reforms after the EU deregulation directives (Conway and Nicoletti, [12]). The figure displays a negative correlation between changes in taxes and product market regulation. The high reformers experienced an increase in average effective tax rates during the sample period, with the only exception of France. Conversely, none of the low reformers increased average effective tax rates. Spain, Portugal, Japan, and more recently, Switzerland and Australia, have risen their average effective tax rates, which also reflects the introduction and consolidation of a VAT system (see OECD [31]).
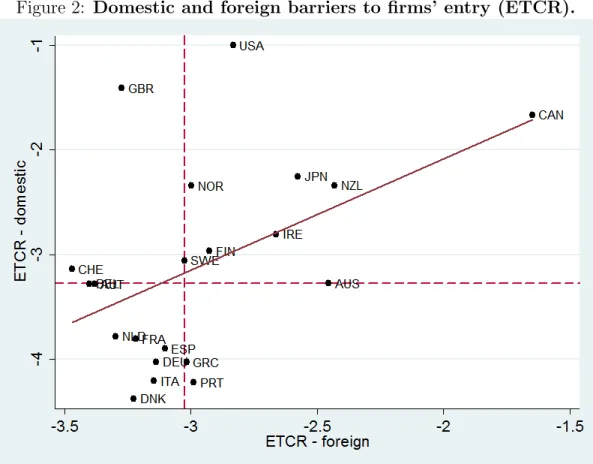
Figure 2 shows the correlation between the average regulation levels of countries and their trading partners, respectively ETCR and ETCRT P. Again, the figure presents the differences between the levels in the periods 2004-08 and 1990-94. Trading partners are weighted according to the weights ωij described in the previous section. Most countries are
13In Appendix A, we provide more details about our data sources and the construction of our variables of
interest. We further describe additional variables that we used as controls and/or exploit in our robustness checks.
14The USA started its reform process early in the mid-seventies and carried most of its reforms in the
included in the top-right and the bottom-left quadrants of the figure. This indicates that, on average, the trading partners of high reformers are themselves high reformers while trading partners of low reformers are low reformers. This is consistent with the view that trade partners are likely to deregulate in response to each others’ deregulation waves. That is, regulation policies are likely to be strategic complements.
In this empirical analysis, we are able to construct consistent time-varying measures of preferences for regulation.15 This contrasts with previous works on the impact of trust
and social norms on institutions that exploit only cross-country variation (see Algan and Cahuc [3] for a notable exception). Figure 3 plots the correlation between OrderNation
and DisTrust, and shows important variations of the two variables over time. Trust and
preference for order in nation in fact evolve as a consequence of exogenous shocks or feedback effects from past policies/reforms (Aghion et al. [1]; Algan and Cahuc [2]; Inglehart [25]). We observe the change in social preferences by taking the two variables in differences between the final period’s level (i.e., 2004-08) and the initial period’s level (i.e., 1990-94). Our sample covers a sufficiently long time interval (1990-2008) to include several political, social and economic changes that may alter those indicators of social preferences.
We clearly distinguish four groups of countries. The first group includes Finland, Bel-gium and Sweden that in 1990-2008 experienced increasing distrust (particularly BelBel-gium and Finland) and demanded more security due to social, political and economic unrest.16
The second group includes Anglo-Saxon countries (USA, UK, Canada, Ireland, New Zealand and Australia) and Japan. These countries did not see a relevant rise in the demand for order in nation, probably due to their traditionally liberal views. However they experienced a significant rise of social distrust, probably created by the rising inequalities and the fears of terrorism. Two relevant exceptions in the group of Anglo-Saxon countries are New Zealand and Australia, which in the last two decades experienced increasing levels of trust mostly related to the successful political turnover and structural reforms implemented during the 1990s.17 The third group includes Continental and Southern-EU countries (France, Austria,
15WVS and EVS data consist of fully comparable survey waves. We use the last four waves of the WVS and
three waves of the EVS and take country averages of the two indicators over the periods 1990-94, 1995-99, 2000-04 and 2005-08. Under the assumption thatOrderNation andDisTrust have a persistent component that makes their evolution over time very slow, each wave provides the description of social attitudes in each country over the covered period. In other words, it can be assumed that social preferences for regulation change between two periods while remain constant within each period.
16In Finland the rise of social equality movements and the constrast with the Swedish minorities by the
end of 1980s increased social unrest. Furthermore, the collapse of the Soviet Union and the ensuing great economic depression of the first half of the 1990s increased the demand for social, political and economic stabilization. Similarly, in Belgium the gradual concentration of the political power around the need to represent the main cultural communities increased political and social polarization and the needs for political stabilization.
Germany, Italy, Spain, Greece, and Portugal). In the last twenty years these countries expe-rienced a resurgence of distrust and nationalism, while their mediocre economic performance boosted public support for freedom and autonomy in the private sector.18 The fourth group includes Denmark, Netherlands and Norway that during the period 1990-2008 experienced both decreasing preference for order in nation and increasing trust. These countries in the last two decades were characterized by an increasing perception of the need to reform, and the success of the welfare and workfare reforms inspired to flexicurity principles (Algan and Cahuc [2]). Finally DisTrust and OrderNation have been relatively stable in Switzerland over the sample period.
Finally, it is important to notice thatETCRis strongly correlated, at the 1% significance level with our proxies for regulator’s preferences DisTrust and OrderNation. This correla-tion is explained by Aghion et al. [1], and Djankov et al. [14]: high-trusting and ‘order-free’ nations tend to prefer very few controls on opening a business, whereas low-trusting and se-cured countries, present higher preferences for regulations and tend to impose heavy barriers to entry.19
4.3
Results
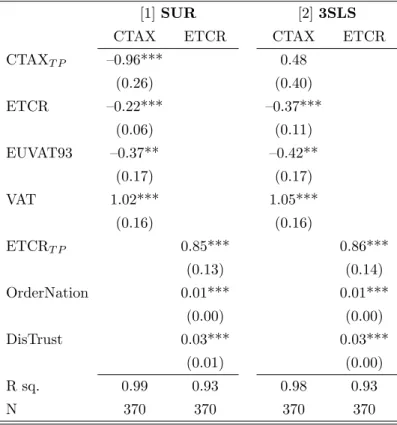
Table 1 reports estimates for the commodity tax response function (23). OLS estimates in column [1] indicate a negative impact ofCTAXT P onCTAX, significant at the 5% level and
a significant negative impact of ETCR on CTAXT P. The former result is counterintuitive
as it suggests that commodity taxes are strategic substitutes under the destination princi-ple. However, as explained before, these OLS estimates are biased and inconsistent due to endogeneity. More specifically, spatial error dependance is a concern for CTAXT P as
spa-tially correlated unobserved factors may exist and may provide a false evidence of strategic interaction in commodity taxation (Brueckner [8]).
In columns [2] and [3] we deal with these problems and perform two stage least squares
inertia and economic depression. The increase in trust is probably related to the election of a new liberal government which launched successful waves of liberalizations and structural reforms. A somehow similar path was experienced by New Zealand where up to the early 1990s national governments carried out reforms that seemed to fail to reflect the mood of the electorate. The rising trust in the 2000s seems to reflect the success of the referendum to change the electoral system to mixed proportional representation, which led to an effective change in political representation in the country.
18It is generally acknowledged that the ‘shock’ that triggered the resurgence of distrust in these countries
during the 90s has been the fall of the communist regime in Russia and East European countries. Fur-thermore, the fall of communism and the war in ex-Yugoslavia did produce a fealing of fear against rise of immigration. These have been often perceived as ‘dangerous’ to national communities and led to the election of governments supported by extreme right and nationalist parties (see European Commission [9]).
19Aghion et al. [1] notice that the relationship goes both directions, i.e. distrust and social disorder create
(2SLS) and Hansen’s Generalized Method of Moment (GMM), using OrderNation,DisTrust
(in five year lag),VATT P andEUVAT93T P as instruments forETCRandCTAX.20The tests
displayed in Table 1 confirm that instruments are correlated with the endogenous regressors, they explain a relevant portion of their variance in the first stage regression and they provide valid exclusion restrictions in the second stage.21 The Pagan-Hall and Wooldridge tests reject
at the 1% level the null hypotheses of homoskedasticity and absence of serial correlation in the idiosyncratic errors. Consequently, we compute Heteroskedasticity and Autocorrelation Consistent (HAC) standard errors in columns [2] and [3]. Finally, the RESET test confirms that there are no problems of omitted variables or misspecified functional form. Compared to OLS estimates, the negative significant coefficient of CTAXT P turns to a non-significant
value. This indicates that strategic interactions in commodity taxation are not present once endogeneity issues are considered. Up to our knowledge, this is the first paper that shows the absence of commodity tax interactions under the destination principle. As mentioned earlier, this result stems from the construction of our tax indicator, which includes only goods subject to sales and consumption taxes, and the choice of the weighting matrix that minimizes cross-border shopping.
The effects of regulation on commodity taxes is also important to notice. In the 2SLS and GMM estimations, the coefficient of ETCR is negative and significant at the 1% level. This suggests that a one point increase in ETCR produces about a 0.5 percentage points decrease in the effective tax rate CTAX.
Finally, tax reforms are also shown to impact the commodity taxes. Indeed, the positive significant coefficient of VAT indicates that the adoption of a value-added based system of
20Since there arel= 4 instruments fork= 2 endogenous regressors, the equation is overidentified. In this
case, the 2SLS and GMM methods yield different results. In fact, the 2SLS method collapses the information contained in the l instruments to derive onlykmoment conditions. The GMM estimator solves a different optimization problem, by deriving l moment conditions and using them to derive the optimal weighting matrix. As a result, the GMM estimator is more efficient than the 2SLS estimator. However, the highest efficiency of GMM comes at a price in terms of estimates’ precision in the presence of small sample size. (Hansen [19]) For this reason we report both estimates and give an overview of results to account for the potential bias affecting each estimator. Note finally that the 2SLS and GMM methods assign all instruments to all endogenous regressors, leaving each instrument free to ‘bind’ in the relative first-stage regression. In the sensitivity analysis we assign each instrument directly to the ‘a priori’ relevant endogenous regressor (i.e. VATT P andEUVAT93T P toCTAXT P andOrderNation,DisTrust toETCR), by estimating the entire
system of equations by three stages-least-squares (3SLS).
21The low Kleibergen-Paap rk Wald F-statistics seems to suggest instruments are weak. However this is
driven by the fact that we take five lags ofOrderNation andDisTrust. Five years lags minimize endogeneity issues, but also impose a cost in terms of instruments’ explanatory power in the first stage. Overall, we decide to keep this specification for two reasons. First, the Kleibergen-Paap rk LM statistic rejects at the 1% level the null hypothesis that the system is underidentified in the first stage; second the Anderson-Rubin statistic, which is robust to the presence of weak instruments, confirms that endogenous regressors are jointly significant in the second stage.
commodity taxation entails an increase of the effective tax rate up to 0.8 percentage points while the negative significant coefficient of EUVAT93 suggests that the EU VAT reform reduces the average effective consumption tax rate by 0.5 percentage points. The former finding is consistent with the view that the switch from a sales-based to a value added based system of commodity taxation increases tax collection, and therefore the effective tax rate. The latter suggests that the 1993 reform reduced VAT efficiency in the EU, for instance by favouring tax avoidance practices (see OECD [31] for a review).
Table 2 reports the estimates of the regulation policy responses, ETCR, to partners’ regulatory pressures, ETCRT P, as it is modeled in (24). In column [1] we present OLS es-timates, which assume exogenous ETCRT P. However, as explained above, there are sound
theoretical reasons to think that ETCRT P is endogenous. Thus, in columns [2] and [3] we
also perform 2SLS and GMM, using five years lags ofOrderNationT P, andDisTrustT P as
in-struments for ETCRT P. Econometric tests confirm that instruments are strongly correlated
with the endogenous regressors, explain a large share of their variance in the first stage and provide valid exclusion restrictions in the second stage, which leads to a robust inference. As in the previous case, the Pagan-Hall and Wooldridge tests reject at the 1% level the null hypotheses of homoskedasticity and absence of serial correlation in the idiosyncratic errors. Consequently, in columns [2] and [3] we report HAC standard errors. Also in this case the RESET test confirms that we do not have problems of omitted variables or misspecified functional form. The coefficients in Table 2 indicate that regulation policies are strategic complements: a one point increase of ETCRT P entails a rise of about 0.5 points in ETCR.
The coefficient of DisTrust takes the expected (positive) sign. It indicates that a 10 per-centage points increase in the share of people who demands more regulation in the country (either to enhance security or enjoy more rents) produces a 0.3 points increase in ET CR.
It is important to clarify the economic magnitude of the forces just described because the ETCR measure of product market regulation is a synthetic index whose measurement is not straightforward. We interpret our results referring to a more intuitive measure of product market regulation, i.e., the number of days that are necessary to start up a new business (StartUp). This is one of the measures proposed by Djankov et al. [14], used by the recent literature on determinants and economic impacts of product market regulation (e.g. Aghion et al. [1]). Over the period 2003-2008, for which both indicators are available, the standard deviations ofETCR andStartUp are respectively equal to 0.56 (over a scale of 0 to 6) and 20 (days) while the two indicators are strongly correlated. Thus, the number of days corresponding to the standard deviation ofETCR over the period 1990-2008 (i.e., 1.49) can be approximated by 1.49∗20/0.56≈ 53 (days).22 This is about one third of the reduction
22The correlation coefficient between the two indicators is 0.49, significant at the 1% level. It should be
noted however that the two measures are not fully comparable. In fact the time-to-startup indicator refers to the whole economy while the ETCR indicator refers only to seven non-manufacturing industries. For

![Table 1: Commodity tax response [1] OLS [2] 2SLS [3] GMM CTAX T P –0.84** 0.72 0.73 (0.33) (1.19) (1.18) ETCR –0.14** –0.53*** –0.52*** (0.06) (0.20) (0.20) VAT 0.78*** 0.73*** 0.74*** (0.20) (0.26) (0.26) EUVAT93 –0.28 –0.38* –0.39* (0.18) (0.22) (0.21) R](https://thumb-us.123doks.com/thumbv2/123dok_us/198865.2518248/37.918.193.715.115.519/table-commodity-response-ols-sls-ctax-etcr-euvat.webp)
![Table 2: Regulation response [1] OLS [2] 2SLS [3] GMM ETCR T P 0.55*** 0.48*** 0.46*** (0.12) (0.18) (0.16) OrderNation 0.01 0.01 0.01 (0.01) (0.01) (0.01) DisTrust 0.03*** 0.03*** 0.03*** (0.01) (0.01) (0.01) R sq](https://thumb-us.123doks.com/thumbv2/123dok_us/198865.2518248/38.918.234.677.335.670/table-regulation-response-ols-sls-etcr-ordernation-distrust.webp)