What Does Initial Farm Size Imply About
Growth and Diversification?
Almuhanad Melhim, Erik J. O’Donoghue, and C. Richard Shumway
Recent consolidation in agriculture has shifted production toward fewer but larger farms, reshaping business relationships between farmers, processors, input suppliers, and local communities. We analyze growth and diversification of U.S. corn, wheat, apple, and beef farms by examining longitudinal changes in 10 size cohorts through three successive cen-suses. We fail to reject Gibrat’s law in apple and wheat industries and the mean reversion hypothesis in beef and corn industries. Apple and wheat farms diversify over time. The findings suggest that scale economies diminish for large farms across all four industries and scope economies dominate scale economies for large apple and wheat farms.
Key Words: diversification, firm growth, Gibrat’s law, longitudinal data, scale economies,
scope economies JEL Classification: Q12
Scale and scope economies at the farm level are among the important driving forces behind the rapid structural change in U.S. agricultural in-dustries. Agricultural production is becoming dominated by large, highly integrated farms that adopt new technologies and business practices to exploit these economies (Hoppe et al.). One relevant public concern is just how far economies of scale and/or scope will push
this sector. If the largest food production firms experience economies of scale and scope and if those economies do not dissipate, we would expect movement toward smaller and smaller numbers of firms. If that movement were to continue unabated, it is conceivable that the perfectly competitive nature of some agricul-tural production industries could eventually disappear, resulting in a potential threat to the long-term economic viability of the family farm. Under this setting, regulatory oversight may be required to ensure a competitive outcome with few farms. The agricultural production sector is currently so far from consolidating ownership under a small number of firms that competitive production is still regarded as dominant in ag-riculture for all but a few niche markets.
Four major agricultural industries are cho-sen for the purpose of studying scale and scope economies. Corn, wheat, apple, and beef in-dustries represent major sources of U.S. agri-cultural production. Corn and wheat are the two largest U.S. grain crops, both in terms of value of production and planted acreage. Respectively, Almuhanad Melhim is a graduate research assistant in
the School of Economic Sciences, Washington State University, Pullman, WA. Erik J. O’Donoghue is an economist with the Economic Research Service, U.S. Department of Agriculture, Washington, DC. C. Richard Shumway is professor, School of Economic Sciences, Washington State University, Pullman, WA. The authors gratefully acknowledge the significant contributions of the anonymous reviewers to the qual-ity of this paper. This project was supported by the Washington Agricultural Research Center, the USDA Cooperative State Research, Education and Extension Service Hatch grant WPN000275, and the USDA Economic Research Service. The views expressed are those of the authors and do not necessarily corre-spond to the views or policies of ERS and the U.S. Department of Agriculture.
they accounted for 75% and 17% of total value of grain production and 54% and 36% of total area planted to grains in 2006. Apples rank second after grapes in total value of fruit pro-duction and planted fruit acreage, accounting for 21% of the value of total fruit production and 18% of total area planted to fruit in 2006. Beef represents the largest segment of the U.S. live-stock sector. Sale of cattle and calves accounted for 73% of total value of production of meat animals in 2006 (USDA 2007).
Between 1987 and 2002, the total number of farms in each of these industries fell while the number of farms in the largest census farm category grew (see Figure 1). The relative growth in number of larger farms was much greater in the corn and wheat industries than in the apple and beef industries. Total production rose in the corn and beef industries while pro-duction dropped in the wheat and apple indus-tries. However, the drop in wheat production was less than the relative decline in total number of farms in the wheat industry so this industry also became more concentrated. Production concentration was greater in the corn and beef industries than in the wheat industry, and the evidence of increased concentration in the ap-ple industry was mixed.
The rapid changes in these industries sug-gest several important empirical research ques-tions and testable hypotheses with regard to firm and industry growth that could have implications for public and private
decision-making. For example, profit-maximizing, risk-neutral, price-taking firms are expected to grow if they can exploit scale and/or scope economies. Scale economies exist if the firm experiences decreasing average cost as out-put increases, while scope economies exist if the average total cost of production decreases as a result of increasing the number of goods produced.
While there is considerable evidence that scale and scope economies apply generally to agricultural industries, whether they apply to the largest farms is an open empirical question. The empirical evidence is inconclusive and varies with industry of interest and approach used to examine the evidence (e.g., Ben-Belhassen and Womack; Helmers, Shaik, and Atwood; Just, Mitra, and Netanyahu; Mafoua; Morrison-Paul; Morrison-Paul, Nehring, and Banker; Mulik, Taylor, and Koo; Ollinger, MacDonald, and Madison). For example, even two very
re-cent studies (Melhim, O’Donoghue, and
Shumway; Mosheim and Lovell) found varied evidence about scale economies in the dairy industry. The former found evidence of non-diminishing scale economies for the largest decile of dairy farms while the latter found evidence of eventual decreasing returns to scale for herds in excess of 2,000 cows, but only when they did not account for technical and allocative efficiency. When technical and allo-cative efficiency were accounted for, they also found evidence of increasing returns to scale
Figure 1. Percentage Change in the Number of all Farms, Number of Large Census Farms, and
Total Production (1987–2002)
across all herd sizes examined. Our research expands the analysis of scale and scope econ-omies in the context of industry consolidation for the corn, wheat, apple, and beef industries. The purpose of this paper is to learn about growth and diversification trends within size cohorts for the four industries and compare them to those of the dairy industry. It contrib-utes essential missing links in understanding how structural change is occurring at the firm level in these industries. Although it does not address causation, the paper creates an informational base that is particularly relevant for econometric analysis of causal factors. For example, if evidence of scale diseconomies were found in an industry, it would suggest that other forces, for example, human capital, business/family life cycle, value chain, and government policies (Gray and Boehlje; Hoppe et al.), must be operating to drive consolidation. We extend the analysis used by Melhim, O’Donoghue, and Shumway for the dairy in-dustry to determine whether cost economies are evident in the U.S. corn, wheat, apple, and beef industries. We seek answers to three research questions that apply to incumbents in all four industries. First, do the largest farms grow at least as rapidly as medium-sized farms? If they grow less rapidly, it would suggest that con-vergence toward an equilibrium size is occur-ring even if that equilibrium size has not been observed yet. On the other hand, if the largest farms grow at least as fast as the medium-sized ones, we must conclude that farms are not yet approaching an equilibrium size. Second, do farms become more diversified over time? If they do, it would provide inferential evidence
of increasing economies of scope.1 Third, if
they do become more diversified over time, do the largest farms diversify more rapidly than medium-sized farms? If they diversify less rapidly, it would suggest that a change in the relative importance of scale and scope econo-mies could cause medium-sized farms to grow
the fastest in the future even if the largest farms currently grow most rapidly. If, however, the answer to all three questions is yes, then even without further analysis, we would conclude that the largest farms are expected to continue to grow the most rapidly, and no equilibrium farm size is currently in sight. That would im-ply that major structural changes will likely continue in these industries, at least in the near future.
To preview our findings, growth rates in each of these four industries declined with farm size. This finding is in marked contrast to the dairy industry in which the largest farms grew faster than medium-sized farms over the same period of time. The wheat and ap-ple industries are becoming more diversified while the corn and beef industries are becom-ing less diversified. Within the wheat and ap-ple industries, diversification increased faster for medium-sized farms than for the largest farms. Inferentially, these findings suggest that scale economies diminish for large farms across all four industries and, where scope economies exist, they also diminish for large farms.
Method of Analysis
We apply both inferential and statistical meth-ods to answer the three research questions. We partition initial farms into 10 nonoverlapping size cohorts in 1992 based on the magnitude of agricultural sales (exclusive of government payments), with an equal number of farms in
each cohort.2 We track incumbent farms in
the 10 initial size cohorts through two suc-cessive censuses, and determine differences in growth rates, levels of diversification, and industry exit rates. We also track new entrants to determine their similarity to incumbent firms.
We address the first question about whether farms are converging to an equilibrium size by examining the relationship between initial cohort size and the mean growth rate of each incumbent
1We ascribe increased diversification as inferential
evidence of scope economies. While risk aversion could also give rise to increased diversification, deter-mining evidence of risk adverse behavior in the census data are beyond the scope of this study.
2The 10% of farms with the lowest agricultural
sales in 1992 were assigned to Cohort 1 and the 10% with the largest agricultural sales to Cohort 10.
cohort. We conduct our analysis for the 5-year period between the 1992 and 1997 censuses and for the 10-year period between the 1992 and 2002
censuses.3 This relationship provides inferential
evidence concerning whether farms are con-verging to an equilibrium size. Positive growth of a cohort’s mean size indicates that, on average, farms in the cohort are likely operating under increasing returns on scale and/or scope. Farms in cohorts that are growing the most rapidly are likely to be among the most effective in reaping these economies.
We also examine the first question statisti-cally by testing whether incumbent farms have grown in accordance with Gibrat’s law (Sutton), the mean reversion hypothesis (De Wit), or a growth hypothesis consistent with evidence from the dairy industry (Melhim, O’Donoghue, and Shumway). Under Gibrat’s law, firms follow a random walk growth pat-tern. No convergence to steady-state equilib-rium size occurs. Under mean reversion, larger firms grow relatively slower than smaller firms, implying that firms converge to a stable steady-state equilibrium. If, however, firms in these industries grow in ways similar to the pattern exhibited by the dairy industry (Melhim, O’Donoghue, and Shumway), larger farms grow relatively faster than smaller farms. This would imply that farms may approach an equilibrium size, but unlike mean reversion, it would not be to a steady-state equilibrium.
To test these mutually exclusive hypotheses, two linear regressions are estimated between annual growth rates and initial farm sizes. One regression uses annual growth rates for the 1992–1997 period and the other uses an-nual growth rates for the 1992–2002 pe-riod. The least squares model is specified as follows:
(1)
yikt5b0t1b1trik1eikt,i51,. . .,Nk,
t55-year or 10-year,
k5corn, wheat, beef, and apple
whereyikt is the annual compound growth rate
of the ith farm in the kth industry between
the 1992 census and either the 1997 or 2002
census,rikis the initial size of farm ifrom
in-dustrykin the 1992 census, andei is
indepen-dently and identically distributed white noise. Separate equations are estimated for each commodity.
The hypothesis tests are equivalent to a
t-test of the significance ofb1t. If not
statisti-cally significantly different from zero, the null hypothesis that cohorts grow in accordance with Gibrat’s law is supported. A statistically significant negative coefficient provides sup-port for the mean reversion hypothesis, while a statistically significant positive coefficient supports the hypothesis that cost economies are sufficiently persistent that larger farms grow relatively faster than smaller farms.
To address the questions about increasing diversification, we separate farms in each cen-sus into five sales categories. These categories differ by the percentage of the farm’s total ag-ricultural sales in its primary commodity sales
category.4For corn and wheat farms, the sales
classification is based on sales of grain, oilseeds, dry beans, and dry peas; for apple farms, it is based on sales of fruit, tree nuts, and berries; and for beef farms, it is based on sales of cattle and
calves.5 The five sales categories are 90% or
greater, 75–89.9%, 50–74.9%, 25–49.9%, and
3Since we are interested in the effect of initial firm
size on growth and have data from three censuses, we examine growth rates for both a 5-year and a 10-year period. We do not explicitly focus on growth rate during the second 5-year period because firm sizes for incumbent cohorts overlap in the 1997 census. How-ever, the growth rate of firms in each incumbent cohort during the second 5-year period can be inferred by contrasting growth in the first 5-year period with the 10-year period.
4One limitation of this approach is that, when
making comparisons over time, we do not distinguish between actual diversification due to changes in pro-duction decisions and apparent diversification due to changes in relative prices of commodities. There were significant changes in relative prices over this period. For example, the relative price of grain to cattle was 24% higher in 1997 than in 1992. By 2002, it dropped to just 10% higher. Our assessment of the magnitude of diversification for beef in 1997 will therefore be biased upward relative to diversification for wheat and corn, particularly in 1997. However, it turns out that our qualitative conclusions are unaffected.
5Since the Census survey did not record revenues
for our four individual commodities, we used the closest sale groups as proxies.
less than 25% of sales from the primary com-modity sales category of total agricultural sales, exclusive of any government payments.
We calculate a weighted measure of spe-cialization (the converse of diversification) for
each cohort k by multiplying the share of the
cohort’s farms in each sales categorySikby the
midpoint of the sales percentile range Ri and
then sum across sales categoriesi.
(2) Dk5
Xn
i51
SikRi
This measure represents an approximation to the cohort’s weighted share of total agricultural income from sales of the primary commodity
group.6 Higher percentage values indicate
higher dependence on the primary commodity group’s sales, greater output specialization, and lower output diversification.
Data
We use longitudinal data from the Census of Agriculture in 1992, 1997, and 2002. Based on the Census Farm Number (CFN) and Personal Operation Identification System (POIDS) codes, we track most individual farms through sub-sequent censuses based on the legal entity for tax purposes. Except for retired and residential/ lifestyle farmers, the sample includes all farms for which the owner checked farming as his/her main occupation and had at least 100 harvested acres of corn or wheat, 5 acres of apples, or 20 beef cows, in the 1992 Census of Agriculture. The sample covers 90% of all corn acreage, 93% of wheat acreage, 95% of apple acreage, and 88% of all beef cattle and calf numbers in the nation. In this paper we use the terms wheat, corn, apple, and beef farms for interin-dustry comparison. They represent all farms defined by these census criteria.
For each commodity, we rank farms in the 1992 Census of Agriculture based on their
value of agricultural sales, exclusive of
gov-ernment payments.7These farms constitute our
initial 10 cohorts. New farm entrants in 1997 that meet the 1992 selection criteria constitute our 11th cohort, which we follow through the 2002 census. Similarly, we include new farm
entrants in 2002 as our 12th cohort.8 We
com-pute summary statistics for each cohort in each census to determine changes in size distribution characteristics of farms over time. They in-clude: (1) number of farms, (2) mean size, (3) median size, (4) size range, (5) size standard deviation, (6) size skewness, (7) size kurtosis, (8) number of exiting farms, and (9) portion of farms in each of the four sales categories.
To permit valid calculations of farm growth between the 1992 census and each later census, agricultural receipts are deflated by the index of prices received. Corn, wheat, apple, and beef sales are deflated by the indexes of prices re-ceived for feed grains and hay, food grains, fruit and nuts, and meat animals, respectively. The remaining agricultural sales are deflated by the index of prices received for all farm products (USDA 2001, 2005).
We report the first two moments, the me-dian, and the approximate range of the 1992 farm size distribution of each cohort for each commodity in Table 1. A large number of farms in each of the four industries were relatively small operations, selling less than $100,000 worth of agricultural commodities. While less than half of all corn and wheat farms can be considered small operations, half of apple farms and 70% of beef farms fell into this category. For all commodities, cohorts 1–9 had medians that were very similar to their means, and they had small standard deviations. In each case, the standard deviation for cohort 10 was much larger than the others because its range
6Unlike the Herfindahl and entropy measures of
diversification which use sales from several enterprises within one farm and measure spread across these several enterprises (e.g., Sumner and Wolf), our mea-sure only uses sales from the primary enterprise.
7This criterion is in addition to the value of
pro-duction consumed on the farm (e.g., raised corn fed to beef cattle).
8For each industry, new entrants are farms we were
unable to track from the previous census that now satisfy the 1992 selection criteria. A farm that was initially selected as a commodity farm remains in the sample as long as it continues as a legal business entity and produces the commodity (even if it no longer meets the initial selection criteria).
was open-ended. The median and mean values for cohort 10 were also very different for each commodity, suggesting that this cohort was
right-skewed, containing some very large
farms.
We also report the median and range width of the 1997 and 2002 farm size distributions for each incumbent cohort in Table 2. Medians were substantially different from the means in all cohorts for each commodity. The standard de-viations were also large and many increased over time. Along with the range width, these statistics indicate that the size distribution of farms in each incumbent cohort became highly asymmetric and dispersed over time. For each of the first nine cohorts, size heterogeneity of farms increased over time because a few farms experienced substantial growth. In fact, except for apples, a number of farms in every cohort grew enough to be within the range of the largest cohort in successive censuses.
Results
Firm Growth
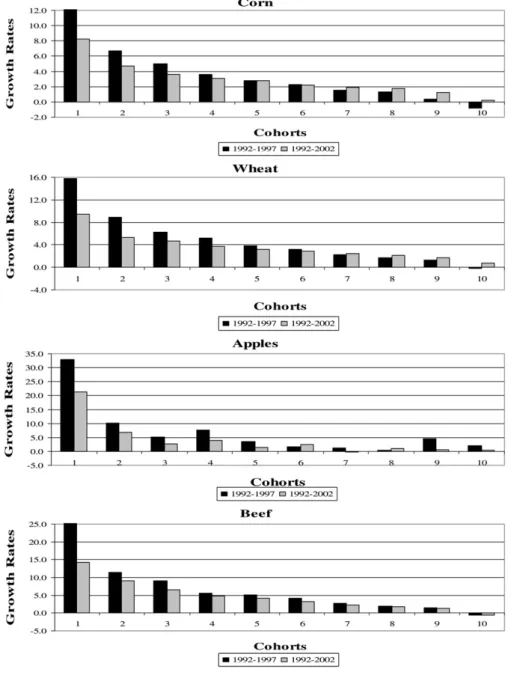
Corn and wheat farms grew less rapidly than apple and beef farms (see Figure 2). However, farms did not maintain a constant growth rate over the 10-year period in any of the industries. In general, farms grew less rapidly between 1997 and 2002 than between 1992 and 1997, making the 10-year average growth rate lower than the 5-year average growth rate. The growth rates for incumbent apple and beef farms slowed the most between 1997 and 2002. The growth rate distribution across cohorts was very similar for corn, wheat, and beef farms. The most rapid growth occurred in the smallest cohort, and the slowest growth occurred in the largest cohort (see Figure 3). This pattern ap-plied to both time intervals. Additionally, as noted above, the magnitude of growth rates de-creased for all cohorts for each of the three commodities over the 10-year period relative to the 5-year period.
Despite having some similarities to the growth rate patterns of the other three com-modities, farms in the apple industry followed a different path, with most of the differences
T able 1. Agricultural Sal es Range, M edian, and Sample Distrib ution M oments for Cohorts, 199 2, in $1,0 00 a Cohort Corn Wheat Apples Beef Median Mean Range Median Mean Range Median Mean Range Median Mean Range 14 3 4 1 (12) <54 19 19 (8) <29 5 5 (3) <11 5 5 (2) <8 26 9 7 3 (7) 54–77 39 39 (6) 29–48 18 18 (5) 11–26 10 10 (2) 8–13 39 2 9 7 (7) 77–100 59 58 (7) 48–69 35 34 (6) 26–45 16 16 (2) 13–20 4 115 122 (8) 100–125 81 81 (7) 69–93 58 57 (8) 45–70 24 24 (3) 20–30 5 141 142 (9) 125–153 106 107 (8) 93–121 85 88 (11) 70–107 36 36 (4) 30–44 6 173 173 (10) 153–187 139 139 (11) 121–158 127 128 (13) 107–150 53 54 (7) 44–65 7 212 213 (14) 187–234 182 183 (15) 158–210 183 183 (19) 150–216 79 79 (10) 65–96 8 268 269 (20) 234–303 247 248 (23) 210–291 270 271 (34) 216–334 117 118 (15) 96–146 9 362 366 (40) 303–444 358 364 (48) 291–462 427 439 (72) 334–585 188 192 (32) 146–256 10 625 938 (1,737) >444 683 1,094 (2,282) >462 950 1,552 (1,762) >585 404 651 (2,330) >256 a Standard de viations are in parentheses. Data source: Census of Agricultur e (USD A 1 992).
T able 2. Agricul tural Nom inal Sales Range, Median, and Sample Distrib ution Moments for Incumbent Cohorts, 1997 and 2002, in $1,000 a Cohort Corn Wheat Apples Beef Median Mean Range W idth Median Mean Range W idth Median Mean Range W idth Median Mean Range W idth 1997 Census 16 3 8 7 (159) 8,775 28 43 (88) 3,500 9 2 2 (41) 270 7 1 6 (88) 6,154 2 9 0 111 (112) 3,158 48 66 (182) 11,422 18 32 (54) 584 11 18 (59) 3,050 3 113 136 (130) 4,024 70 88 (91) 1,905 35 49 (57) 440 15 25 (102) 7,641 4 139 160 (146) 6,225 95 117 (172) 10,475 60 92 (217) 3,863 22 32 (73) 3,500 5 167 188 (137) 2,585 122 144 (160) 6,711 93 116 (135) 1,668 34 47 (100) 5,469 6 200 223 (170) 4,000 158 182 (146) 2,712 125 155 (134) 1,273 51 67 (156) 13,355 7 241 264 (174) 4,525 202 229 (170) 4,112 175 215 (222) 2,804 78 94 (106) 4,024 8 300 330 (246) 9,223 270 302 (238) 9,224 248 308 (277) 3,470 117 135 (129) 5,388 9 394 428 (264) 7,016 383 431 (348) 15,664 440 606 (1,778) 38,668 188 214 (180) 4,003 10 684 1,022 (2,306) 115,885 743 1,197 (2,667) 105,417 1,102 1,897( 2,919) 32,563 408 659 (1,912) 120,842 2002 Census 1 5 6 9 2 (192) 7,322 21 44 (153) 5,872 15 35 (68) 507 7 1 8 (96) 4,421 2 7 7 110 (151) 4,046 40 62 (88) 1,237 22 36 (63) 724 10 23 (139) 7,484 3 9 6 131 (186) 5,076 59 88 (134) 2,817 31 46 (50) 272 15 28 (85) 2,905 4 118 158 (261) 14,729 82 110 (136) 3,074 60 88 (152) 1,954 21 36 (99) 3,000 5 146 187 (249) 9,264 107 139 (200) 5,498 78 106 (134) 1,009 31 51 (179) 11,260 6 175 216 (244) 7,844 139 175 (218) 9,264 133 171 (196) 2,109 47 69 (130) 5,943 7 214 258 (273) 9,953 179 220 (218) 3,600 146 187 (178) 1,294 71 94 (117) 2,149 8 268 322 (338) 12,830 236 291 (369) 11,102 252 314 (315) 2,774 106 135 (151) 3,020 9 351 416 (386) 8,878 339 409 (452) 15,713 396 488 (453) 3,850 167 208 (226) 4,997 10 608 961 (2,085) 108,248 633 1,126 (3,340) 138,600 943 1,670 (2,039) 11,255 366 587 (1,741) 124,174 a Standard de viations are in parentheses. Data source: Census of Agricultur e (USD A 1 997, 2002)
occurring at the upper end of the farm size dis-tribution. In particular, the largest farms did not grow the slowest in this industry. Instead, farms in cohort 7, for example, grew more slowly than those in cohort 10 in both periods.
For all commodities, the growth rate was strongly and negatively correlated with cohort number over both periods. With the exception of the apple cohorts, all cohorts grew at a more rapid rate than the next larger cohort over each time interval. Correlation coefficients between the growth rate and the cohort number ranged from –0.85 to –0.93 for corn, wheat, and beef farms in both the 5- and 10-year periods. Al-though a little lower (approximately –0.70), the correlation coefficients for the apple industry were also negative for each period.
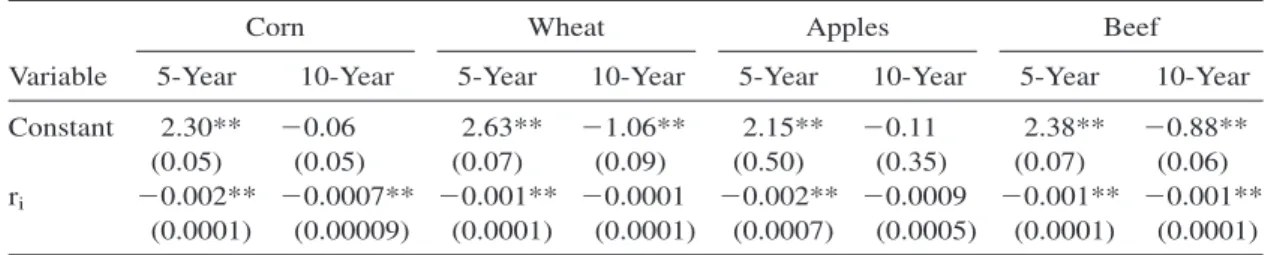
The estimated parameters for Equation (1) are reported in Table 3 for each commodity and time interval. The parameter estimate associ-ated with the annual growth rates for each time interval was negative for each commodity. With the exception of the wheat and apple equations for the 10-year period, the growth parameter estimate was significant at the 5% level. Thus, we fail to reject the hypothesis of mean reversion for either time interval for corn and beef and for the 5-year period for wheat and apples. Additionally, we fail to reject the hypothesis of random walk growth implied by Gibrat’s law for the 10-year time interval for both wheat and apple farms.
Based on our findings from the cohort growth patterns and the statistical tests for all four commodities, we can answer the first question and provide inference about equilib-rium size in each industry. First, they show the
mean size of the largest cohort grew less rap-idly over the 5-year and 10-year periods than the mean size of nearly all other cohorts. We therefore conclude that the answer to the first question is ‘‘No’’: the largest farms do not grow as rapidly as the medium-sized farms. Second, they provide evidence for all commodities in the 5-year period and for corn and beef in the 10-year period that cost economies diminish with size and suggest that a stable steady-state equilibrium does exist. Only in the case of wheat and apples for the 10-year period do the size distributions appear to follow a random walk with no stable steady-state equilibrium. Thus, we can clearly rule out the hypothesis that ‘‘larger farms grow relatively faster than smaller farms’’ for all four industries. We also find considerable evidence to support the hy-pothesis that a steady-state equilibrium exists for two of these four industries (corn and beef) but the support is dependent on time interval for wheat and apples.
Firm Size and Diversification
Farms in the sample varied greatly by the per-cent of agricultural income generated by the respective commodity group. Recall that we use the commodity group’s weighted share of
agricultural income,Dk, from Equation (2) as a
proxy for specialization, that is, the converse of diversification. Specialization differences are examined both among cohorts and between time intervals, the results of which are sum-marized in Table 4.
Apple farms were the most specialized in each census while beef farms were generally
the least specialized. On average, our sample of apple farms generated about 80% of their ag-ricultural revenue from the sale of fruit, tree nuts, and berries in 1992 while beef farms re-ceived only 44% of their agricultural revenue from the sale of cattle and calves. Grain farms received 63–65% of their agricultural revenue from the sale of grains, oilseeds, dry beans, and dry peas in 1992. Over the 10-year period, both wheat and apple farms became less spe-cialized while corn and beef farms became
more specialized in their source of agricultural
revenues.9
Figure 3. Annual Growth Rates
9The results in Table 4 indicate that beef farms
became much more specialized in 2002. However, the survey questions that defined degree of specialization changed for beef farms in the 2002 Census of Agricul-ture. Consequently, our conclusion about beef farms is subject to the possibility of measurement error due to the change in the way the questions were formulated. There was little change in level of specialization on beef farms between the 1992 and 1997 censuses.
In addition, the level of specialization varied by cohort level. In 1992, the 10th cohort (con-taining the largest farms) was the least spe-cialized for each of the four commodities. It remained the least specialized in each census for all commodities except apples. The most specialized cohort, however, varied by com-modity and census. For corn and beef, it was generally one of the smaller cohorts; for wheat and apples, it was generally one of the midsized cohorts.
The relationship between farm size and the degree to which the farm relied on its primary output is also apparent from the correlation coefficients. In the case of grain and beef farms, the generally large negative correlation coeffi-cients document a clear tendency among these farms toward less specialization as farm size increases. This tendency became stronger over time for beef but weaker for grain, especially wheat for which the correlation coefficient approached zero in 2002. For apple farms, the positive correlation in 1997 and 2002 indicates a tendency toward more specialization as farm size increases.
Our findings concerning temporal changes in specialization for the four industries answer the second research question, Do farms become more diversified over time? They show that only wheat and apple farms become more di-versified over time. We therefore conclude that the answer to the second question is ‘‘Yes’’ for wheat and apples, but ‘‘No’’ for the corn and beef industries.
Consequently, the third question, whether larger farms diversify more rapidly than medium-sized farms, only applies to wheat and apple farms since corn and beef farms became more
specialized. In order to answer this question, we first organized cohorts into small, medium, and large farm groups. We classified farms in cohorts with less than approximately $100,000 in 1992 agricultural sales as small farms, those with $100,000–$300,000 in sales as medium-sized farms, and those with sales above $300,000 in sales as large farms. The cohorts which fall into each class are reported in Table 5. We then used the medium and large farms’ specialization indices to compute rates of change in specialization coefficient over time (see Table 4). In each case, the relative decrease in specialization (when it occurred) was less for large farms than for medium-sized farms. Thus, larger farms do not appear to diversify more rapidly than medium-sized farms for either wheat or apple farms.
Firm Entry and Exit
The distribution of new entrants was very dif-ferent than the distribution of incumbent farms and varied between censuses (see Table 6). Their mean size was larger than the average incumbent, falling between the means of in-cumbent cohorts 6 and 8 in 1997 and cohorts 6 and 10 in 2002. Relative to other farms, new apple entrants had the largest mean size relative to the incumbents, falling between the means of apple incumbent cohorts 7 and 8 in 1997 and
cohorts 9 and 10 in 2002.10
Table 3. Growth Rate Coefficient Estimates, Equation (1)a
Corn Wheat Apples Beef
Variable 5-Year 10-Year 5-Year 10-Year 5-Year 10-Year 5-Year 10-Year
Constant 2.30** 20.06 2.63** 21.06** 2.15** 20.11 2.38** 20.88**
(0.05) (0.05) (0.07) (0.09) (0.50) (0.35) (0.07) (0.06)
ri 20.002** 20.0007** 20.001** 20.0001 20.002** 20.0009 20.001** 20.001** (0.0001) (0.00009) (0.0001) (0.0001) (0.0007) (0.0005) (0.0001) (0.0001)
a
Standard errors are in parentheses. Estimated parameters that are significant at the 0.05 level are marked with an asterisk and those significant at the 0.01 level are marked with two asterisks.
10We do not have comparable data for farms that
exit since we only observe their sales in the last census before they exit. Also, we did not track their sales separately from the cohort’s incumbents.
The distribution of new entrants was posi-tively (right) skewed, so their median size was much smaller that their mean in all industries. These statistics indicate that a small number of entrants were very large. In fact, in 1997 their median size was smaller than the overall me-dian size of all incumbent farms in the corre-sponding industry, falling between the median sizes of incumbent cohorts 3 and 4. The median size of 2002 new entrants was closer to the overall median size of all incumbent farms, falling between cohorts 4 and 7.
Between the 1992 and 1997 censuses, more new farms entered each industry than exited. Only small grain and medium-sized apple farms had approximately the same number of entering and exiting farms. The correlations between the exit/entry ratio and cohort number were highly negative for corn and wheat, close to zero for apples, and positive for beef (Table 7). Over the 10-year period, with the exception of small beef operations and large corn farms, there were more exiting than entering farms of all sizes in each industry. This imbalance was most apparent for wheat farms—more than four times as many farms exited wheat production
as entered this industry. Also, more than twice as many large beef farms exited the industry as entered. The correlations between exit/entry ratio and cohort number suggest that the num-ber of exiting farms relative to the entering farms decreases with size in the corn and wheat industries, but increases with size in the beef industry.
Additionally, new entrants between 1992 and 1997 were more specialized than were all incumbents (see Table 4). With the exception of beef, at least 70% of total agricultural sales came from the sale of the primary commodity. Apple entrants were the most specialized and beef entrants were the least specialized in 1997 with 85% and 51% of their total agricultural income coming from the sale of the primary commodity, respectively. Corn, wheat, and ap-ple entrants in 1997 became less specialized by
Table 4. Specialization Coefficients for Incumbent and New Entrant Cohorts, Estimated at the
Cohort Means
Corn Wheat Apples Beef
Cohorts 1992 1997 2002 1992 1997 2002 1992 1997 2002 1992 1997 2002 1 0.79 0.77 0.72 0.77 0.69 0.55 0.78 0.73 0.77 0.47 0.47 0.75 2 0.75 0.76 0.74 0.69 0.67 0.57 0.81 0.74 0.71 0.49 0.49 0.75 3 0.71 0.76 0.74 0.68 0.67 0.60 0.81 0.74 0.71 0.50 0.49 0.74 4 0.67 0.73 0.72 0.67 0.69 0.62 0.82 0.76 0.74 0.50 0.48 0.71 5 0.64 0.71 0.71 0.68 0.70 0.63 0.84 0.80 0.78 0.48 0.46 0.66 6 0.62 0.69 0.70 0.68 0.70 0.65 0.84 0.81 0.77 0.44 0.43 0.61 7 0.59 0.66 0.68 0.66 0.70 0.66 0.84 0.80 0.80 0.41 0.40 0.55 8 0.57 0.64 0.66 0.63 0.66 0.64 0.83 0.80 0.78 0.38 0.37 0.49 9 0.54 0.61 0.63 0.58 0.62 0.61 0.82 0.81 0.80 0.36 0.34 0.44 10 0.42 0.50 0.52 0.42 0.48 0.47 0.76 0.76 0.75 0.35 0.33 0.39 11 0.78 0.75 0.71 0.60 0.85 0.80 0.51 0.74 12 0.71 0.70 0.82 0.74
Avg. All Cohorts 0.63 0.68 0.68 0.65 0.66 0.60 0.81 0.77 0.76 0.44 0.43 0.61
Avg. Medium Cohorts 0.66 0.69 0.65 0.83 0.80 0.78
Avg. Large Cohorts 0.50 0.55 0.54 0.79 0.78 0.77
Least Specialized 10 10 10 10 10 10 10 1 2–3 10 10 10
Most Specialized 1 1 2–3 1 5–7 7 5–7 6,9 7,9 3–4 2–3 1–2
Correlation
Coefficient 20.9820.9420.8520.8420.6120.02 0.01 0.69 0.56 20.9020.9320.98
Table 5. Cohort Numbers in Farm Size Classes
Corn Wheat Apples Beef
Small farms 1–3 1–4 1–5 1–7
Medium-sized farms 4–8 5–8 6–8 8–9
the 2002 census. New entrants in the apple in-dustry between 1997 and 2002 were also the most specialized among the four industries and were more specialized than any incumbent apple cohort. New entrants to the other indus-tries were also more specialized than nearly all incumbent cohorts.
Interindustry Context
Our findings with regard to farm growth and diversification for corn, wheat, apple, and beef industries provide important counterexamples to those found for the dairy industry (Melhim, O’Donoghue, and Shumway). The similarities in structural changes previously observed at the industry level for many agricultural commodi-ties (Gray and Boehlje; Morrison-Paul et al.; Mafoua) do not appear to hold at the farm level. Our inferential evidence of scale and scope economies was considerably different between these industries and the dairy industry.
Scale economies diminished with size for each of the four industries while they increased with size for dairy farms. Large dairy farms grew faster than medium-sized farms while large grain, apple, and beef farms grew more slowly than medium-sized farms. This suggests that, unlike dairies, the size of farms in some of these industries is approaching an equilibrium and this equilibrium is generally stable.
The extent of scope economies also varied substantially among industries. Scope econo-mies were evident in the dairy industry as farms of all sizes became much more diversified. Our findings suggest that the corn and beef indus-tries did not exhibit evidence of scope econo-mies while the wheat and apple industries did. Like the dairy industry, the evidence of scope economies in the wheat and apple industries was greater for medium-sized than for large farms.
Conclusions
The purpose of this study was to assess evi-dence of scale and scope economies for four major agricultural industries using longitudinal agricultural census data between 1992 and 2002. They have become more consolidated as
T able 6. Agricultural Sale s Range, Median, and Sample Distrib ution Mom ents for Ne w Entrants, in $1,0 00 a Cohort Corn Wheat Apples Beef Median Mean Range Median Mean Range W idth Median Mean Range W idth Median Mean Range W idth 11 (1997) 125 245 (1,383) 81,799 77 199 (993) 35,827 37 253 (1,273) 18,854 17 75 (682) 81,805 11 (2002) 119 236 (605) 15,513 174 428 (1,626) 69,594 44 150 (300) 1,961 17 81 (433) 26,559 12 (2002) 200 401 (1,212) 70,797 83 205 (885) 29,584 120 676 (3,432) 69,596 25 131 (596) 43,817 aStandard de viations are in parentheses. Data source: Agricultural Census (USD A, 1992)
the total number of farms decreased while the number of large farms producing each com-modity increased in each of these industries. Consequently, production has become more concentrated in each industry.
We conclude that scale economies diminish with size for each of these four industries. Large corn, wheat, apple, and beef farms all grew slower than medium-sized and small farms. This suggests that their size distribution is approach-ing a steady-state equilibrium. This statement holds inferentially for all four commodities. However, based on our statistical hypothesis tests, only the size distribution of corn and beef farms is approaching a steady-state equilibrium while the others are following a random walk. In each industry, new entrants were larger on av-erage than the incumbents, but the size of new entrants showed high variability.
Also, based on evidence that it became more specialized over time, we conclude that the corn industry does not exhibit scope econo-mies. Scope economies were apparent in the apple industry and to a lesser extent in the wheat industry. They were greater for larger than for medium-sized farms. A growing number of apple and wheat producers are making the strategic decision of becoming less dependent on production of fruit and grain, respectively, in favor of other agricultural out-puts. Large farms remain less specialized than medium-sized farms. However, the rate of di-versification over time was highest among medium-sized producers. Small farms in all four industries remained more specialized than larger farms.
There were more exits than new entrants in all industries over the 10-year period from 1992 to 2002, particularly evident in the wheat industry. The relationship between industry exit/entry ratio and farm size, however, was
industry specific. The ratio increased with size in the beef industry while it decreased with size in the corn and wheat industries. In the apple industry, there was no apparent relationship between industry exit/entry ratio and farm size. These findings have important decision-making implications for producers of these commodities. The diminishing scale economies in these four industries suggest that larger producers might avoid diseconomies of scale and reduce potential inefficient production by approaching expansion cautiously. The domi-nance of scope economies over scale econo-mies for large apple and wheat farms suggests that large farmers in these two industries could grow more efficiently by pursuing output di-versification. Alternatively, corn producers of all sizes have little incentive to pursue greater diversification given their current technologies. These findings also have important decision-making implications for policy makers, but implications of a rather benign nature. Unlike the dairy industry in which policy intervention may ultimately be needed to promote compet-itiveness because the largest farms are growing at the fastest rate, the evidence suggests little need for such policies in these industries.
[Received June 2008; Accepted August 2008.]
References
Ben-Belhassen, B., and A.W. Womack. ‘‘Measure-ment and Explanation of Technical Efficiency in Missouri Hog Production.’’ Paper presented at the American Agricultural Economics Association Annual Meeting, Tampa FL, 2000.
De Wit, G. ‘‘Firm Size Distributions an Overview of Steady-State Distributions Resulting from Firm Dynamics Models.’’International Journal
of Industrial Organization23(2005):423–50.
Table 7. Ratio of Exits to New Entrants
Size
Corn Wheat Apples Beef
5-Year 10-Year 5-Year 10-Year 5-Year 10-Year 5-Year 10-Year
Small 1.1 1.5 1.1 4.1 0.7 1.3 0.5 0.8
Medium 0.8 1.7 0.9 4.6 1.0 1.5 0.8 1.2
Large 0.6 1.0 0.7 3.4 0.6 1.2 0.4 2.4
Gray, A.W., and M.D. Boehlje. ‘‘Drivers of Change in U.S. Agriculture: Implications for Future Policy.’’ Paper presented at the Ameri-can Agricultural Economics Association An-nual Meeting, Portland OR, 2007.
Helmers, G., S. Shaik, and J. Atwood. ‘‘Scope and Scale Efficiency Gains Due to Vertical Integra-tion in the U.S. Hog Sector.’’ Paper presented at the Southern Agricultural Economics Associa-tion Annual Meeting, Mobile AL, 2003. Hoppe, R.A., D.E. Banker, P. Korb, E.
O’Donog-hue, and J.M. MacDonald. America’s Diverse
Family Farms. U.S. Department of Agriculture,
Economic Research Service, Economic Infor-mation Bulletin no. (EIB-26), 2007.
Just, R.E., S. Mitra, and S. Netanyahu. ‘‘Implica-tions of Nash Bargaining for Horizontal Industry Integration.’’ American Journal of Agricultural
Economics87(2005):467–81.
Mafoua, E.D. ‘‘Economies of Scope and Scale of Multi-Product U.S. Cash Grain Farms: A Flexible Fixed-Cost Quadratic (FFCQ) Model Analysis.’’ Paper presented at the American Agricultural Economics Association Annual Meeting, Long Beach CA, 2002.
Melhim, A., E.J. O’Donoghue, and C.R. Shum-way. ‘‘Do the Largest Firms Grow and Diver-sify the Fastest? The Case of U.S. Dairies.’’
Review of Agricultural Economics31(2009).
Morrison-Paul, C.J. ‘‘Market and Cost Structure in the U.S. Beef Packing Industry: A Plant-Level Analysis.’’ American Journal of
Agri-cultural Economics83(2001):64–76.
Morrison-Paul, C.J., R. Nehring, and D.E. Banker. ‘‘Productivities, Economies, and Effi-ciency in U.S. Agriculture: A Look at Con-tracts.’’ American Journal of Agricultural
Economics86(2004):1308–14.
Morrison-Paul, C.J., R. Nehring, D.E. Banker, and A. Somwaru. ‘‘Scale Economies and Efficiency in U.S. Agriculture: Are Traditional Farms History?’’ Journal of Productivity Analysis 22(2004):185–205.
Mosheim, R., and C.A.K. Lovell. ‘‘Economic Efficiency, Structure and Scale Economies in the U.S. Dairy Sector.’’ Paper presented at the American Agricultural Economics Association Annual Meeting, Long Beach CA, 2006. Mulik, K., R.D. Taylor, and W.W. Koo.
‘‘Esti-mating Efficiency Measures in North Dakota Farms.’’ Center of Agricultural Policy and Trade Studies, North Dakota State University, Agribusiness and Applied Economics Report No. 565, 2005.
Ollinger, M.E., J.M. MacDonald, and M. Madi-son. ‘‘Structural Change in U.S. Chicken and Turkey Slaughter.’’ Washington, DC: U.S. De-partment of Agriculture, Economic Research Service, Ag Econ Report. no. 787, 2000. Sumner, D.A., and C.A. Wolf. ‘‘Diversification,
Vertical Integration, and the Regional Pattern of Dairy Farm Size.’’ Review of Agricultural
Economics24(2002):442–57.
Sutton, J. ‘‘Gibrat’s Legacy.’’ Journal of
Eco-nomic Literature35(1997):40–59.
U.S. Department of Agriculture. 2001, 2005.
Ag-ricultural Statistics. National Agricultural
Sta-tistical Service. Internet site: http://www.nass. usda.gov/Publications/Ag_Statistics/.
———. 1992, 1997, 2002.Census of Agriculture. National Agricultural Statistical Service. In-ternet site: http://www.nass.usda.gov/Cen-sus_of_Agriculture.
———. 2007.Economics, Statistics and Market
Information. National Agricultural Statistical
Service. Internet site: http://usda.mannlib. cornell.edu/usda/nass.