Wine Economics and Policy 1 (2012) 54–62
Millennial wine consumers: Risk perception and information search
Thomas Atkin
1, Liz Thach
nSchool of Business & Economics, Sonoma State University, 1801 E. Cotati Blvd., Rohnert Park, CA 94928, USA
Received 1 June 2012; received in revised form 14 August 2012; accepted 27 August 2012 Available online 23 September 2012
Abstract
Marketing managers in the US have long been concerned with how to reach young consumers most effectively and how to present important information. This research demonstrates how the information search and risk reduction strategies of Millennials differ from older consumers. Findings from a survey sample of 409 US consumers suggest that if unsure about making a wine selection, Millennials are more apt to seek information from friend/family and shelf talkers than elders. Elders were more willing to ask questions of store personnel and wine stewards. While brand is very important to both groups, Millennials rely less on geographical cues such as region of origin to determine wine quality and pay more attention to medals won, label imagery, and alcohol content. The differences in the importance of and usage of these various information sources are helpful for wineries to prioritize their marketing appeals to the Millennial segment.
&2012 UniCeSV, University of Florence. Production and hosting by Elsevier B.V.
Keywords:Information search; Risk perception; Millennials; Wine label; Consumer behavior
1. Introduction
As the global wine industry grows more competitive, marketers continually strive to differentiate their brands to consumers in ways that are critical to success. Consumer perceptions of a wine’s quality are important factors in the decision process, but with thousands of wines to choose from, it is difficult for the consumer select one wine over another.
For many consumers the act of purchasing wine is clouded with insecurity. There is concern they will select the wrong bottle which could result in negative social perceptions. Because of this researchers have found that risk perception is an important driver of wine purchase behavior (Lockshin et al., 2006; Mueller et al., 2008).
Fortunately, providing product information, such as help-ful labels, shelf-talkers, friendly retailers and recommenda-tions from others can ease this insecurity, and increase the likelihood of purchase (Gluckman, 1990).
In the US, one of the fastest growing wine consumer segments is the Millennial generation (Wine Market Council, 2009). Much research has been conducted on the types of wine they like to drink, as well as their motivations for drinking wine, yet very little research has focused on the issues of risk perception and information search within this important consumer segment. Therefore, the purpose of this research study was to examine Millennial use of product information to reduce risk of a bad purchase decision in comparison to older wine con-sumers. The findings are useful in that they provide new insights for Millennial wine marketing strategies.
2. Review of the literature
Wine has a high proportion of characteristics that can only be assessed during consumption, so the ability of the consumer to gauge quality prior to purchase is very low. They have to rely upon intrinsic and extrinsic cues to aid in the evaluation. Intrinsic cues for wine buyers include grape www.elsevier.com/locate/wep
2212-9774&2012 UniCeSV, University of Florence. Production and hosting by Elsevier B.V. http://dx.doi.org/10.1016/j.wep.2012.08.002
n
Corresponding author. Tel.:þ1 707 664 4212.
E-mail addresses:tom.atkin@sonoma.edua (T. Atkin), lizthach@aol.com, liz.thach@sonoma.edu (L. Thach).
1
Tel.:þ1 707 664 3333.
Peer Review under the responsibility of UniCeSV, University of Florence.
Open access under CC BY-NC-ND license.
variety, alcohol content and wine style—things that relate to the product itself. Consumers cannot always evaluate the relevant intrinsic attributes at the point of purchase because the quality-related characteristics, such as taste and aroma, are not available at that time. The consumer is then forced to rely upon extrinsic attributes such as brand name or package as surrogates (Jacoby and Olson, 1985; Zeithaml, 1988).
The extrinsic cues are features that the winery can adapt to particular market segments without actually changing the product. For example, according to Lockshin and Rhodus (1993), the average wine consumer is likely to rely upon extrinsic cues such as price or region of origin when making quality assessments. Later research found that they also consider elements such as label, brand and shelf position (Lockshin et al., 2006; Lockshin and Spawton, 2001). These cues are used as shortcuts or decision heuristics to inform their choice. Consumers are also able to develop trust with brands and regions whose track records have pleased them before (Bruwer and Wood, 2005).
In a similar vein,Hall et al. (2004)found extrinsic cues used to evaluate quality to include price, the consumer’s distribution outlet, region of production, recommenda-tions of friends, advice of salespersons, label and packa-ging, and brand name (Hall et al., 2004). If the brand is not well known, the consumer will assess quality by using other cues such as country of origin (Perrouty et al., 2006). 2.1. Risk perception and social benefits
Wine is generally regarded to be a complicated product from the viewpoint of the consumer. It involves both risks and social benefits. The risk may be selecting the wrong wine, and the benefits revolve around choosing a wine that others admire. Therefore consumers generally employ risk reduction strategies. Reviewing the label cues like those mentioned above for pertinent information is one way for wine consumers to reduce the risk of buying an unsatis-factory wine. Risk perception is one of the wine-related personal traits found to be an important driver of wine purchase behavior (Lockshin et al., 2006; Mueller et al., 2008). According to one study (Teagle et al., 2010), Millennials were found to be less risk averse than older wine consumers.
Because of the inability to test the contents of the bottle before purchasing, there is an element in the decision process that involves a risk-perception strategy (Spawton, 1991; Mitchell and Greatorex, 1989; Gluckman, 1990). It has been asserted byMitchell and Greatorex (1989)that purchasing wine mostly involves functional risks such as social risks, financial risks and physical risks. Social risks would involve trying to avoid being embarrassed in front of business associates and friends.
Spawton (1991) identified six risk-related consumer strategies to evaluate quality. He asserted that consumers strive to reduce the likelihood of making a bad purchase
decision by using a variety of coping mechanisms. These include:
selecting wine brands that represent consistent quality and are included in the range of ‘‘safe brands’’ estab-lished in the mind of the wine consumer; selecting wines based on the recommendations of friends and colleagues; following the advice of sales associates; using their own knowledge gained through wine education; price (as an indicator of quality); and packaging and labeling as an indicator of quality.On the other side of the equation are the social benefits of selecting a wine which is admired by others. Indeed, one of the four value dimensions established by Sweeney and Soutar (2001) in their assessment of brand benefits (per-ceived value) was social benefit. They defined social value (enhancement of social self-concept) as the utility derived from the product’s ability to enhance social self-concept. Consumers assess the products beyond just the functional terms of expected performance and value for money. Consumers also assess products in terms of the social consequences of what the product communicates to others in terms of social value (Sweeney and Soutar, 2001).
Orth (2005) found that with increasing age, consumers seek less social benefit and more health benefit. He showed that younger individuals who are more involved and more susceptible to the opinions of others desire greater social benefits (Orth, 2005). In addition, another study (Barber et al., 2006) found that younger consumers, 21 through 40 years old, were more intimidated and had a higher ‘‘respondent concern about choosing wine’’ than consu-mers over 60.
2.2. Information search
The steps that consumers go through to learn about wines before making a selection are considered informa-tion search (Olsen and Thach, 2001). One of the ways that Mitchell and Greatorex (1989) described to reduce risk when purchasing wine is information seeking. Hall et al. (2004)found that younger consumers (under 35 years old) place more importance on information gathering and risk reduction. Specifically, they rely more upon advice from salespersons, advice from waiters, and samples and in-house displays than older consumers (Hall et al., 2004). If a consumer’s low self-confidence is specific to wine, as opposed to being a personality trait, they will pursue more information seeking in order to reduce risk (Olsen et al., 2003).
Consumers often employ information appearing on the label of the product to make inferences about the quality of the product (Verlegh and Steenkamp, 1999). There are many different cues on the wine package that may
influence the consumer’s evaluation. These include region, appellation, and country of origin as well as vintage, grape variety, medals won, and alcohol content. Recent studies have found that origin of wine is often perceived as an indicator of quality and may be used as the basis of decision making when purchasing wine (Duhan et al., 1999).
Place of origin is an attribute that can help persuade a consumer to buy a particular wine. Consumers often employ information about the place of origin of a product to make inferences about the quality of the product (Verlegh and Steenkamp, 1999). The origin information helps consumers to reduce perceived risk and assess the social acceptability of their choices (Papadopoulos and Heslop, 2002). Jarvis and Rungie (2002) used a choice-based experiment to reveal consumer utility values. The category ‘‘well known region’’ had the highest stated choice utility among all respondents. Those findings were in agreement with research performed by Tustin and Lockshin (2001).
Recent research byHussein et al. (2007)found that wine consumption was positively related to age and income. They suggest that US wineries consider such demographics in their marketing plans. Hall et al. (2004) demonstrated that the importance of region was different for different age group segments. The youngest group (18–25 years old) relied significantly less on the region of origin of the wine (Hall et al., 2004).
Not enough is yet known about the impact of region of origin on wine consumer purchasing decisions and how the impact varies across different consumer market segments (Johnson and Bruwer, 2007; Bruwer and House, 2003; Lockshin, 2003). Recently, researchers concluded that there is not a statistically significant difference in the influence of a wine’s region of origin between consumers aged 18–34 and those over 35 years old (McCutcheon et al., 2009).
Perrouty et al. (2006) assert that novices utilize wine origin cues, like the winery name, but they shift their attention to cues like brand and price as they gain more knowledge. Young, less experienced consumers, however, tend to rely more heavily on descriptions from labels and other sources (Chaney, 2000). We would expect that consumers with different ages will utilize different informa-tion in their evaluainforma-tion of wine quality.
Thomas and Pickering (2003) found that among new wine drinkers, alcohol level was seen as the most important information appearing on the wine label. They surmised that those findings could be a reflection of the perceived risk and lower confidence levels of that group (Thomas and Pickering, 2003).
2.3. Other factors—wine knowledge and price
Other factors that need to be considered when examin-ing risk perception and information search are wine knowledge and price. In terms of wine knowledge, research
has shown that wine consumers who are young and less experienced rely heavily on descriptions from labels, journalists, wine writers, and retail sales associates (Chaney, 2000). In addition, another study (Perrouty et al., 2006) reports that novices give extra attention to wine origin cues, but their interest shifts to brand and price as their knowledge increases. The price of a bottle of wine also acts as an indicator of quality for many wine consumers (Quester and Smart, 1998). Thomas and Pickering (2003) determined that price was one of the most important informational items consumers use to assess wines before buying.
2.4. Characteristics of the millennial generation
In the US, the Millennial generation (also referred to as Gen Yers, Nexters, and Echo Boomers) has received much attention from marketing research firms in the past decade. A very large generation, most experts agree they were born between the years of 1977 and 2000, though these dates vary by source ranging from starting as late as 1983 and ending in 2004 (Gillespie, 2010;Tapscott, 2008;Junco and Mastrodicasa, 2007;Howe and Strauss, 2000), resulting in 70–76 million people. Regardless of the exact beginning and ending birth dates, marketing experts consider the Millennials to be important to consumer product firms because they are the largest consumer group in the history of the US with average annual incomes totaling $211 billion (Kleber, 2009). Many have been given parent co-signed credit cards at a young age, and are very involved in family shopping (Neuborne, 1999).
As children of the Baby Boomer Generation, Millennials have developed specific traits and values that set them apart from previous generations. The most recognized is their technology savvy and use of technology in almost every aspect of their lives. They spend an average of 33 hours per week on the Internet (Junco and Mastrodicasa, 2007); 83% use online social networking sites (Zickuhr, 2010); and more than 54% of Millennials have a smart phone (Borstin, 2011). Millennials grew up with the Internet and integrate it seamlessly into their lives.
Other values include innovation, freedom, fun, and collaboration (Tapscott, 2008). They also have a high level of integrity, and seek it out in the companies for which they work. They are knowledgeable about brands and value quality products, but are concerned about fair pricing and environmental practices of consumer products companies (Moriarty, 2004; KeyFindings, 2004). In addi-tion, they are very open to diversity with one out of every three US Millennials identified as non-Caucasian (KeyFindings, 2004). Finally, Millennials are optimistic and believe they can accomplish whatever they set out to do (Howe and Strauss, 2000).
In terms of wine consumption, in the US, the Millennial generation has been credited as being one of the driving forces for increasing wine consumption from 25% in 2000 to 34% in 2010 (Gillespie, 2010). However, this does not
hold true in other countries where Millennial behavior towards wine is often the opposite. In both France and Italy, Millennials are consuming less wine, and overall consumption has dropped in those countries (Charters et al., 2011; Thach and d’Hauteville, 2008).
Previous research has identified several reasons why Millennials are adopting wine in the US in such large numbers, and some of these reasons can be linked to their values of collaboration, diversity, and fun. Millennials report that they enjoy the taste of wine; believe it goes well with food; it helps them relax, and it is a good social drink to have with friends and family (Thach, 2005;Olsen et al., 2007; Thach and Olsen, 2006). Their interest in technology explains why many seek out wine groups on Facebook and other social networking sites (Thach, 2009). Even though US Millennials report that red wine is their preferred varietal (Olsen et al., 2007), they also enjoy trying new wines from different countries (Gillespie, 2010; Nielson, 2007) which indicates a link to their value of innovation.
Overall, according to the Wine Market Council (2009), Millennial are responsible for a 35% growth in wine consumption in the US. Yet, despite these impressive numbers, there is very little research on the types of information Millennials use to select wine or the perceived risk when doing so.
3. Materials and methods
3.1. Research questions
Based on the preceding discussion of wine buying behavior, we developed a set of research questions to ascertain age related differences in the wine purchasing situation. Specifically, Millennials’ characteristics and their behaviors when evaluating wine differ from those of elders regarding 5 key attributes.
Research Questions: Do Millennials’ wine information usages differ from their elders regarding: (1) Perceived risk, (2) Social benefit, (3) Wine Knowledge, (4) Price, and (5) Information search strategies?
3.2. Survey development
An online survey was developed based on the review of the literature. A series of basic demographic questions was included, as well as wine consumption frequency, preferred wine type, and pricing. Special constructs were developed to measure risk perception, social benefits, wine knowl-edge, and information search.
For risk perception, the construct measurement was based upon an existing scale (Lockshin et al., 1997) consisting of four statements. An example is: ‘‘There are times when an improper buy of wine could bring me grief.’’ The survey participant could respond by indicating on a 7 point scale the degree to which they agreed with each
statement. A ‘‘1’’ indicated ‘‘strongly disagree’’ and a ‘‘7’’ indicated ‘‘strongly agree.’’
To measure the social benefit (enhancement of self-concept) derived from the purchase of wine, a construct adopted from Sweeney and Soutar (2001)and Orth et al. (2004)was developed. It consisted of four statements rated on a 7 point scale anchored by ‘‘1’’ strongly agree and ‘‘7’’ strongly disagree. An example of a statement is: ‘‘The wines I usually purchase make a good impression on other people.’’
The wine knowledge profile was a replication of the profile used by Johnson and Bruwer (2007). Respondents were asked to describe themselves as (1) new to wine, (2) know a little about wine, (3) somewhat knowledgeable about wine, (4) very knowledgeable about wine, or (5) expert.
To measureinformation search, the question posed was ‘‘When I am unsure about making a wine selection I consulty’’ Then a list of seven choices was provided: Store Personnel, Newspaper, Wine Steward, Bottle Label, Wine Magazine, Friends/Family or Shelf Talker. Respon-dents were asked to select all of the choices they use for wine information search.
An additional construct was also used to measure information search. This asked ‘‘Which of the following information do you evaluate on a wine label to gauge the quality inside the bottle? Check all that apply.’’ This question was followed with ten choices including State, Vintage, Region, Brand Name, Alcohol Content, Appella-tion, Organic, Label Imagery, Country of Origin and Medals Won.
The survey was beta-tested and revisions were made. It was then administered online using Survey Monkey with the support of Survey Sampling International (2009)—a professional survey firm which has a database of more than 6 million participants in over 50 countries.
3.3. Sample
The sample for this study consisted of 409 respondents who were recruited by Survey Sampling International. It invited only those who consume wine at least occasionally to respond, so should not be taken as a general population sample. It was a geographically diverse group of US respondents from 46 states as shown in Table 1 below. It compares fairly closely to the state consumption shares presented in earlier research (Cholette, 2004; Atkin and Johnson, 2010). This enabled researchers to collect a representative group of study participants on the basis of gender, age, consumption habits, and geographical loca-tion. The survey was available on Survey Monkey between October 22 and October 28, 2008. Data analysis required downloading the results in Excel and then inputting the data into SPSS.
The study sample of 409 respondents represents US wine consumers (based upon consuming at least one bottle of wine in the previous year). As shown below, the
composition of the sample is fairly close to United States Census Data from 2008 (US Census Bureau, 2008). The total sample included 47.3% men and 53.8% women. They came from 46 US states, with 64.9% drinking wine once a week, and 35.1% drinking less frequently. Preferred wine style was 50% red wine, 34/1% white wine, 13% rose wine, 2.9% sparkling, and 0% fortified wine. Most importantly, the range of ages included 14.4% of respondents between ages of 21 and 30 (58 respondents). These can be considered Millennials, because in 2008 they would have been born between the years of 1978 and 1987 which matches several expert definitions (Gillespie, 2010; Tapscott, 2008; Junco and Mastrodicasa, 2007). There were 346 respondents 30 years and over, the elders, who constituted 85.7% of the sample. The age characteristics of the sample are roughly comparable to the age distribution according to the US Census Bureau (2008), as shown in Table 1.
4. Results
The survey delved into the coping mechanisms used in conditions of uncertainty and the nature and extent of
information search undertaken by respondents. The data was split into two groups based on age. Respondents from 21 to 29 were in the Millennial group and those over 30 years old were in the ‘‘Elders’’ group. An independent sample T-test of the means was then performed on key variables to determine if there was indeed a difference in outcomes between Millennial and Elders.
4.1. Risk perception, social benefits, wine knowledge and pricing
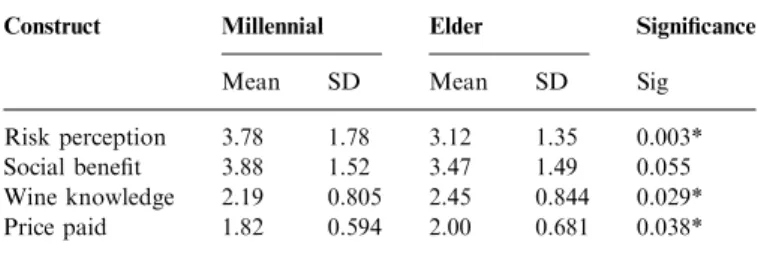
The results forrisk perception, social benefits, wine knowl-edge and pricing illustrate significant difference between Millennials and Elders in 3 of the 4 constructions as illustrated in Table 2. The risk perception for Millennials was signifi-cantly greater than the risk perception for elders (Mean—-Millennials¼3.78, SD¼1.78; Mean—elders¼3.12. SD¼1.35; p¼0.003). This indicates that Millennials are much more concerned with making a mistake in wine choice compared to older wine consumers.
Thesocial benefitfor Millennials was greater than the social benefit for elders, although not statistically significant (Mean—Millennials¼3.88, SD¼1.52; Mean—elders¼3.47. SD¼1.49; p¼0.055). This indicates that both Millennials and Elders are equally concerned about the impact of their wine choice on others in a social setting.
Self-reported wine knowledge was another area where the groups differed. The knowledge profile reported by Millen-nials was significantly lower that the knowledge profile reported by elders (Mean—Millennials¼2.19, SD¼0.805; Mean—elders¼2.45, SD¼0.844;p¼0.029). In their research on the effects of expertise on wine choice, researchers have shown perceived expertise to be a better predictor of the types of cues consumers utilize to choose a wine than objective expertise (Aurier and Ngabo, 1999).
Our analysis did show a significant difference in the price that each group generally paid for a bottle of wine. They were asked ‘‘How much do you usually spend on a bottle of wine for home usage?’’(1) less than $9.99, (2) $10.00–$19.99, (3) $20.00–$29.99 , or (4) over $30.00. The Millennials usually spend less than elders (Mean—Millennials¼1.82, SD¼0.594; Mean—elders¼2.00, SD¼0.681; p¼0.038). This is most likely because Millennials have less disposable income due to their young age.
Table 1 Sample demographics. Response (%) 2008 US Census (%) Gender Male 47.3 49.3 Female 52.8 50.7 Age group 21–29 14.3 19.3 Elders 85.7 80.7 30–39 18.8 18.2 40–49 26.0 20.0 50–59 16.6 18.1 60 and over 24.3 24.4 Consumption frequency Core 64.9 Marginal 35.1 Origin state California 16.5 Florida 9.8 New York 8.8 Pennsylvania 6.3 Texas 5.0 Colorado 4.0 Illinois 4.0 Ohio 4.0 New Jersey 3.8 Virginia 3.8 Washington 3.8 Michigan 3.5 North Carolina 2.8 Arizona 2.5 Massachusetts 2.3 Georgia 2.2 Idaho 2.2
33 other states, each less than 2%
Table 2
Significant differences between Millennials and Elders in risk perception, social benefit, wine knowledge and price paid.
Construct Millennial Elder Significance
Mean SD Mean SD Sig
Risk perception 3.78 1.78 3.12 1.35 0.003*
Social benefit 3.88 1.52 3.47 1.49 0.055
Wine knowledge 2.19 0.805 2.45 0.844 0.029*
Price paid 1.82 0.594 2.00 0.681 0.038*
4.2. Information search
The next area of research concerned the information search habits of Millennials and Elders as they cope with the risk perceived in the wine choice decision.Table 3and Fig. 1 illustrate where Millennials and Elders turn for information in making a wine choice. The results show that Millennials showed a demonstrably greater preference for gathering information from friends/family and from reading shelf talkers than elders, whereas elders relied more on store personnel, wine stewards, and the bottle label. The only source that both groups appeared to rely on equally, though to a small extent, was wine magazines. Another aspect of information search was examined by asking which information consumers use to gauge the quality of the wine inside the bottle. The customer typically is not able to sample the wine so he/she is faced with assessing the wine using external cues such as the information appearing on the label. Therefore respondents were asked to identify ‘‘Which of the following informa-tion do you evaluate on a wine label to gauge the quality inside the bottle? Check all that apply.’’ The results are illustrated in Table 4 and Fig. 2. Results of this analysis show that brand was the most utilized piece of information for both groups and each group used brand about equally (77.2% for Millennials—76.9% for elders). However from there, the picture changes with Millennials reporting they utilize alcohol content, label imagery, and medals won to a much greater degree than elders. Elders reported using country of origin, vintage, region, and state to a greater degree than Millennials. Appellation and organic were the
least used types of information for both, with Millennials using them more than elders.
5. Discussion
‘‘If we can understand how consumers choose wine, then we have a much better framework to decide pricing, packaging, distribution, advertising, and merchandising strategies’’ (Lockshin, 2003, p. 5).
5.1. Implications of findings on wine risk perception The major focus of this article is the impact of age on the consumer’s perception of risk and information search in the evaluation of wines. In terms ofrisk perception, there is significant difference between Millennials and Elders, as well as their reported wine knowledge and the amount of money they are will to pay for a bottle of wine. These results support the research literature, to some extent. For example Barber et al. (2006), found that younger sumers were more intimidated by wine than older con-sumers, yet Teagle et al. (2010) reported that Millennials were less risk adverse than their elders. Our findings are more in line with Barber et al. (2006), and indicate that Table 3
Wine information sources for Millennials and Elders. Source 21–29 Elders Store personnel 14.0 28.9 Newspaper 0.0 2.0 Wine steward 3.5 6.7 Bottle label 17.5 22.8 Wine mag. 5.3 5.0 Friends or family 36.8 18.7 Shelf talker 22.8 15.8
Fig. 1. Graph of wine information sources for Millennials and Elders.
Table 4
Importance of wine label information for Millennials and Elders.
Information 21–29 Elders Brand name 77.2 76.9 Vintage 47.4 52 Country of origin 47.4 57 Region 45.6 56.4 Alcohol content 40.4 19.9 Label imagery 40.4 21.9 Medals won 40.4 20.8 State 36.8 46.5 Appellation 21.1 19.3 Organic 14 7
Fig. 2. Graph of importance of wine label information for Millennials and Elders.
wine marketers need to take actions to help reduce perceived risks in wine purchasing with Millennials.
Millennials also reported they have less wine knowledge andpayless for a bottle of wine than older consumers. The fact that they are younger and generally make less money than consumers in their thirties and older most likely contributes to both of these findings. As Millennials gain more knowledge about wine, they may become more confident in their choices. Likewise as their disposable income grows with age and experience, it is expected that some of them will pay more for a bottle of wine.
Interestingly the results show that both Millennials and their Elders view thesocial benefitsof wine in almost equal levels. This suggests that consumers of all ages are concerned with the impact of their wine choice on others in a social setting. It is possible than when selecting a wine to drink at home in a family setting, that the stress of selecting the ‘‘right wine,’’ is diminished. Our findings show Millennials have a slightly higher concern for social benefits than elders (though not significant). This supports a study conducted by Orth (2005) showing younger individuals are more susceptible to the opinions of others and desire greater social benefits than older consumers.
5.2. Implications of findings on wine information search Providing product information, such as helpful labels, shelf-talkers, friendly retailers and recommendations from others can ease fears and increase the likelihood of purchase (Gluckman, 1990). Our findings support this statement, but highlight key differences in sources of informationused by Millennials and Elders. Results show that Millennials prefer to gather information from friends/ family and from reading shelf talkers to a greater extent than elders. This is consistent with US Millennials values of collaboration (Tapscott, 2008), and social networking via the Internet (Zickuhr, 2010). In many cases while shopping, Millennials will use smart phones to consult with friends on purchases as well as look up product information – similar to online shelf-talkers – to assist in purchase choice. Our findings are not consistent with previous research showing that younger wine consumers rely heavily on retail sales associates, wine writers, and labels (Chaney, 2000). However, they do support studies listing recommendation of friends as a coping mechanism (Spawton, 1991;Hall et al., 2004).
Elders, on the other hand, relied more on store person-nel, wine stewards, and the bottle label. This is more consistent with previous studies (Hall et al., 2004;Chaney, 2000), and suggests that the advent of portable technology may be changing the way US Millennials shop for wine to a greater degree than previously considered. The only source that both groups appeared to rely on equally, though to a small extent, was wine magazines. Since many of these are increasingly found online and can be accessed through smart phones while shopping, it is feasible that
they will continue to be an information resource for all ages, though not to the level of other information sources. When examining the wine label, specifically, as a source of information search, there is strong agreement between US Millennials and Elders that brand is the leading criteria for evaluating the quality of wine. This is supported by other studies showing that wine brand is important in wine purchase decisions (Lockshin et al., 2006; Lockshin and Spawton, 2001;Perrouty et al., 2006). This is understand-able, because research shows that consumers are able to develop trust with brands whose track records have pleased them before (Bruwer and Wood, 2005), and are more likely to shop for them when making a purchase decision.
Differences in the utilization of information became notable as we looked at how Millennials supplement the brand information. Here alcohol content, label imagery, and medals won are much more important to Millennials than Elders. This supports the findings of Thomas and Pickering (2003)where they found that alcohol level was seen as very important information for young wine drinkers, and could be a reflection of the perceived risk and lower confidence levels of that group. It could also be an indication of the purpose for which the Millennials are buying the wine—perhaps they want more alcohol for certain settings and less alcohol for others. This study also highlights the importance of attractive imagery on the label and promotion of medals for Millennials. Striking and colorful labels have also been identified in a recent study as important to Millennials (Henley et al., 2011). Perhaps in response to this, more wineries in the US are exhibiting medals on the front label, and are also incorporating vibrant and innovative labels and packaging.
Elders, on the other hand, reported using country of origin, vintage, region, and state as more important on the label more so than Millennials. This finding is consistent with other studies illustrating that region of origin is an important extrinsic cue and indicator of quality for many wine consumers (Lockshin and Rhodus, 1993; Duhan et al., 1999; Papadopoulos and Heslop, 2002; Jarvis and Rungie, 2002), but that it is less important to younger wine consumers (Hall et al., 2004).
Finally, appellation and organic designations on the label were the least used types of information for both groups. However, Millennials reported they use these more than elders. This could be because of their values of diversity (KeyFindings, 2004) and openness to purchasing products from many regions around the world, as well as their concern for the environment (Moriarty, 2004).
5.3. Managerial implications
In order to use marketing resources more strategically, the wine industry may benefit from promoting a different set of characteristics when trying to reach Millennials. The results presented here are important because wineries need
to know how to make wine more accessible to the Millennials by reducing purchase risks.
In terms of information sources, wine marketers may want to pay more attention to how they can have their wine recommended to Millennials by friends and families. Tactics could include more wine events and tastings with encouragement or incentives to spread the word. For example, recommending a friend to join a wine club could result in a gift from the winery. In addition, more strategic use of social networking sites and online media to target Millennials regarding wine options could be useful. Friends can ‘‘like’’ a wine or ‘‘recommend’’ a winery online, which could encourage wine purchases.
Since shelf-talkers were also identified as important to Millennials, wine marketers should focus on making these easy to read, attractive and accessible. They need to work with retailers to make sure they are positioned in the right location on shelves. Likewise, they could create electronic shelf-talkers using barcodes or QR codes so that Millen-nials could easily use their smart phones to look up information on the wine while shopping at a retail outlet or dining at a restaurant or wine bar.
In terms of wine label information, this study demon-strates that featuring alcohol content, label imagery, and medals won may help to attract Millennials. Therefore wine marketers will want to insure that this type of information and design is included on wines targeted at Millennials. In addition, they will want to work with retailers to accommodate consumer information needs. For instance, if high and low alcohol wines could be grouped together in order to make that pertinent informa-tion easier to find, it may assist with wine sales. Likewise, featuring gold medal winning wines in one location may also spur sales.
Finally marketers may want to reinforce the attitude that there is no wrong wine choice. This would serve to reduce intimidation and take advantage of the variety seeking attitude of Millennials.
6. Conclusion
6.1. Limitations
Although this study provides several new insights, it is not without its limitations. First, the study is focused on a geographically diverse sample of wine consumers in the USA. This is a useful sample for assessing wine decision-making habits but readers should recognize that it is not a totally random sample of the general population. It was obtained from a subset of wine consumers willing and able to take the survey on the internet.
6.2. Future research
The results of this study indicate several future research possibilities, including a qualitative analysis of reasons why Millennials use different information search
techniques compared to older consumer segments. This could be accomplished with in-depth interviews or focus groups. In addition, it may be fruitful to perform this survey on international samples to ascertain differences in attitudes and preferences of Millennials in other countries. Finally, it could be illustrative to compare difference groups of Millennials based on either state or country to ascertain if there are differences in risk perception and information search by geography.
6.3. Final conclusion
Tailoring brands to markets requires answers to questions concerning how segments differ in the benefits sought from a brand (Orth et al., 2004). The results of this study can be useful for the wine industry in general as a means for understanding how best to reduce risks and support wine information search for Millennials. It illuminates how age differences may affect the evaluation of wine quality in deciding which wine to purchase. For wine marketers, the results demonstrate the need for a targeted approach to their consumer segments. In order to reach younger customers, for instance, attractive label imagery and medals should be presented. Marketing efforts based upon place-of-origin may be best targeted at older consumers because they utilize geographical cues to a greater extent Millennials.
References
Atkin, T., Johnson, R., 2010. Appellation as an indicator of quality. International Journal of Wine Business Research 22 (1), 42–61. Aurier, P., Ngabo, P.V., 1999. Assessment of consumer knowledge and its
consequences: a multi-company approach. Advances in Consumer Research 26 (1), 569–575.
Barber, N., Almanza, B., Donovan, J., 2006. Motivational factors of gender, income and age on selecting a bottle of wine. International Journal of Wine Marketing 18 (3), 218–232.
Borstin, J. 2011. TV Content, Advertising are King, Smartphones on the Rise. CNBC. /http://www.cnbc.com/id/41372312/TV_Content_Ad vertising_Are_King_Smartphones_On_the_RiseS (retrieved on 16.01.2012).
Bruwer, J., House, M., 2003. Has the era of regional branding arrived for the Australian wine industry? Some perspectives. The Australian and New Zealand Grapegrower and Winemaker, 56–61.
Bruwer, J., Wood, G., 2005. The Australian online wine-buying con-sumer: motivational and behavioral perspectives. Journal of Wine Research 16 (3), 193–211.
Chaney, I., 2000. External search effort for wine. International Journal of Wine Marketing 12 (3), 5–15.
Charters, S., Thach, L., Fountain, J., Kolyesnikova, N., Ritchie, C., Dodd, T., Fish, N., Herbst, F., Terblanche, N., 2011. Generation Y and sparkling wines: a cross-cultural perspective. International Jour-nal of Wine Business Research JourJour-nal 2 (2), 161–175.
Cholette, S., 2004. A tale of two wine regions: similarities, differences, and trends in the French and Californian wine industries. International Journal of Wine Marketing 16 (2), 24–48.
Duhan, D.F., Kiecker, P.L., Areni, C.S., Guerrero, C., 1999. Origin information and retail sales of wine. International Journal of Wine Marketing 11 (3), 44–58.
Gillespie, J., 2010. Wine Market Council’s 2010 Consumer Tracking Study. Presentation at Wine Market Council Seminar, Santa Rosa, CA, January 2010.
Gluckman, R.L., 1990. A consumer approach to branded wines. European Journal of Marketing 24 (4), 27–46.
Hall, J., Binney, W., O’Mahoney, G.B., 2004. Age related motivational segmentation of wine consumption in a hospitality setting. Interna-tional Journal of Wine Marketing 16 (3), 29–43.
Henley, C., Fowler, D., Yuan, J., Stout, B., Goh, B., 2011. Label design: impact on millennials’ perceptions of wine. International Journal of Wine Business Research 23 (1), 7–20.
Howe, N., Strauss, W., 2000. Millennials Rising. Vintage Books, New York. Hussein, M., Cholette, S., Castaldi, R., 2007. Determinants of wine consumption of US consumers: an econometric analysis. International Journal of Wine Business Research 19 (1), 49–62.
Jacoby, J., Olson, J.C., 1985. Perceived Quality: How Consumers View Stores and Merchandise. Lexington Books, Lexington, MA. Jarvis, W., Rungie, C., 2002. Loyalty towards a well known brand or a
well known region? A conjoint approach using actual purchase data. In: Proceedings of the 27th World Congress of the International Office of Wine and Vine (OIV), Bratislava.
Johnson, R., Bruwer, J., 2007. Regional brand image and perceived wine quality: the consumer perspective. International Journal of Wine Business Research 19 (4), 276–297.
Junco, R., Mastrodicasa, J., 2007. Connecting to the Net.Generation: What higher education professionals need to know about today’s students. NASPA, Washington, DC.
Key Findings, 2004 November/December. Understanding the Millennials: Who They Are and How You Can Reach This Young, Affluent Market Segment. Key Findings Newsletter. Available at: /http:// www.keyfindings.com/healthcare/article2.htmS.
Kleber, 2009. Millennial White Paper—The Newest Generation Drama-tically Shifting the Consumer Landscape. /http://www.kleberandas sociates.com/wp-content/uploads/2011/01/KAMillennialsWhitePaper. pdfS(retrieved on 16.01.2011).
Lockshin, L., 2003. Consumer purchasing behavior for wine: what we know and where we are going. Marches et Marketing du Vin, Bordeaux Ecole de Management n57-03, Aout.
Lockshin, L., Rhodus, W., 1993. The effect of price and oak flavor on perceived wine quality. International Journal of Wine Marketing 5 (2), 13–25.
Lockshin, L., Spawton, A.L., 2001. Using involvement and brand equity to develop a wine tourism strategy. International Journal of Wine Marketing 13 (1), 72–81.
Lockshin, L.S., Macintosh, G., Spawton, A., 1997. Using product, brand, and purchasing involvement for retail segmentation. Journal of Retailing and Consumer Services 4 (3), 171.
Lockshin, L., Jarvis, W., d’Hauteville, F., Perrouty, J.P., 2006. Using simulations from discrete choice experiments to measure consumer sensitivity to brand, region, price and awards. Food Quality and Preference 17 (3/4), 166–178.
McCutcheon, E., Bruwer, J., Li, E., 2009. Region of origin and its importance among choice factors in the wine-buying decision making of consumers. International Journal of Wine Business Research 21 (3), 212–234.
Mitchell, V., Greatorex, M., 1989. Risk reducing strategies used in the purchase of wine in the UK. European Journal of Marketing 23 (9), 31–46.
Moriarty, R., 2004. Marketers target savvy ‘‘Y’’ spenders: Hip imagery, sophisticated sales pitches, web sites are designed to appeal to youth. The Post Standard February 8, 2004.
Mueller, S., Francis, L., Lockshin, L., 2008. The relationship between wine liking, subjective and objective wine knowledge: does it matter who is in your ‘consumer sample’? Paper Presented at the Academy of Wine Business Research (AWBR), Siena, Italy. 17–19 July.
Neuborne, E., 1999 February 15. Generation Y Today’s teens – the biggest bulge since the boomers – may force marketers to toss their old tricks. Business Week.
Nielson, 2007. US Millennials’ Alcoholic Beverage Attitudes and Usage Studied. /http://www.marketingcharts.com/television/us-millennial s-alcoholic-beverage-attitudes-and-usage-studied-2537/S(retrieved on 01.07.2010).
Olsen, J., Thach, L., 2001. Consumer behavior regarding wine consump-tion: a conceptual framework. Australian and New Zealand Wine Business Journal—Special Marketing Addition 16 (6), 123–129. Olsen, J., Thach, L., Nowak, L., 2007. Wine for my generation: exploring
how US wine consumers are socialized to wine. Journal of Wine Research 18 (1), 1–18.
Olsen, J., Thompson, K., Clarke, T.K., 2003. Consumers self-confidence in wine purchases. International Journal of Wine Marketing 15 (3), 42–50. Orth, U.R., 2005. Consumer personality and other factors in situational
brand choice variation. Brand Management 13 (2), 115–133. Orth, U.R., McDaniel, M., Shellhammer, T., Lopetcharat, K., 2004.
Promoting brand benefits: the role of consumer psychographics and lifestyle. Journal of Consumer Marketing 21 (2), 97–108.
Papadopoulos, N., Heslop, L., 2002. Country equity and country branding: problems and prospects. Brand Management 9 (4/5), 294–314.
Perrouty, J.P., d’Hauteville, F., Lockshin, L., 2006. The influence of wine attributes on region of origin equity: an analysis of the moderating effect of consumer’s perceived expertise. Agribusiness 22 (3), 323–341. Quester, P., Smart, J., 1998. The influence of consumption situation and product involvement over consumers’ use of product attribute. Journal of Consumer Marketing 15 (3), 220–238.
Spawton, T., 1991. Wine and the marketing mix. European Journal of Marketing 25 (3), 19–31.
Sweeney, J.C., Soutar, G.N., 2001. Consumer perceived value: the develop-ment of a multiple item scale. Journal of Retailing 77 (2), 203–220. Tapscott, D., 2008. Grown Up Digital: How the Net Generation is
Changing Your World. McGraw-Hill, New York.
Teagle, J., Mueller, S., Lockshin, L., 2010. How do Millennials wine attitudes and behavior differ from older generations? Refereed Paper—5th International Academy of Wine Business Research Con-ference, Auckland, New Zealand. February 8–10, 2010.
Thach, L., d’Hauteville, F., May 2008. Why French Gen Ys Don’t Drink Wine. Wine Business Monthly Online, May 5, 2008. /http://www. winebusiness.com/News/DailyNewsArticle.cfm?dataid=55252S (retrieved on 27.04.2010).
Thach, L., Olsen, J., 2006. Market segment analysis to target young adult wine drinkers. Agribusiness: An International Journal 22 (3), 307–322. Thach, L., 2005. How to Market to Millennials. Wine Business Monthly, December 15, 2005./http://www.winebusiness.com/wbm/?go=getAr ticle&dataId=41527S(retrieved on 16.01.2011).
Thach, L., June 2009. Tips to Market Wine to Millennials—An Emphasis on Wine 2.0. Wine Business Monthly. Available at /http://www. winebusiness.com/news/?go=getArticle&dataId=65623S.
Thomas, A., Pickering, G., 2003. The importance of wine label informa-tion. International Journal of Wine Marketing 15 (2), 58–74. Tustin, M., Lockshin, L., 2001. Region of origin: does it really count?.
Australia and New Zealand Wine Industry Journal 16, 139–143. US Census Bureau 2008./www.census.gov/compendia/statab/cats/popu
lation.htmlS(accessed 06.07.2012).
Verlegh, W., Steenkamp, J., 1999. A review and meta-analysis of country-of-origin research. Journal of Economic Psychology 20, 521–546. Wine Market Council, 2009. Wine Market Councils’ 2009 Consumer
Tracking Study. /www.winemarketcouncil.comS (retrieved on 22.12.2010).
Zeithaml, V., 1988. Consumer perceptions of price, quality, and value: a means-end model and synthesis of evidence. Journal of Marketing 52 (July), 2–22.
Zickuhr, K., 2010. Generations Online 2010 Report. Pew Internet Research. /http://pewinternet.org/Reports/2010/Generations-2010/ Overview.aspxS(retrieved on 16.01.2012).