PIASA: A power and interference aware resource management
strategy for heterogeneous workloads in cloud data centers
Altino M. Sampaio
a, Jorge G. Barbosa
b,⇑, Radu Prodan
ca
Instituto Politécnico do Porto, Escola Superior de Tecnologia e Gestão de Felgueiras, CIICESI, Felgueiras, Portugal b
LIACC, Departamento de Engenharia Informática, Faculdade de Engenharia, Universidade do Porto, Porto, Portugal c
University of Innsbruck, Institute of Computer Science, Innsbruck, Austria
a r t i c l e
i n f o
Article history:
Received 16 February 2015
Received in revised form 30 June 2015 Accepted 1 July 2015
Available online 17 July 2015 Keywords:
Performance interference Energy efficiency CPU-intensive load I/O intensive load SLA
QoS
a b s t r a c t
Cloud data centers have been progressively adopted in different scenarios, as reflected in the execution of heterogeneous applications with diverse workloads and diverse quality of service (QoS) requirements. Virtual machine (VM) technology eases resource manage-ment in physical servers and helps cloud providers achieve goals such as optimization of energy consumption. However, the performance of an application running inside a VM is not guaranteed due to the interference among co-hosted workloads sharing the same physical resources. Moreover, the different types of co-hosted applications with diverse QoS requirements as well as the dynamic behavior of the cloud makes efficient provision-ing of resources even more difficult and a challengprovision-ing problem in cloud data centers. In this paper, we address the problem of resource allocation within a data center that runs differ-ent types of application workloads, particularly CPU- and network-intensive applications. To address these challenges, we propose an interference- and power-aware management mechanism that combines a performance deviation estimator and a scheduling algorithm to guide the resource allocation in virtualized environments. We conduct simulations by injecting synthetic workloads whose characteristics follow the last version of the Google Cloud tracelogs. The results indicate that our performance-enforcing strategy is able to fulfill contracted SLAs of real-world environments while reducing energy costs by as much as 21%.
Ó2015 Elsevier B.V. All rights reserved.
1. Introduction
There is growing interest in the use of cloud computing, which has been progressively adopted in different scenarios, such as business applications, social networking, scientific computation and data analysis experiments[18,38]. However, clouds now host a wider range of applications with diverse resources and QoS requirements. From the consumers viewpoint, it is essential that the cloud provider offer guarantees about service delivery. Typically, consumers detail the required service level through QoS parameters, which are described in service level agreements (SLAs) established with providers[25]. More concretely, SLAs specify all the expectations and obligations of the service to be provided in terms of metrics as well the penalties for violating those expectations agreed upon by all parties. Thus, SLAs are a key element for supporting and empowering QoS in cloud environments.
http://dx.doi.org/10.1016/j.simpat.2015.07.002 1569-190X/Ó2015 Elsevier B.V. All rights reserved.
⇑ Corresponding author.
E-mail addresses:ams@estgf.ipp.pt(A.M. Sampaio),jbarbosa@fe.up.pt(J.G. Barbosa),radu@dps.uibk.ac.at(R. Prodan). Contents lists available atScienceDirect
Simulation Modelling Practice and Theory
j o u r n a l h o m e p a g e : w w w . e l s e v i e r . c o m / l o c a t e / s i m p a tProviding QoS guarantees in current cloud data centers is a very difficult and complex task due to the dynamic nature of the environment and the applications workload characteristics. The problem becomes even more complicated when consid-ering efficient resource usage and technological limitations. Cloud computing environments are very dynamic by nature in that end customers share a large, centrally managed pool of storage and computing resources. At any one time, a substantial number of end users can be inactive (e.g., submitted jobs just finished, low utilization due to specific day of the week), which allows a service provider to opportunistically consolidate, multiplex and even transfer resources among virtual machines rented to different users. Moreover, as operational costs become more relevant, the implementation of policies for maximiz-ing the efficiency, cost-effectiveness, and utilization of resources becomes paramount. However, balancmaximiz-ing QoS guarantees with efficiency and utilization becomes extremely challenging because virtualization does not guarantee performance iso-lation between VMs. For example, an applications performance can change due to the existence of other co-resident VMs that share the last-level cache (LLC). This phenomenon is known as performance interference[13,15,19,24]. Furthermore, different applications demand different QoS requirements. For example, non-interactive batches require completion time, while transactional web applications are concerned with throughput guarantees. Different application workloads demand a diverse type and amount of resources. In particular, batch jobs tend to be relatively stable, while web applications tend to be highly unpredictable and bursty[10].
In this paper, we present a dynamic resource management strategy that optimizes power efficiency and considers the SLAs of two different types of workloads: CPU-bound (i.e., batch jobs) and network I/O-bound (i.e., transactional web) appli-cations. We propose a mechanism that estimates the slowdown in co-hosted deadline-driven CPU-bound applications due to contention in on-chip resources and a second mechanism that responds to changes in demand for network I/O-bound appli-cations. A scheduler algorithm is also proposed to compensate for deviations from the required performance in both types of applications. The algorithm applies readjustments in the VM to PM mapping to correct such performance deviations. The assignment of resources to VMs is also refined to optimize the energy efficiency of the underlying infrastructure.
The rest of the paper is organized as follows. Section2discusses related work in the area of resource provisioning in cloud data centers. Section3introduces the architecture of the power- and interference-aware mechanism to address the QoS of heterogeneous workloads. Section4considers the metrics used to assess the performance of the proposed mechanism and describes the workloads and performance deviation characteristics. Section5presents and discusses the results. Finally, Section6concludes the paper and discusses future research directions.
2. Related work
Energy efficiency optimization and assurance of application performance have two opposite objectives. While energy wastages can be mitigated through consolidation, performance deviations are caused by interference among co-hosted applications due to technological limitations (i.e., inefficient virtualization isolation) or by abrupt demand variation in the workloads. The occurrence of either makes the previous provisioning of resources inappropriate, and corrective actions must be performed to fulfill the application QoS requirements. This section presents notable efforts to understand the causes of performance deviation in co-hosted applications and to define strategies to guarantee QoS requirements for diverse appli-cations while maximizing energy efficiency during runtime.
2.1. Performance interference estimation in virtualized environments
Determining the relationship between allocated resources and high-level metrics in a dynamic cloud environment is not trivial and has led to intensive research in related topics. For example, Koh et al.[19]have studied this phenomenon by mea-suring the effects of the consolidation of two VMs running diverse resource-bound applications (i.e., CPU, memory, and I/O). Key findings include the following: (i) the performance of I/O-bound applications degrades much less when co-located with CPU- or memory-bound applications; (ii) CPU- and memory-bound applications consume a large amount of CPU resources; and (iii) the correlation between workload characteristics and performance is not linear. Huang and Lee[15]analyzed the adverse impact of performance interference from a security perspective. For this purpose, the authors exhaust one type of hardware resource by co-locating a misbehaved VM with the victim VM in different configurations. The results show the following: (i) the TCP throughput can fall below 70% when the malicious VM uses memory intensively; (ii) the CPU execution time increases by 60% when a malicious VM uses the disk I/O intensively; and (iii) the memory bandwidth for the victim VM decreases from 20% to 80% when the malicious VM heavily uses disk I/O (the decrease is closer to 80% when the malicious VM uses network I/O). Mars et al.[24] explored the impact of contention in cache, memory bandwidth, and prefetcher resources in the performance of different types of applications. The authors showed that when the pressure in the cache exceeds saturation, the impact on an application QoS no longer increases. The experiments used real Google workloads and took place in a Google cluster. In addition, Hashimoto et al.[13]measured the performance degradation due to con-tention in network I/O, disk I/O, and on-chip resources. The results indicated that an application that uses more resources degrades more, and the impact on performance can change between 1% and nearly 190%. Additionally, the results indicate that running two programs with high memory usage or network I/O causes high overhead in the hypervisor. Kousiouris et al.
[20]studied the effect of critical parameters on the performance of VMs. Their study concluded that there is a nearly linear relationship between CPU share (i.e., quantum) and performance improvement. Additionally, application performance can
degrade by as much as 160%. The co-location of applications that are more CPU-intensive and less data-intensive results in the best performance, and the greatest impact on the performance of applications is from contention in LLC and memory bus resources. These studies have contributed important insights into the characteristics of applications and their relevance for co-hosting. This paper is complementary to these studies in that it uses their conclusions to better allocate resources to applications.
2.2. Interference-aware dynamic resources scheduling
With the objective of mitigating the performance degradation due to contention in hardware resources, several works have proposed quantifying and predicting the effects of interference from different types of resources so that appropriate actions can be taken by readjusting the map of VMs to physical resources. For example, Dwyer et al.[8]contributed a tool that measures the slowdown in the execution of CPU-bound applications. The slowdown is caused by the performance inter-ference among co-located workloads that share LLC resources. The authors report that the tool is able to determine the degradation within 16% of the true value, on average. The approach does not consider workloads with different QoS require-ments. Govindan et al.[11]proposed Cuanta, a practical technique for predicting performance degradation due to a shared processor cache for any possible placement of applications. The authors claim that the technique can be used to select the most efficient consolidation pattern according to required performance and resource constraints, achieving an average pre-diction error of less than 4%. Unlike our work, the root cause of performance deviation is due to cache interference only. Chiang and Huang [7] developed the Tracon framework to mitigate the interference effects from concurrent data-intensive applications. Their aim was to reduce the runtime and improve the I/O throughput for data-intensive appli-cations in a virtualized environment. Based on the application performance inferred from resource consumption observed from different VMs, the framework readjusts the provision of resources by invoking the interference-aware scheduler. Experiments considering data-intensive applications (e.g., bioinformatics, data mining, and video processing) showed that the framework is able to improve the application runtime by 50% and the I/O throughput by as much as 80% for data-intensive applications executing in VMs. The framework is interference-aware biased and, hence, does not implement energy-efficient strategies. Lim et al.[22]proposed the D-factor model, which models the problem of performance interfer-ence within a physical server based on a collection of multiple resource queues for which contention creates non-linear dila-tion factors in jobs. The authors test CPU- and disk I/O-bound applicadila-tions. Their key findings are that (i) multiple-resource contention creates non-linear dilation factors in jobs; (ii) there is a linear relationship between total completion time and individual completion times for the same type of job; and (iii) the co-location of workloads utilizing different system resources leads to the best efficiency. The authors claim that the proposed D-factor model is able to predict the completion time of coexisting workloads within a 16% error for realistic workloads. Our work is complementary in that it adds a mech-anism to make decisions based on noisy performance deviation data samples to fulfill diverse contracted SLAs according to mixed/heterogeneous application types and requirements, and it tries to optimize energy efficiency at the same time. Nathuji et al.[29]proposed Q-Clouds, a QoS-aware control framework that transparently provides additional resources as necessary to achieve a performance similar to that if the applications were running in isolation. The framework dynamically provides underutilized resources to improve system efficiency (in terms of the runtime of CPU-bound applications). A com-mon problem in these studies is that they either do not consider energy efficiency or their contribution to achieving it is unclear. Verma et al.[40]performed an experimental study about application performance isolation, virtualization overhead with multiple VMs, and scenarios in which applications are isolated from each other. From the insights obtained, the authors propose a framework and methodology for power-aware application placement for high-performance computing (HPC) applications that considers both CPU and cache size constraints. However, the work is based only on contention over CPU and LLC resources. The approach does not consider auto-scaling requirements of applications, nor does it readjust the pro-visioning of resources in the case of failure to meet the application QoS requirements. In[39], enterprise server web-based workloads were studied for the purpose of finding key characteristics for semi-static and static consolidation. The observa-tions indicated that the correlation between workloads should be considered so that SLA violation can be avoided when such workloads are placed together. Based on these findings, the authors proposed two consolidation algorithms, namely, Correlation-Based Placement (CBP) and Peak Clustering-Based Placement (PCP). While the former adds co-location con-straints between correlated applications to ensure that an application can be sized based on an off-peak value, the latter reserves additional capacity for each workload according to the size of the application to accommodate their maximum peaks. The study target was specific enterprise applications for which load behavior could be predicted for long periods, such as a day or a week, and statistical analysis was used to statically allocate applications to resources for long periods. In a dynamic system, such as the one considered in this paper, the statistical approach to determine capacity constraints is no longer valid[39], and therefore, we cannot directly compare our results to CBP and PCP algorithms. However, one of the main conclusions of the Verma et al.[39]study is that uncorrelated loads should be allocated in the same server. This feature has been followed in subsequent works, such as[10], and it is applied in our algorithm.
2.3. SLA-based resources scheduling
Other approaches for scheduling applications and provisioning resources in cloud computing environments consider the diversity of applications in terms of workload characteristics and QoS requirements. To this end, Rao et al.[31]developed a
QoS provisioning framework that provides adaptive multi-objective resource allocation and the service differentiation of multiple applications. It applies a hard limit over the CPU assigned to an application. However, the work does not consider the effective utilization of shared virtualized resources, it is limited to the regulation of a single resource, and it only con-siders the response time and deviation from the Service Level Objective (SLO) value. While their work focuses on responding to abrupt workload or capacity changes, our study aims at increasing profit by diminishing energy consumption. It also addresses the problem of resource allocation within a data center that runs different types of application workloads that are subject to performance deviations due to interference among co-hosted applications. Moreover, we consider different types of QoS requirements, and we extend the strategy of the hard limit by applying hard and soft limits to address the two types of resources, CPU and I/O bandwidth, in the management of network-intensive workloads. Garg et al.[10] pro-posed an admission control and scheduling mechanism to maximize the resource utilization and profit. At the same time, it ensures that the QoS requirements of users are met as specified in the SLAs. The mechanism considers multiple types of SLAs based on application requirements (i.e., two types of applications, namely, non-interactive and transactional). Our work is closely related to[10]in that we address the resource allocation problem within a data center that runs different types of application workloads. Therefore, we compare our algorithm to this work.
2.4. List of contributions
This paper proposes a mechanism to efficiently detect and mitigate occurrences of performance deviation during appli-cation runtime, which cause non-observation of appliappli-cation QoS requirements, while optimizing the energy efficiency of the system. The main contribution of this work is the design and implementation of a mechanism with the following features: A scheduling strategy for heterogeneous workloads in virtualized data centers, with different characteristics and specific
SLA requirements.
A mechanism to detect deviations in application performance requirements, even when performance data samples con-tain noise.
Consideration of multiple types of SLAs, according to mixed/heterogeneous application types and requirements. Support for auto-scaling of resources to satisfy SLAs and cope with peak time demands.
Support for mitigation of performance degradation caused by contention due to sharing of physical resources among co-hosted applications.
Optimization of energy efficiency by maximizing the utilization of cloud resources.
In addition to the above mechanism features, this work contributes a study of the trade-off between the opposing objec-tives of energy efficiency and performance improvement.
3. System model
This section provides a formal description of a power- and interference-aware cloud architecture that dynamically maps VMs to PMs to improve both applications’ QoS requirements and energy efficiency.
3.1. Cloud data center overview
We consider a private data center environment consisting of identical physical servers. It is assumed that each server is interconnected with a high-speed LAN network and high-bandwidth link to the Internet. The cloud provider manages its resources (e.g., virtual machine migration, signaling and control data) using a high-speed LAN linkN1, while the Internet link N2is utilized by cloud users to access cloud services. In this regard, overloading interfaceN1manifests itself in the overhead
of VM migration, while interfaceN2is one of the resources VMs directly utilize so cloud users can access the deployed
ser-vices. Each physical host in the cloud infrastructure has the same CPU capacityC, memory capacityR, LAN network band-widthN1, Internet network bandwidthN2, access to a shared storage spaceBfor storing the disk images of the VMs, and
an LLCL, such that for each physical server, Si¼ fC;M;N1;N2;B;Lg. In a typical usage scenario, users request services to deploy applications, and the cloud manager is responsible for evaluating the capacity required and for deciding whether to accept or reject the service requests according to the servers’ ability to guarantee QoS requirements. The cloud architec-ture, information flow, and key components involved in performance estimation, power-efficiency, and the scheduling of applications are illustrated inFig. 1 [34]. For simplicity, a VM encapsulates one single application or task and is the unit of migration in the system. Each application can be described by one of two possible types of workloads according to the most consumed resources: CPU-bound or network I/O-bound. Each type has different behaviors, characteristics, and QoS requirements. Each VM will run on top of one PM at a time, and multiple distinct VMs can be mapped to a single PM. The set of VMs constitutes the user’s virtual cluster execution environment. The two modules, power efficiency and perfor-mance deviation, continually monitor servers and running applications and dynamically update the maps of VMs to PMs to maintain the energy efficiency of the system and to fulfill the application’s QoS requirements.
3.2. Application overview
In this study, we consider two types of workloads that can be deployed by users in the cloud infrastructure, namely, CPU-bound and network-bound workloads.
3.2.1. CPU-bound workloads
Scientific computing involves the construction of mathematical models and numerical solution techniques to solve sci-entific, social and engineering problems. Recently, scientific computing has started to explore clouds in alternatives to tra-ditionally dedicated HPC infrastructures [38,18]. We model the execution of scientific applications as the problem of dynamically scheduling non-interactive batch jobs with specific CPU needs. Each jobj¼ ðCj;djÞis composed of a set ofl inde-pendent CPU-intensive tasks,
s
q2Cj;q2 f1;. . .;lg, and a deadline,dj. Here, the deadline is used as the QoS requirement for batch jobs. The task workload is expressed in Mflops. Once tasks are independent, the job deadline becomes the deadline of the longest task. Job deadlines become activated as soon as cloud users submit jobs.The submitted jobs and respective sets of tasks have heterogeneous resource requirements and varying deadlines. As doc-umented by Stillwell et al.[37], a task
s
can consume at most a maximum amount of resourcesmax rðs
Þto execute at the maximum speed. The value of this parameter is defined by the user. In turn, the deadlinedsto conclude the task defines the minimum execution speed and simultaneously constrains the minimum amount of resourcesmin rðs
Þto assign, as defined by Eq.(1). The amount of resources assigned to a task is expressed in Mflops/s.min rð
s
ÞP Wðs
;tÞ dstmeið1Þ wheretis the current time,Wð
s
;tÞis the remaining workload for tasks
at instantt, andmeirepresents the time overhead required for a VM to migrate from nodeeto nodei. Parametermeiequals 0 only when the task is scheduled for the first time. The slack time of tasks
is stated by Eq.(2)and defines the amount of extra time needed to complete the task by the ensemble deadlineds.slack time¼ ðdstmeiÞ
Wð
s
;tÞmax rð
s
Þ ð2ÞThose tasks for which Eq.(2)returns a negative value are cancelled, and the corresponding jobs are considered incom-plete, incurring an SLA violation. Assigning each task a CPU power betweenmin rð
s
Þandmax rðs
Þ, we are fulfilling the dead-line constraint given by Eq.(3) and, hence, satisfying the strict SLAs imposed on each job:FTð
s
Þ6ds ð3ÞwhereFTð
s
Þis the finish time of tasks
. Due to interference caused by the sharing of on-chip resources (e.g., CPU, LLC, and memory bandwidth), co-hosted tasks can suffer from performance degradation, which induces a slowdown of running appli-cations, ultimately resulting in a deviation between expected and delivered QoS.3.2.2. Network-bound workloads
Commonly commercial clouds have been built to support web and small database workloads[16]. Web systems are char-acterized by their dynamic changing of incoming workloads and VM resource variation and do not have a requested time or deadline. Mars et al.[24]propose that one way to measure the QoS of web servers is to measure the server throughput at different workload rates, namely, the maximum number of successful queries per second, as is the case in Google’s web search. According to Mei et al.[26], the performance of web servers is CPU bound under a mix of small files and is network bound under a mix of large files. This work considers the second case by assuming that web workloads are mainly charac-terized by network resource consumption (i.e., are network-intensive) and have residual CPU consumption. The CPU time consumed to process network requests can be divided into two major categories: the time spent establishing TCP connec-tions and the time spent transporting web file content[26]. Because the demand for resources changes abruptly with time, the amount of transferred network I/Obð
s
Þserved by a tasks
at each instant is given by Eq.(4).bð
s
Þ ¼ Xreq=tu
y¼1
hy ð4Þ
wherehyis the file size to transfer in each requesty. For each task, the number of requests per time unitreq=tuvaries with time, and the size of the file to transferhyin each request is assumed to be large and practically constant. Due to the fluc-tuating nature of web-based transactional workloads, the cloud must adapt to application demands by scaling dynamically and providing resources accordingly. For instance, a general web application presents a varying workload according to the number of users accessing it. The SLA agreement defines the performance requirement of web applications in terms of requests served within a certain period of time. The performance requirement can be translated to CPU capacityrð
s
Þand network I/O bandwidthbðs
Þ[6]. We assume that a request is not served by the web application if the CPUrðs
Þor network bandwidthbðs
Þcapacity allocated to tasks
is less than the required capacity at instantt. The QoS requirements are violated if a certain number of non-served requests, from the totalreq=tusubmitted to the web application within a time interval, exceeds the maximum specified by the SLA.3.3. Cloud manager
The cloud manager is the main component in the cloud computing management infrastructure. Its function is to contin-ually obtain the virtual and physical machine statuses, such as power consumption, and performance data to infer possible deviations in the task QoS requirements. Then, based on the information collected, the cloud manager makes decisions con-cerning opportunities to improve power efficiency or the need to readjust the allocation of resources to correct possible per-formance deviations. Energy efficiency is achieved by means of consolidation, transferring VMs from lower loaded PMs to other PMs so that the first PMs can transit to sleep mode. This method improves resource utilization by increasing the load rate of the active PMs[34], but it can result in high levels of performance degradation. In turn, performance deviations can be estimated based on techniques that differ according to the type of application under consideration.
3.3.1. Power-efficiency logic
An idle server represents 60–70% of the power consumed when it is fully utilized[12,43]. The power consumption in a computer node is mainly dictated by the CPU resource[3,4]. Thus, we consider only the CPU power consumption in our energy model to consolidate running VMs in servers. Then, a reduction in power consumption can be effectively achieved by switching idle PMs to sleep mode, incurring near-zero overhead[27]. The linear power model in Eq.(5)estimates the power consumptionPifor aPMi.
Pi¼p1þp2CPUi ð5Þ
whereCPUiis the CPU utilization for a given time interval, measured for a PMiat runtime, and varies within [0, 1]. Thep1 andp2 factors are the power consumption when PM is idle and the additional power consumption due to CPU utilization, respectively. Eq. (6) is the power efficiency of a PMi at a specific time interval and reflects how much useful work is produced for a given power consumption[42].
EPi¼
CPUi
p1þp2CPUi
ðp1þp2Þ ð6Þ
increases monotonically with CPU utilization, reaching 1 when CPU is 1. Servers running under low power efficiency are detected using a sliding window detection mechanism. Basically, a PMiis considered power inefficient if 3 CPU utilization samples fall below 0.55 of the maximum CPU utilization. Samples are taken at intervals of 1 min and analyzed within a sliding window containing 5 CPU utilization samples. We have chosen these values based on our previous study[33], which demonstrated that these values maximize the ratio of the amount of work performed to the consumed energy.
3.3.2. Performance deviation detection logic
Performance deviations can occur in the two types of workloads considered. In the case of CPU-intensive applications, the contention in shared on-chip resources causes a slowdown in the execution of tasks. Several studies and experiments
(e.g.,[8,11,22]) showed that it was possible to determine the slowdown in the execution of tasks due to performance inter-ference, with an average slowdown error of approximately 10%. Eq. (7) is the slowdown Dið
s
;tÞ experienced by a CPU-intensive tasks
in PMi. Diðs
;tÞ ¼ Wðs
;tÞ e riðs
Þ Wðs
;tÞ riðs
Þ Wðs
;tÞ riðs
Þ þe
ð7Þwhererið
s
Þandreiðs
Þare the expected and effectively obtained CPU resources (in Mflop/s) assigned to the tasks
, respectively. The parameterriðs
Þis obtained through state-of-the-art slowdown meters (e.g.,[8]), whilereiðs
Þis obtained by monitoring local resources and corresponds to how much CPU is being used. The performance deviationDiðs
;tÞ, that is, slowdown in the case of CPU-intensive applications, can be negative (i.e., the task is executing faster) or positive, and the same applies to the estimation error(i.e., the average error in slowdown samples plus random fluctuations).The same logic applies to network-intensive tasks, and the performance deviation is stated by Eq.(8).
Dið
s
;tÞ ¼bið
s
;tÞ beiðs
;tÞbið
s
;tÞ ð8Þ wherebið
s
;tÞandbeiðs
;tÞare the demanded and effectively assigned network I/O bandwidth (in Gbit/s) at instanttto tasks
running in nodei, respectively. Due to fluctuations, the performance deviation Diðs
;tÞcan be negative (i.e., the task is demanding for less I/O bandwidth) or positive when the demand exceeds the assigned I/O bandwidth.3.3.3. Performance enforcing logic for CPU-bound workloads
Application QoS requirements are difficult to satisfy because of the variability of workloads and unexpected performance deviations due to interference among VMs sharing on-chip resources. To address performance deviations in CPU-intensive applications, we deploy a module combining two blocks[32]: (i) Kalman Filter (KF) noise removal and (ii) the Linear Regression-based (LR) completion estimator. The simple Kalman filter[41]is a powerful estimator that has the ability to smooth noisy data and to provide reliable estimates of signals affected by indirect, inaccurate and uncertain observations (e.g., Gaussian noise). In turn, regression analysis[35]is a common statistical procedure to model relationships between variables. Its purpose is to predict dependent variableYbased on explanatory variableX, such thatY¼aXþb. The module is shown inFig. 2.
For each task, the performance deviation estimator module leverages the KF to eliminate Gaussian distributed unpre-dictable disturbances in slowdown data samples provided by upstream state-of-the-art tools (e.g.,[8]). At each sample time, the KF produces the estimated remaining workload using the slowdown estimation. Then, an LR is used to estimate the instant when the remaining workload is zero, i.e., the task finish time, based on the last three samples of the remaining work-load along time. The intersection of the LR line with the time axis gives the estimated finish time. Henceforth, the combina-tion of KF and LR will be referred to as the KFLR module.
3.3.4. Performance enforcing logic for network-bound workloads
To handle performance deviations in network-intensive workloads, the data samples containing CPU and network band-width resources are injected in two separate Kalman filters, as shown inFig. 3. Then, based on the output of the Kalman fil-ters, we define a soft limit of resources to assign for each VM. Basically, the soft limit implements a lower bound of bandwidth and CPU resource availability. The intention is to define what fraction of the bandwidth and CPU resources each VM can have when the PM is fully utilized or overloaded. Thus, in the case of resource contention among co-located VMs, the soft limit establishes the minimum resources guaranteed for each VM. In turn, a VM explores the concept of the hard limit, which implements an upper bound of resource consumption, and it is specified by the total amount of free resources in the PM. For example, if 500 Mbit/s of network bandwidth are assigned to aVM1(i.e., the soft limit is 500 Mbit/s) and there is a
co-hostedVM2that requires only 300 Mbit/s at a certain instant,VM1can use the remaining 200 Mbit/s from the total of
1 Gbit/s deployed by the PM, being the hard limit for PM1 700 Mbit/s. The same applies for the CPU resource. For a VM, if the Kalman filter estimates that the soft limit deviates 5% from the assigned amount of resources, the scheduling algorithm presented below is invoked to proceed with a mapping adaptation.
In this paper, KFIO henceforth represents the mechanism by which performance deviations are handled in network-intensive workloads.
3.4. Power- and Interference-Aware Scheduling Algorithm (PIASA)
In this section, we introduce our proposed scheduling algorithm to allocate applications in a power- and interference-aware manner. It extends the POFARE algorithm introduced in[34]by taking into account the interference among co-located tasks and the diversity of QoS requirements. The cloud manager considers power efficiency estimations and performance deviations provided by the modules described in Sections3.3.1 and 3.3.2. Because the problem of mapping the VMs to the PMs is NP-complete, the proposed algorithm is heuristic. For the incoming applicationsfj1;. . .;jkg, the cloud
manager creates and manages a set of virtual clusters, one for each user, to execute the workloads associated with the appli-cations. When invoked by the cloud manager, the algorithm selects, at each step, a VM to schedule and determines a des-tination PM.
3.4.1. VM selection
The algorithm creates a list of prioritized groups of tasksf
s
1;. . .;s
lkg. The priorities are, from highest to lowest: (1) per-formance deviation; (2) new tasks; and (3) running in a power-inefficient PM. In the first group (i.e., perper-formance deviation), network-intensive tasks have priority over CPU-intensive tasks, and the priority is reversed for other groups. The aim is to exploit the deadline of CPU-bound workloads and provide network-intensive applications with more stability, avoiding migration overheads, so they can serve more requests successfully. Network-intensive tasks are sorted in ascending order according to the difference between resource demand and assigned resources (Eq. (8)). Diðs
;tÞwill be negative when demand for resources is less than the assigned resources, zero when it is a new task, and positive if demand for resources is greater than the assigned resources. Thus, over-provisioned network-intensive workloads can release excessive resources to those that suffer from scarcity. In turn, CPU-intensive tasks in each group are sorted in ascending order according to their slack time (Eq.(2)). Tasks with negative slack time will be eliminated from the scheduling queue. These steps correspond to lines 3–6 of the algorithm PIASA described inAlgorithm 1.Algorithm 1. Power- and Interference-Aware Scheduling Algorithm (PIASA) 1:functionPIASA(pmList, taskList)
2: map NULL
3: taskList:remo
v
eTasksHav
ingNegativ
eSlackTimeðÞ 4: taskList:groupTasksByReasonðÞ5: taskList:sortTasksInGroupsByDemandDifferenceðnet typeÞ 6: taskList:sortTasksInGroupsByIncreasingSlackTimeðcpu typeÞ 7: for alltask2taskListdo
8: iftask:reasonIsPerformanceDe
v
iationðÞthen 9: ifgetNewProv
isionðtask;mapÞ ¼¼FALSEthen 10: iftask:getTaskTypeðÞ ¼¼cpu typethen11: getNewPMðpmList;task;mapÞ .try migration 12: end if
13: end if
14: whilemap:findTaskðtaskÞ ¼¼FALSEdo .no candidate PM 15: tempTask task:getNextCohostedTaskðcpu typeÞ
16: iftempTask¼¼NULLthen
17: break
18: end if
19: getNewPMðpmList;tempTask;mapÞ .tries to migrate co-hosted VM 20: ifgetNewPro
v
isionðtask;mapÞ ¼¼TRUEthen21: break
22: end if 23: end while
24: iftask:getTaskTypeðÞ ¼¼net typeandmap:findTaskðtaskÞ ¼¼FALSEthen 25: getNewPMðpmList;task;mapÞ
26: end if 27: else
28: getNewPMðpmList;task;mapÞ 29: end if
30: ifmap:findTaskðtaskÞ ¼¼TRUEthen 31: applyMapðmapÞ
32: end if
33: taskList:remo
v
eTasksðmapÞ 34: end for35:end function
3.4.2. VM deployment
After a VM is selected to be scheduled from the prioritized list in line 7 ofAlgorithm 1, the reason for scheduling is checked at line 8, and all PMs are evaluated with respect to performance, task resource requirements, and PM power efficiency. The scheduling of tasks due to performance deviation (line 8) is achieved based on the expansion or shrinkage
of resources (line 9). If the expansion of VMs proves to be impossible due to scarcity of resources, the algorithm proceeds in different ways according to the type of workload. For CPU-intensive workloads, the algorithm starts by trying to migrate the VM in line 11. If the migration overhead is greater than the slack time in line 14 (i.e., the task will not finish within the deadline), the algorithm tries to migrate co-located tasks (lines 15–19), starting with the CPU-bound task having the largest slack time until the released resources are sufficient to expand the degraded VM (line 20). For network-intensive workloads, the strategy is to migrate CPU-bound workloads (lines 15–19) less sensible to migration overheads in an attempt to free resources. If, however, freed resources are not sufficient for the network-bound application to expand in line 20, the algorithm tries to migrate the application in line 25. The functiongetNewPMretrieves the PM that provides the highest value for the interference-power metric (ip) given by Eq.(9):
ip¼maxfValueðiÞ;i¼1::hg ð9Þ ValueðiÞ ¼ EPi if Pn1 s¼1rið
s
;tÞ<a
Ii otherwise ( whereIi¼ 1 DiðtÞmaxDhðtÞ if workload is CPU-bound and
DiðtÞ>0
U
iðtÞ otherwise( ð10Þ
wherehis the number of servers. TheValueðiÞis given by the power-efficiencyEPi, defined in Eq.(6), if the usage resources
are below
a
, or byIi, the interference factor on machinei. Asa
increases and approaches 1,ipbecomes more power-aware biased, which means the algorithm tends to select the most power-efficient node to schedule the task. Instead, asa
tends to 0,ipis interference-aware biased, and the algorithm attempts to find the node with the least interference among the qual-ified candidates, thus providing better conditions to fulfill the task’s QoS requirements. The value ofa
can be dynamically adjusted at runtime depending on the status of the applications QoS deviations and the nodes’ power consumption.The interference factorIiof machineiis computed by the ratio of the average slowdownDiðtÞexperienced byiover the maximum average slowdown among all machines for CPU-bound workloads with positive slowdown. Otherwise, the parameterUiðtÞ, expressing the factor of consolidation and interference, defined by Eq.(11), is used.
U
iðtÞ ¼1ðn1Þ jHiðtÞj þ#Loadssn
2V
and HiðtÞ ¼#LoadsIO#LoadsCPU
ð11Þ
wheretis the current time instant,ðn1Þis the number of VMs running in serveri;HiðtÞis the heterogeneity degree and
#Loadssnis the number of loads of the same type as the task
s
nrunning in the PMi. The#LoadsCPUand#LoadsIOare the num-ber of CPU-bound and network I/O loads running on machinei, respectively.Vexpresses the number of VMs hosted in the PM running more VMs so that the values are normalized among all PMs evaluated. For example, if at instantta server hosts 3 CPU-bound tasks and 1 network-bound task and the cloud manager is trying to schedule a CPU-bound task, thenHiðtÞ ¼ 2 and#Loadssn¼3.Fig. 2.Performance deviation estimator module for CPU-intensive workloads.
In this regard,UiðtÞwill vary within [0, 1]. AsUiðtÞtends to zero, for a given machinei, itsValuedecreases, and the chance of being selected to run task
s
nalso decreases.UiðtÞtends to zero: (a) when the number of VMs iniincreases, so that the system will give preference to less-loaded machines; (b) as the heterogeneity degree decreases, meaning that the machine is balanced because workloads running in the server tend to be of a different type; and (c) as the type of tasks
nis of the same type of tasks running on PMi, i.e., the system will avoid hosting tasks of predominantly the same type. This last assumption follows from the fact that the impact in the performance of co-hosted workloads is alleviated if they show dissimilar resource needs[15,19]. The denominator 2Vforces the normalization of the equation, thus ranging within [0, 1].After the machine with the highestValueis selected, designated as PMi, the slowdown that task
s
nwill be subjected to depends on the load of the machine. For CPU-bound workloads, the slowdownbiis provided by Eq.(12).biðtÞ ¼
DiðtÞ if task
s
nis newDið
s
n;tÞ if shrinking=expanding taskmaxðDið
s
n;tÞ;DiðtÞÞ if migrating task 8> < >
: ð12Þ
whereDið
s
n;tÞis the slowdown for tasks
n andDiðtÞis the average slowdown experienced by the tasks hosted in PMi. Knowing biðtÞ, the scheduling algorithm is now able to estimate the additional amount of CPU resourcesDriðs
n;biðtÞÞto assign to tasks
nto mitigate the performance deviation, as expressed by Eq.(13):D
riðs
n;biðtÞÞ ¼Wð
s
n;tÞ biðtÞdsntmei
ð13Þ wheremei¼0 for a new or a shrink/expanded task. In the case of network-intensive workloads, the additional amount of bandwidth resourcesDrið
s
n;biðtÞÞto assign to tasks
n is given by Eq.(14)and is determined by the difference between the previously assigned resourcesbiðs
n;tÞand the demand for resources estimated by the Kalman filterbeiðs
n;tÞat instantt:D
riðs
n;biðtÞÞ ¼beiðs
n;tÞ biðs
n;tÞ ð14ÞNext, the algorithm determines the entire amount of resources needed to fulfill the QoS requirements of tasks during run-time. In the case of CPU-intensive workloads, Eq.(15)specifies that a task
s
can be deployed, or migrated, to a PMiat time tþmeiif the following conditions are met: (i) the node provides the minimum resourcesriðs
Þ þDriðs
;biðtÞÞrequired by the task during the dstmei time interval to execute the remaining workloadWðs
;tÞat instant t; and (ii) the required resourcesriðs
Þare not more thanmax rðs
Þto be executed by its deadline.ðrið
s
Þ þD
riðs
;biðtÞÞÞ ðdstmeiÞPWðs
;tÞrið
s
Þ þD
riðs
;biðtÞÞ6max rðs
Þð15Þ Finally, the scheduling algorithm checks whether candidate PMican provide the minimum resources required by task
s
, thus fulfilling Eq.(16)as follows:rið
s
Þ þD
riðs
;biðtÞÞ þ Xn1 s¼1rið
s
Þ6Ci ð16ÞwhereCirepresents the available capacity (i.e., CPU or network bandwidth) in nodei. At the end, the algorithm applies a cap resource usage to assign to tasks the strictly necessary amount of CPU to complete them by the deadline and the network bandwidth to maintain the throughput. The use of resource limiting was already demonstrated to be effective in the manag-ing of resources[34,36]. During execution, the cap parameter is dynamically updated to explore the available fraction of resources in the physical server.
4. Evaluation and simulation scenario
This section presents the metrics used to evaluate the performance of the proposed mechanism to address performance deviation and power inefficiencies. The workload characteristics and simulation scenario are described as well.
4.1. Performance metrics
We have defined the four main metrics to evaluate the performance of the algorithms in terms of energy efficiency and the capacity to fulfill the application’s QoS requirements: (i) completion rate of users’ jobs; (ii) service rate of transaction requests; (iii) ratio of useful Mflops processed to the energy consumed; and (iv) the working efficiency.
4.1.1. Completion rate of users’ jobs
The first metric applies to CPU-intensive workloads and measures the completion rate of users’ jobs. It is calculated as the ratio of the number of jobs completed by their deadline,JC, to the number of submitted jobs,JS. The metric is expressed as Eq.(17).
EJ¼
JC
JS
ð17Þ where theEJvalue falls in the interval [0, 1] and is the SLA metric for CPU-intensive applications. The percentage of SLA vio-lations is given byð1EJÞ 100.
4.1.2. Service rate of transaction requests
The second metric applies to network-intensive workloads and measures the percentage of SLA fulfillment by relating the number of applications that successfully served at least 95% of requests within a time unit.
ER¼RC
RS ð
18Þ whereRCis the number of requests that were successfully served andRSis the number of submitted requests. In other words, RCis a measure of the average throughput of VMs at different workload rates. TheERvalue falls within the interval [0, 1]. 4.1.3. Energy efficiency
The third metric calculates the amount of energy consumed in Joules to produce useful work. By useful work, we count the number of Mflops associated with successfully completed jobs only,JC. The energy efficiency metricEM, shown in Eq.(19), is calculated by dividing the sum of the workloads from all tasks of successfully completed jobs by the overall energy consumption. The energy is then calculated by multiplying the average power consumption of the computing infras-tructure (i.e., for all active physical nodesuat all sample timesf) by the number of sample timesf, multiplied by 60 (because samples are taken per minute):
EM¼ Pk j¼1hjPns¼1Wð
s
;0Þ Pf s¼1 Pu i¼1Pi u f f 60 hj¼ 1; if jobjcompleted 0; otherwise ð19ÞWe henceforth represent this metric as Mflops/Joule. 4.1.4. Working efficiency
The fourth metric determines the quantity of useful work performed (i.e., the completion rate of users’ jobs) by the con-sumed power. This is determined by multiplyingEJby the average power efficiency based on Eq.(6)for all active physical nodesi2 ½1;uat all sample timesf. Eq.(20)shows the calculation of the working efficiencyEW.
EW¼ Pf s¼1 Pu i¼1EPi u f EJ;
8
u6h ð20ÞEqs.(19) and (20)express the amount of useful work performed from different perspectives. The first equation quantifies the number of useful Mflops by the consumed energy, while the second equation measures the quantity of useful work (i.e., completion rate of users’ jobs) performed with the consumed power. A good algorithm must maximize both.
Maximizing the working efficiency implies diminishing the power consumption and increasing the number of completed jobs. Such a goal entails a trade-off between power-efficiency and performance interference. Power-efficiency can be achieved through a higher level of consolidation that, in turn, generally causes more performance degradation and thus neg-atively affects the rate of completed jobs.
4.2. Workload and performance characteristics
In this section, we describe the characteristics of the two types of workloads considered and of the performance interfer-ence incurred due to the consolidation of applications.
4.2.1. Workloads based on Google cloud tracelogs
Several recent comprehensive analyses (e.g.,[28,23]) of the workload characteristics derived from Google cloud tracelogs, featuring over 900 users submitting approximately 25 million tasks over a month, yielded significant data on the character-istics of submitted workloads and the management of cluster machines. These studies enable further work on important issues in the domain of resource optimization and energy efficiency improvement. The studies show that approximately 75% of jobs only run one task, and most of the jobs have less than 28 tasks that determine the overall system throughput. The job inter-arrival time is 4 s, with each job lasting an average of 3 min. The jobs follow distributions such as lognormal, gamma, Weibull, or even exponential. The majority of jobs run in less than 15 min, although there are a small number of jobs that run longer than 300 min. Moreover, the task length, number of tasks per job, and CPU utilization (varying from near 0% to nearly 25%) follow a lognormal distribution. Most of the tasks use less than 2.5% of the server’s RAM.
Based on these key findings, we created two sets of synthetic jobs. The first set contained 3614 CPU-intensive jobs to sim-ulate users’ non-interactive batch jobs, totaling 10,357 tasks, each with a deadline rounded up to 10% more than its mini-mum necessary execution time. The job deadline equals the deadline of the jobs longest task. The second set included 148 network-intensive groups of web applications and a total of 413 tasks. They are mostly network bandwidth consuming, and the required bandwidth due to oscillation in the number of requests per time unit and the file size to download varies randomly with time, following a lognormal distribution with an average value and a standard deviation of 52.5 and 265, respectively. Ersoz et al.[9]indicate that lognormal distributions model web server workloads well. The CPU consumption changes as well but in a residual way, following a lognormal distribution with an average value and a standard deviation of 4 and 3.5, respectively. In fact, it is common to observe CPU utilization for a web workload varying in the range 2–15%[1,2]. For both types of workloads, the runtime is specified by the user, and the VMs running them require a RAM size of 256, 512, or 1024 MB, selected randomly.
4.2.2. Performance interference characteristics
The behavior of co-located jobs is often described as non-deterministic and, hence, difficult to estimate[22]. However, recent research has shed some light on this subject. These studies have contributed several key findings that support the char-acteristics of performance interference among co-located VMs in the simulated cloud infrastructure. For example, Pu et al.
[30]indicate that interference is greater when two applications of the same type are co-located, sharing the same physical resources (i.e., contending for the same resources). Interference among CPU-intensive applications occurs mainly due to con-tention in the LLC and memory bus[8]and can degrade performance by imposing a slowdown of as much as 120%[11](some authors report even larger values[13]). Lim et al.[22]observed a linear relationship between total completion time and indi-vidual completion times, a relationship that is lost when different types of jobs co-execute in the system. Verma et al.[40]
observed that very large applications (in terms of working set size, i.e., the size of cache an application uses) are not affected by other workloads running on the same physical machine, and small applications do not suffer performance degradation as long as the sum of working set sizes remains less than the server’s cache. Moreover, the degradation in performance of appli-cations starts to stabilize (i.e., does not increase) when the pressure over the servers’ cache is double the capacity.
Based on these key findings, we have simulated performance interference among co-located CPU-intensive workloads. Basically, each CPU-intensive application utilizes a certain amount of cache to store data during runtime. Such an amount is determined by a Poisson distribution with a mean of 13% (an acceptable value considering current processors[17]) of the total physical cache. For example, Lei et al.[21]utilized a Poisson distribution to study LLC management strategies.
The degree of performance interference of an application depends on the applications working set size and the working set size of co-hosted applications. Specifically, our simulation model implements the following key findings[11,13,24,40]: (i) interference among co-hosted applications is residual (e.g., almost zero) as long as the sum of their working set sizes is less than the cache size; (ii) the performance of an application degrades as soon it draws closer to the size of the cache, and it tends to stabilize afterward as it moves away from that size; (iii) cache contention decreases CPU throughput (instructions dispatched per second), hence imposing slowdown in the execution of applications. The performance degradation of the applications hosted in the same PM is determined by eððx1Þ=2xÞ3
in the case in which the sum of the working sets size,x, is less than the PM cache size; and it is eððx1Þ=2x0:95Þ
otherwise. These expressions were inferred from the results presented in[24,29,40], andxis given in percentage form, so thatxwill be greater than 100% when the application requirements exceed the PM capacity. Because we assume that web applications are characterized mainly by netintensive work-loads, interference among co-hosted web applications is essentially caused by contention in the network I/O channel, being immune to on-chip interference.
4.3. Comparison of strategies
To assess the quality of the mechanism proposed in this paper, alternative mechanisms are implemented to compare their performance with that of our performance deviation estimator and scheduling algorithm.
4.3.1. Alternative performance deviation estimators
Three other common performance deviation detectors were implemented. For all strategies, data sample analysis is per-formed over a sliding window containing 5 performance deviation samples per minute, taken at constant intervals[34]. The threshold was set to 10% more than the task’s minimum necessary execution time. The first, Simple ThresholD (STD) VM adaptation, is triggered if 3 slowdown data samples exceed the predefined threshold value. The second mechanism, Average ThresholD (ATD), determines the average slowdown from samples within the window, and if the average value exceeds the predefined threshold value, condition detection is triggered. The third approach, Extended ThresholD (ETD), cal-culates the average slowdown from samples within 3 consecutive windows (each window differing from the prior one in one sample) and invokes the scheduling algorithm if the average result exceeds the mentioned threshold.
4.3.2. Alternative scheduling algorithms
Garg et al.[10]proposed a dynamic resource management strategy to handle scheduling of two types of applications, namely, compute-intensive non-interactive jobs and transactional applications such as web servers. The mechanism
responds to changes in transactional workloads and tries to maximize resource utilization while enforcing the SLA require-ments and specifications. A web VM is scheduled based on best-fit, not taking into account the resources consumed by VMs running dynamic jobs. To maximize the energy efficiency, the scheduler tries to explore free resources in nodes running web applications to schedule dynamic jobs. However, if free resources are insufficient to execute the task within its deadline, the job is allocated to another node in the form of a static job. Resources are transferred from dynamic jobs to web applications as demand changes. Periodically, the algorithm verifies the SLA accomplishment and realizes consolidation. The priority of scheduling is: (1) enforce SLAs; (2) schedule the jobs from the batch job queue; and (3) consolidation.
Our work is closely related to[10]in the sense that we address the resource allocation problem within a data center that runs different types of application workloads (i.e., CPU- and network-bound applications), aiming at maximizing resource utilization and profit and ensuring that the QoS requirements of users are met as specified in SLAs. To achieve these objec-tives, dynamic resource allocation and consolidation are implemented. Unlike our work, Garg et al.[10]do not consider per-formance deviation due to contention in on-chip resources (e.g., LLC and memory bus). Moreover, our mechanism is able to (i) implement dynamic vertical elasticity of resources, (ii) make resource allocation decisions based on noisy performance deviation data samples, and (iii) balance energy efficiency and performance in the execution of applications.
4.4. Simulation setup
Because the target system is a cloud computing infrastructure and the functionality of re-sizing a VM dynamically, as required by the proposed resource management algorithm, is unavailable in production clouds, we resorted to simulation to evaluate the algorithms discussed in this paper. Simulation allows us to perform a statistically significant number of experiments for a wide range of application configurations in a reasonable amount of time. Due to the limitations of current simulation software programs, such as CloudSim[5], that do not support dynamic VM re-sizing, we have implemented our own discrete-event simulation software that was validated in our previous work[33,34]. Events are generated statistically following distributions observed in previous work. The workload is based on the Google Cloud trace logs (details in Section4.2.1); the interference characteristics were derived from[24,29,40](details in Section4.2.2); and VM migrations follow the characteristics presented in[14].
We simulated a cloud data center infrastructure aggregating 50 homogeneous physical servers. Each server contains a CPU with a capacity assumed to be 800 Mflops/s with an electrical power consumption of 275 W when fully loaded. Parametersp1 andp2 for Eq.(5)were defined as 0.7 and 0.3[3,4], respectively. The bandwidth of the network interfaces for a server was considered to be 1 Gbit/s. The scheduling algorithm has no knowledge of when applications are submitted to the cloud or of the change in workload demands. Each VM requires a RAM size of 256, 512, or 1024 MB, randomly selected; the migration overhead of the VM depends on the memory size and the available network bandwidth in the LAN link[14], considered here as taking 8, 10 and 12 s, respectively. In simulations considering network-intensive applica-tions, all the tested algorithms reserved 15% for free bandwidth in every PM to better accommodate abrupt oscillations with-out migration.
5. Results and analysis
In this section, we present and discuss the results associated with the proposed mechanism to detect and mitigate per-formance deviations and power inefficiencies. In our simulations, we first assess the effectiveness of the proposed perfor-mance estimator and scheduling algorithm to handle CPU-bound workloads. Then, we investigate how well the mechanism performs in fulfilling network-intensive application QoS requirements and in accommodating the variations in workload demands. The last section analyses the effectiveness of the proposed mechanism in building energy-efficient virtual clusters that fulfill the dissimilar types of QoS requirements of heterogeneous applications.
5.1. CPU-bound workloads
This set of simulations intends to analyze the performance of the slowdown estimator and scheduling algorithm in the provision of resources to CPU-intensive jobs.
5.1.1. Performance of the scheduling algorithms
Table 1shows the results for the performance of scheduling algorithms in the absence of interference among co-hosted CPU-bound workloads (i.e., the applications do not experience slowdown during runtime). Provisioning of resources consid-ers power-efficiency optimization. Because Garg et al.[10]works based on the best-fit approach and does not consider the slowdown for scheduling of tasks, we defined the parameter
a
for Eq.(9)as 1.0 to make PIASA power-efficiency biased and to provide a fairer comparison. The results show that PIASA achieves the same completion rate of jobs as Garg et al.[10]but improves the energy efficiency and working efficiency by approximately 20.6% and 21.8%, respectively. This means the PIASA strategy can produce the same work with CPU-bound workloads as Garg et al.[10]while consuming less energy, as shown in columnEðMJÞof the table. The reason is that PIASA achieves higher levels of consolidation due to the use of the cap param-eter, thus using a lower average number of PMs during simulation,Av
g#PMs, and, hence, consuming less energy.Table 2registers the results for scheduling algorithms when co-hosted tasks experience performance interference. For the reason indicated above, we set up
a
¼1:0. The PIASA algorithm is combined with the KFLR slowdown estimator to address possible slowdown situations in the execution of tasks. The upstream slowdown meter provides slowdown data samples with an average slowdown error of 10% and a standard deviation of 20%. As observed, the performance of the Garg et al.[10]algorithm degrades substantially because it ignores the slowdown in the execution of tasks due to performance inter-ference. In turn, the PIASA strategy is able to complete more than 95% of the submitted jobs (i.e.,EJ), largely outperforming Garg et al.[10], which is able to complete only 12.2% of jobs. Comparing these results with those for absence of performance interference (i.e.,Table 1), it is obvious that PIASA now uses, on average, more physical nodes during simulationA
v
g#PMs. The increase was nearly 24%. Due to the slowdown in the execution of tasks, more resources are allocated to VMs to re-establish the required levels of QoS, resulting in a higher average number of active servers during simulation. If more physical servers are active, more energy is consumed. ColumnEðMJÞconfirms this fact, showing an increase of 34%. 5.1.2. Performance of the slowdown estimatorsThis section analyses the efficacy of the proposed slowdown estimator mechanism introduced in Section 3.3.3. Simulations are carried out by combining different slowdown estimator alternatives with the PIASA algorithm, which per-forms better as observed in Section5.1.1. The upstream state-of-the-art slowdown meter provides slowdown data samples with an average slowdown error of 10% and a standard deviation of 20%. The
a
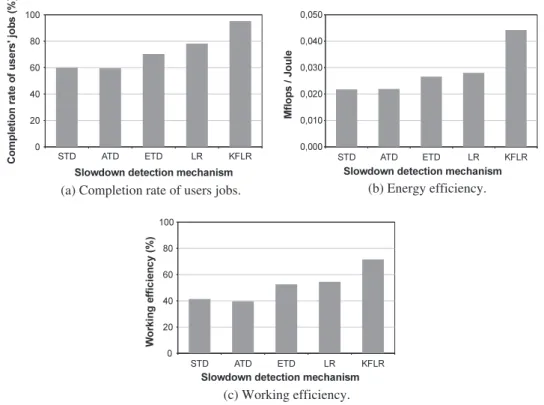
parameter in Eq.(9)was set to 1.0 (which represents the case in which more performance interference occurs due to a high level of consolidation to improve energy efficiency). In Fig. 4(a), we see that KFLR completes nearly 96% of jobs, which is approximately 17.9% more than LR and approximately 37.1% more than the common STD method. The STD and ATD methods are both very sensitive to slowdown measurement fluctuations because they respond too quickly to threshold violations. As a result, nearly 38% more VM migra-tions are triggered compared to PIASA, which leads to an inferior rate of completed jobs due to migration overhead. In turn, ETD seems to react too late, triggering VM migrations when tasks are no longer able to be completed by their deadlines.The KFLR achieves superior performance compared with all the other slowdown estimator techniques. Compared to LR, the better results for KFLR are from the removal of noise from slowdown data samples before their use by LR. Moreover, with KFLR, the slowdown of tasks during runtime is less than 8% on average than the slowdown evidenced by LR.Fig. 4(b) and (c) quantify the useful work performed by the consumed energy and power, respectively. Again, we observe that KFLR is the estimator that performs better, delivering more work with less energy consumption. Compared to other estimators, this property suggests that KFLR provides higher confidence levels, resulting in better decisions despite the noisy slowdown data samples and thus outputting a better jobs-completed-to-energy-consumption ratio. The STD and ATD methods present the worst results forEWandEM.
5.1.3. Performance impact of the Average Slowdown Error (ASE)
The slowdown meter proposed by Dwyer et al.[8]has an Average Slowdown Error (ASE) of 10%, which is the value we have used so far. Other researchers propose alternatives with different ASEs[11,22]. This section evaluates the efficacy of the proposed performance and energy efficiency enforcing mechanism (i.e., PIASA combined with KFLR) while varying ASE in data samples provided by upstream state-of-the-art slowdown meters.Table 3shows the evolution for theEJ;EM;EW perfor-mance metrics and the average estimated system slowdownb. The results show that the higher the uncertainty in slowdown
data samples provided by upstream slowdown meters, the more difficult it is to make the right decision (the producedb
reaches higher values as uncertainty increases). This explains why the completion rate of user jobsEJdecreases as ASEs aug-ment, with a consequent negative impact on energy efficiencyEM and working efficiencyEW. However, it is important to observe, based on the results, that our mechanism can be applied effectively if we consider that upstream state-of-the-art slowdown meters (e.g.,[8,11,22]) can estimate the slowdown of applications with ASEs equal to or less than 10% and that SLA contract terms in real-world environments allow a mean performance degradation of 1–5%[3].
Table 1
Performance of scheduling algorithms in the management of CPU-bound workloads, applying power optimization only (i.e., without slowdown). Thea parameter in Eq.(9)was set to 1.0.
Algorithm EJð%Þ EM EWð%Þ EðMJÞ Avg#PMs
Garg et al.[10] 100.00 0.0572 59.23 114.7 7.61
PIASA 100.00 0.0690 72.15 95.2 6.10
Table 2
Performance of scheduling algorithms in the management of CPU-bound workloads, with interference among co-hosted tasks and applying power optimization (noisy slowdown samples with an average error of 10% and a standard deviation of 20%). Theaparameter in Eq.(9)was set to 1.0.
Algorithm EJð%Þ EM EWð%Þ EðMJÞ Avg#PMs
Garg et al.[10] 12.2 0.0023 8.29 114.7 7.61
5.2. Network-bound workloads
Table 4shows the results for the performance achieved by the proposed mechanism to address netintensive work-loads. The QoS requirements are specified by users, but the characteristics of the workload demands are unknown, changing according to what is described in Section4.2.1. The goal is to assess the efficacy of the mechanism to enforce the QoS require-ments of applications for which workload demands change abruptly. Unlike Garg et al.[10], our strategy (i.e., KFIO combined with the PIASA scheduling algorithm) performs dynamic consolidation of workloads that, combined, may exceed the total available resources in the host, such as bandwidth and CPU. The cloud manager module invokes the scheduling algorithm to readjust the VM to PM mapping if the performance deviates at least 5% from the figure previously specified in the last schedule.
The results show that the PIASA algorithm outperforms the Garg et al.[10]strategy, providing sufficient resources to approximately 95.2% of applications so that they can successfully serve at least 95% of user requests. Because PIASA uses
(a) Completion rate of users jobs.
(b) Energy efficiency.
(c) Working efficiency.
Fig. 4.Comparison among slowdown estimator mechanisms in the management of CPU-bound workloads combined with the PIASA scheduling algorithm (noisy slowdown samples with an average error of 10% and a standard deviation of 20%). Theaparameter in Eq.(9)was set to 1.0.
Table 3
Performance of PIASA + KFLR in the management of CPU-bound workloads while varying the average slowdown error in data samples provided by state-of-the-art upstream slowdown meters. Theaparameter in Eq.(9)was set to 1.0.
ASE (%) EJð%Þ EM EWð%Þ b 5 97.29 0.0475 75.41 20.37 10 95.60 0.0452 69.21 22.30 15 92.20 0.0413 67.51 25.36 20 85.50 0.0346 61.68 29.06 25 73.36 0.0247 51.47 32.32 Table 4
Performance of scheduling algorithms in the management of network-bound workloads that present oscillations in demand of resources (requested bandwidth oscillations with an average value of 0% and a standard deviation of 15%). Theaparameter in Eq.(9)was set to 0.50.
Algorithm 100% P95% P90% P85% <85% EðMJÞ
Garg et al.[10] 0.0% 3.2% 36.1% 30.0% 30.7% 262.1
additional resources to supply the increase in user demands and thus fulfill the applications QoS requirements, achieving a higher rate of successfully served requests, more energy is consumed. This fact is reported in the last column ofTable 4.
InFig. 5, the bandwidth characteristics during a fraction of the runtime of a VM hosting a web application are plotted. The y-axis represents the percentage of bandwidth of the physical server the VM utilizes, and the simulation time, for which each time unit corresponds to 11 real seconds, is plotted on thex-axis. The bandwidth varies with time, according to the number of requests per time unit and the size of the file to download, as described in Section4.2.1. The ‘‘Demanded’’ bandwidth accounts for the bandwidth required at each time unit. The ‘‘Utilized’’ bandwidth represents the bandwidth the application was able to use during runtime (a VM is able to use more than the initially assigned amount, as long as the physical server contains free resources), while the soft limit expresses the minimum guaranteed bandwidth the algorithm decided to assign to the application. ‘‘Scarcity’’ is the difference between the resources demanded and utilized, and ‘‘Wastage’’ is the difference between the soft limit and the demanded resources.
Fig. 5also shows that the proposed mechanism is able to detect performance deviations that can be caused by: (1) scar-city of resources, when applications demand more resources than are initially assigned, or (2) wastage of resources, if ini-tially assigned resources exceed application needs. For example, the line ‘‘Scarcity’’ was always kept at 0, which indicates that the mechanism was able to expand the resources assigned to the VM. Even in the case of the abrupt increase in ‘‘Demand’’ that occurred between interval 1060 and 1070, the proposed mechanism proved to be effective in reacting on time by assigning more resources, as demonstrated by the ‘‘Soft limit’’ line. In addition, the mechanism demonstrated aware-ness of the excessive amount of resources assigned to the VM, as indicated by the ‘‘Soft limit’’ line, which falls during appli-cation runtime. For this case, the ‘‘Wastage’’ line demonstrated that 95.6% of the time, the excess of resources was less than or equal to 5%, and wasted resources of only 2% or lower were observed 74.6% of the time.
Fig. 6draws the CPU resource characteristics for the same fraction of the runtime of the VM hosting the web application. They-axis represents the percentage of CPU of the physical server the VM utilizes, and thex-axis contains the simulation time. The CPU resource consumption varies with time according to workload needs. The figure shows that the proposed strategy successfully fulfilled the workload demand in terms of CPU. Moreover, in the specific case of this network-intensive application, the mechanism did not miss or waste any CPU capacity, which in the last case means that freed resources were available for other applications.
5.3. Mixture of CPU- and network-bound workloads
This section assesses the efficacy of the proposed mechanism to enforce the diverse QoS requirements of applications with heterogeneous workloads while optimizing the energy efficiency of the system. The process of provisioning of resources considers two types of workloads: CPU- and network-intensive workloads. The application QoS requirements are specified by users, but the change in workload demands and performance deviations during runtime are unknown and follow the characteristics described in Section4.2.1. Because the level of consolidation is very low for
a
¼0, the effects produced by the mechanism to optimize the power-efficiency are irrelevant. In this sense, the consolidation mechanism was switched off fora
¼0, thus stabilizing the whole system by restricting the number of migrations for power-efficiency reasons.Table 5shows the impact of the variation in parameter
a
of Eq. (9)in the performance of the proposed mechanism (KFLR + KFIO + PIASA). TheH stands for the average load heterogeneity degree (a concept that was initially described inSection3.4.2), measured for all servers along the simulation. As mentioned previously, as
a
tends to 1, the mechanism tends to be more power aware and hence concerned with power-efficiency. In turn, asa
tends to 0, the mechanism is interference-aware biased, hence prioritizing the fulfillment of application QoS requirements over power-efficiency objec-tives. The results demonstrate the trade-off between the consolidation of VMs to improve power-efficiency versus higherFig. 5.Dynamic adjustment of bandwidth for a VM running a network-bound workload. The deviation threshold beyond which an adjustment was triggered was set tod¼5%. Theaparameter in Eq.(9)was set to 0.50.
levels of fulfillment of application QoS needs. For example, in the case of
a
¼1:00, which leads Eq.(9)to be power-efficiency biased, the mechanism achieves the best results in terms of the relationship between Mflops per JouleEMand work produced (i.e., completion rate of jobs) for average power consumptionEW. However, the amount of CPU-intensive jobs completedEJ and the number of network-intensive applications successfully serving more than 95% of requestsERare the lowest for alla
, representing 95.3% and 86.9%, respectively. Two factors explain these results forEJandER. The first regards the consolidation levelVMs=PM, which increases asa
evolves from 0 to 1. Performance interference follows the same tendency, as more tasks sharing the node’s resources represent more interference. The second factor relates to the higher average heterogeneity level valueHobserved during application runtime, which means that more workloads of the same type are consolidated per node,t