2
Existing Conditions
2.1 OVERVIEW
The City of Wadena is predominantly located in central Minnesota, on the western edge of Wadena County. The community is situated in an area that transitions from the eastern deciduous forest to the northern coniferous forest. The natural features of the area consist of rolling hills, lakes and wetlands, and large wooded areas. Much of the land surrounding Wadena is farmed and the economy of the region is supported mainly by agriculture. However, tourism has become an important aspect of the region due to the presence of large lakes and natural areas. Many visitors come to the region during the summer and fall months. Although the majority of the City of Wadena is located in Wadena County (See Figure 2-1), portions of Wadena, west of 11thStreet SW, are within
Otter Tail County.
This chapter reviews existing conditions within the City of Wadena including existing land use and zoning, demographics, economics, and physical characteristics. T he compilation of the existing elements provides a snapshot of the community, the issues within, and an understanding of how the community has changed over the years.
This section of the plan addresses the following elements: • Historical Assessment • Demographics • Economic • Physical Characteristics • Natural Resources • Cultural/Recreational Resources • Existing Zoning
• Existing Land Use • Educational Institutions • Emergency Services • City Facilities
• Parks and Open Space • Utilities
2.2 HISTORICAL ASSESSMENT
The name Wadena is an Ojibwa word meaning “Little Round Hill”, probably referring to the bluffs along the Crow Wing River where the original town site was located. Along the Otter Tail Trail, Wadena was founded as a trading post that thrived between 1855 and 1872. During this time more than 100 people lived inside the post. The railroad was built through the unsettled area in 1872, and Wadena was moved 15 miles to the west to its current location.
The City of Wadena was established in 1874 and became the Wadena County seat. Shortly following the incorporation of the City, a school and courthouse were built. The strategic location of the community made it a regional economic farm hub. Wadena served as a trade center for Wadena County and neighboring counties of Todd, Cass, and Otter Tail.
Historically, a number of major traffic routes in central Minnesota have passed through, or adjacent to, Wadena. For example, of the three main canoe routes connecting the Twin Cities to Pembina, North Dakota, one passes near Wadena. T his route would become a common conduit for other modes of transportation as time progressed. For example, the canoe path would later be used to establish a route for the Red River ox carts, only to be followed by the Northern Pacific Railroad Company as it expanded westward. As transportation advanced and the highway era began, U.S. Highway 71 (connecting the Gulf of Mexico to Canada) and U.S. Highway 10 (connecting the east and west coasts) were built, and came to intersect Wadena. Why Wadena was named the county seat is apparent, and it remains a t rade center for the county region.
2.3 D
EMOGRAPHICS
P
OPULATIONReview of the historic population trends, gender, and age groups of a community provides an insight into the changes that have occurred throughout the area.
Historic
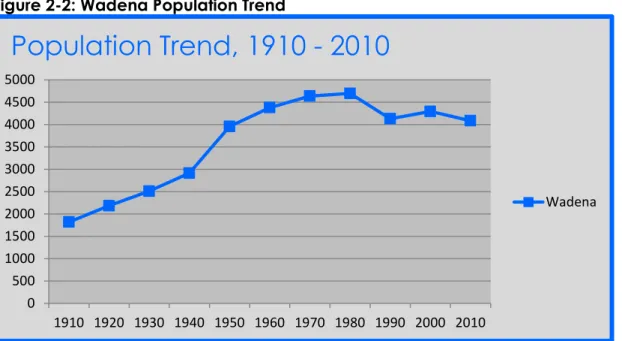
According to the 2010 census, Wadena's population was 4,088, which is a decrease of more than 200 people from the 2000 census. The largest decline during the past 50 years of Wadena's history was between 1980 and 1990, when the population declined by nearly 600 people, a population decline of more than 12 percent. It appears that some of this decline can be attributed to a population shift from the city to the surrounding rural area, although data has not been collected to determine exactly when that shift occurred. As shown in
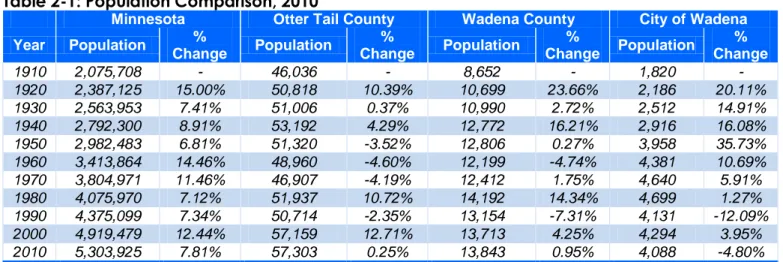
Figure 2-2 and Table 2-1, the city experienced population growth from 1910 to 1980, before falling in 1990.
Figure 2-2: Wadena Population Trend
0 500 1000 1500 2000 2500 3000 3500 4000 4500 5000 1910 1920 1930 1940 1950 1960 1970 1980 1990 2000 2010
Population Trend, 1910 - 2010
WadenaTable 2-1: Population Comparison, 2010
Minnesota Otter Tail County Wadena County City of Wadena Year Population % Change Population % Change Population % Change Population % Change 1910 2,075,708 - 46,036 - 8,652 - 1,820 - 1920 2,387,125 15.00% 50,818 10.39% 10,699 23.66% 2,186 20.11% 1930 2,563,953 7.41% 51,006 0.37% 10,990 2.72% 2,512 14.91% 1940 2,792,300 8.91% 53,192 4.29% 12,772 16.21% 2,916 16.08% 1950 2,982,483 6.81% 51,320 -3.52% 12,806 0.27% 3,958 35.73% 1960 3,413,864 14.46% 48,960 -4.60% 12,199 -4.74% 4,381 10.69% 1970 3,804,971 11.46% 46,907 -4.19% 12,412 1.75% 4,640 5.91% 1980 4,075,970 7.12% 51,937 10.72% 14,192 14.34% 4,699 1.27% 1990 4,375,099 7.34% 50,714 -2.35% 13,154 -7.31% 4,131 -12.09% 2000 4,919,479 12.44% 57,159 12.71% 13,713 4.25% 4,294 3.95% 2010 5,303,925 7.81% 57,303 0.25% 13,843 0.95% 4,088 -4.80%
The City of Wadena experienced rapid growth rates for many decades, slowing in the 1960s and 1970s followed by a slight decline in the past 30 years. The population of Wadena County has followed a similar trend. Figure 2-3 is a graphical representation of the rise and fall of the populations of the City of Wadena, Wadena County, and neighboring Ottertail County (a portion of the city of Wadena is located in Ottertail County) beginning in 1890 and leading up to the present day. The City of Wadena comprises approximately 30 percent of the population of Wadena County. As the population of the City of Wadena slowly declines, the population of Wadena County slowly increases or stays constant, indicating that some people are migrating outside of city limits to alternative rural housing opportunities. This trend is similar in Otter Tail County for the same time period, as shown in Table 2-1. During the histroic growth period of the City of Wadena from 1930 to 1970, both counties experienced little growth or declining populations. This trend may be the result of people moving into urban areas from rural areas in the County.
Figure 2-3
Current
The most recent census data shows that more than 1,100 people live in the two-mile extraterritorial area (ETA) surrounding Wadena, and nearly another 1,500 people live in the two miles surrounding the ETA. T his additional population of 2,605 in the four-mile area surrounding Wadena adds a population representing nearly 64 percent of the city's population of 4,088 to the immediate service area surrounding Wadena. Table 2-2 shows this information.
Table 2-2: Population of Wadena and ETA, 2010
Area Total Population
by Area Difference
City of Wadena 4,088 - City + ETA 5,199 1,111 City + ETA + 2 miles 6,693 2,605
When compared with other communities of similar size in the region, Wadena's population trend is very similar to the recent population trend of Staples, Minnesota, which is located approximately 17 miles to the southeast along TH 10 (see Figure 2-4). A lthough Staples has a smaller population than Wadena, it experienced a similar population decline between the 2000 and 2010 census. Of the seven communities compared, only Wadena and Staples experienced a decline during this time period.
0 10000 20000 30000 40000 50000 60000 70000 1890 1900 1910 1920 1930 1940 1950 1960 1970 1980 1990 2000 2010
City to County Population Comparison, 2010
Wadena Wadena County Otter Tail County
Figure 2-4: Population Comparison by City
To estimate what the population of Wadena will be in 20-25 years, 5 percent, 10 percent, and 25 percent growth scenarios were projected, as shown in Table 2-3. Population increase is shown in five-year increments. T hese growth scenarios are compared against population projections from the Minnesota Demographer and a decreased population trend based upon historical regression. The growth projections of 5 a nd 10 p ercent during the next 20-25 years represent a very conservative population increase which is in line with past trends.
Table 2-3: Wadena Population Trends
Trend 2010 2015 2020 2025 2030 2035 Minnesota Demography 4, 088 4,115 4,140 4,170 4,140 4,135 5% 4,088 4,130 4,170 4,210 4,250 4,290 10% 4,088 4,170 4,250 4,335 4,415 4,495 25% 4,088 4,290 4,495 4,700 4,905 5,110 Historical Regression 4,088 4,075 4,065 4,020 3,975 3,935
A
GED
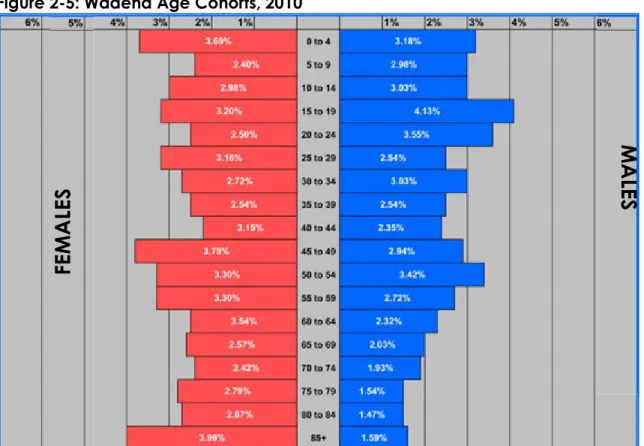
ISTRIBUTIONThe population pyramid below in Figure 2-5 shows City of Wadena residents as a percentage of the population that falls into each age cohort. Characteristics demonstrated by the population pyramid include:
0 2000 4000 6000 8000 10000 12000 1900 1910 1920 1930 1940 1950 1960 1970 1980 1990 2000 2010
Population Comparison by City, 2010
Wadena Alexandria Perham Staples Long Prairie Detriot Lakes Park Rapids
• The life expectancy of females far exceeds that of males, which has generally been a t rend in the United States over the course of the last 50 years.
Figure 2-5: Wadena Age Cohorts, 2010
• The influence of the Baby Boom and Echo Boom generations are represented as the spikes in populations between 45-59 years old and 15-29 years old, respectively.
• One interesting characteristic is the higher number of males in the 15-19 and 20-24 age groups. This could be due to the type of courses offered by the Minnesota State Community and Technical College in Wadena or the types of jobs available in the community.
Based on the population pyramid, the population of Wadena generally appears stable. Population pyramids that are top heavy show a growing population, as the highest percentage of population is in the younger age groups. A declining population is represented by a bottom heavy pyramid, in which the oldest age cohorts hold the largest percentage of the population. Figure 2-5displays neither a top or bottom heavy pyramid.
The average age for a male living within the city is 39.85 while the average female age is 45.55, the difference of which can be explained by the higher survival rates of
FEM
A
LES
M
A
LE
S
older female age cohorts. The pyramid is fairly balanced with 51.83 percent of the population being over 40 years of age.
G
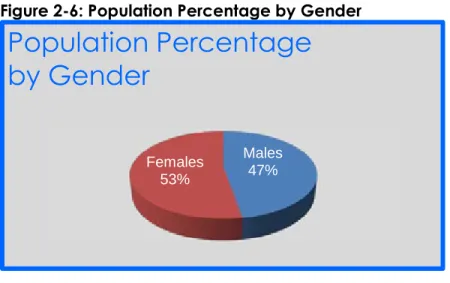
ENDERAs shown in Figure 2-6, the 2010 census indicated that Wadena's total population is comprised of 53 percent females and 47 percent males. This breakdown is typical of many Minnesota communities, although Wadena's gender disparity appears somewhat greater than Minnesota as a whole, which consists of 50.4 percent female and 49.6 percent male.
Figure 2-6: Population Percentage by Gender
R
ACIALC
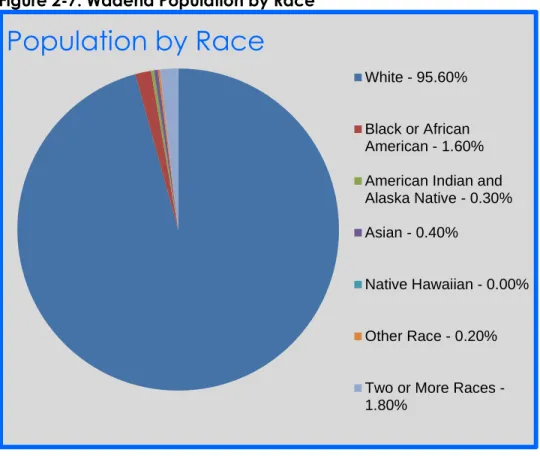
OMPOSITIONNot unlike most of the rural areas in northern Midwestern states, Wadena has a population primarily composed of Caucasians, which are mainly descendent from Germanic and Scandinavian origins. These were some of the first settlers to migrate to central and northern Minnesota in the mid-19th century. Figure 2-7 shows the
breakdown of the population of Wadena by race, according to the 2010 census. A slight change in the racial composition of the community occurred between 2000 and 2010. Over the last decade, the white population decressed by 2.2 percent, while the Black or African American and Asian populations increased.
Males 47% Females 53%
Population Percentage
by Gender
Figure 2-7: Wadena Population by Race
H
OUSEHOLDSAs shown in Figure 2-8, the 2010 census indicated a total of 2,010 dwelling units in Wadena. At that time, 1,840 dwelling units were occupied, leaving a t otal of approximately 170 vacant dwelling units. Occupied housing units in the surrounding two-mile and four-mile area are shown in Table 2-4. The two-mile ETA adds another 23.6 percent to the city's occupied dwelling units with 435 occupied dwellings. In the two-mile area surrounding the ETA, there are another 517 dwelling units. The four-mile area surrounding Wadena increases the occupied dwellings by 52 percent, with another 952 units. T his brings the total number of occupied dwelling units in Wadena and the surrounding four-mile area to 2,792 in the year 2010.
Table 2-4: Occupied Dwelling Units, Wadena and Surrounding Area, 2010 Census
Area Total Units Total Occupied
Dwelling Units Difference
City of Wadena 2,010 1,840 -
City + ETA 2,527 2,271 431
City + ETA + 2 miles 4,357 2,792 521
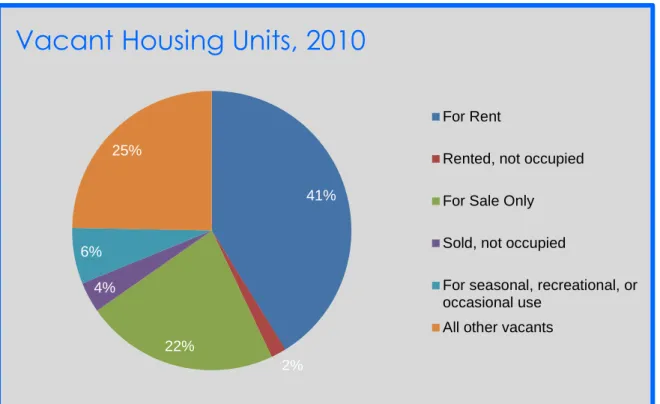
More than 12 percent of Wadena’s housing units were vacant based on the results of the 2010 Census (See Figure 2-8). Some of the vacant dwelling units in Wadena could be related to college students and the time of year during which census data
Population by Race
White - 95.60%
Black or African American - 1.60% American Indian and Alaska Native - 0.30% Asian - 0.40%
Native Hawaiian - 0.00%
Other Race - 0.20%
Two or More Races -1.80%
was collected, when certain housing units have been only temporarily vacant. More than 22 percent of the 170 vacant units were for sale during the 2010 census (38 units). Other vacancies were documented for seasonal, recreational, or occasional use, sold but not occupied, or rented but not occupied. Nearly a fourth of the vacant dwelling units (42) simply identified a vacant unit for no particular reason.
Figure 2-8: Wadena Vacant Housing Units
Figure 2-9 displays vacant parcels platted within city limits according to data received from the City of Wadena in the summer of 2012. Vacant parcels for this data set are defined as parcels with no built structure or an uninhabitable structure. According to this data, 310 parcels are vacant. Of these vacant parcels, 214 do not have municipal water or sewer connections, 21 have municipal sewer connections but are not connected to water, and 75 are connected to municipal sewer and water. Some of the vacant parcels are located in the path of the 2010 tornado. Of these parcels, a few are situated between two parcels with structures that were repaired or rebuilt following the tornado. T hese parcels are more challenging to develop due to the existing context, which consists of mainly smaller lots in older neighborhoods.
41% 2% 22% 4% 6% 25%
Vacant Housing Units, 2010
For Rent
Rented, not occupied For Sale Only Sold, not occupied
For seasonal, recreational, or occasional use
H: \P roj ec ts\ 75 86 \D es ign \G IS \m xd \F igu re X , E xis tin g V ac an t P ar ce ls
Occupied Parcels
Vacant Parcels
No Water or Sewer
No Water, with Sewer
Water and Sewer
Street not Constructed
City Limits
County Border
Figure 2-10 shows the breakdown of population living in owner occupied housing versus rental housing according to the 2010 census. Approximately 0.5 percent of the population was unaccounted for in this data (154 people). The percentage of the population living in owner occupied housing (63.5 percent) versus renter occupied housing (33 percent) is very typical of many cities throughout the United States. As the City of Wadena grows, land designated for rental housing (typically medium/high density) and owner-occupied housing (typically low density residential) should be proportionally developed to provide housing opportunities for all income and lifestyle categories of new residents.
Figure 2-10: Wadena Population in Owner vs. Rental Occupied Housing
In 2000, the average household size in the City of Wadena was 2.2 people, which decreased to 2.14 people in 2010. A similar trend was observed regarding the average family size, which fell from 2.92 people in 2000 to 2.86 people in 2010.
2.4 ECONOMIC
I
NCOME ANDE
MPLOYMENTAccording to the 2010 Census, the average monthly earnings in Wadena County was $2,778 whereas the State of Minnesota averaged $4,343. This equates to an
2,595 people, 63.5% 1,339 people, 33%
Wadena Population in Owner vs. Rental
Housing, 2010
Population in Owner-Occupied Housing
Population in Renter-Occupied Housing
average yearly income of $33,336 and $52,116, respectively. The average new hire in Wadena County earns $1,988 per month, or $23,856 yearly. These incomes in Wadena County are indicative of a substantial blue collar workforce which would also include small family farmers. D epending upon size and employment status, some individuals and families are below the national average yearly income, which is $34,575 a year for a four-person family. Most, however, are likely considered middle class, which is often true of families with two income earners.
According to the Minnesota Department of Employment and Economic Development, the September unemployment rate for Wadena County was 6.8 percent (See Figure 2-11). This rate is the fourth highest in the State of Minnesota, which has an unemployment rate of 5.8 percent. Otter Tail County’s unemployment rate (4.6percent) is lower that the State of Minnesota and the Nation (7.8 percent).
Job Trends
Figure 2-11 was compiled using data from the Minnesota Department of Employment and Economic Development. It shows the unemployment rate from October of each year from 1990 to 2011. O verall, Wadena County has experienced a higher unemployment rate with greater fluctuation than that of Otter Tail County. T he unemployment rate for Wadena County in October of 2011 was 6.5 percent, while the rate for Otter Tail County was 4.8 percent. Even though the unemployment rate for Wadena County is relatively high, it is still lower than the national average.
Figure 2-11: Unemployment Rate by County
M
AJORE
MPLOYMENTS
ECTORSThe data shown in Table 2-5 was collected from the Minnesota Department of Employment and Economic Development for the first quarter of 2012. It compares the employment and wages by industry for the City of Wadena, Otter Tail County and Wadena County. Within the City of Wadena, the greatest number of people are employed in the Trade, Transportation, and Utilities Industry, while this category employs the second greatest number of people in both counties. Employees within the Utilities Industry earn the greatest hourly wage within the City of Wadena, which aligns with the employees within Wadena County. The Finance and Insurance Industry earns the highest hourly wage in Otter Tail County. The City of Wadena has the highest average annual salary of the three jurisdictions across the industries studied. 0 2 4 6 8 10 12 19 90 19 91 19 92 19 93 19 94 19 95 19 96 19 97 19 98 19 99 20 00 20 01 20 02 20 03 20 03 20 04 20 05 20 06 20 07 20 08 20 09 20 10 20 11 U nem po ym en t Ra te
Wadena Unemployment Rate
by County, 2010
Wadena County Otter Tail County
Table 2-5: Employment and Wages Earned by Industry, First Quarter of 2012
Industry
City of Wadena Otter Tail County Wadena County Employment Hourly Wage Annual Salary Employment Hourly Wage Annual Salary Employment Hourly Wage Annual Salary Manufacturing 229 $13.30 $27,664 3,654 $17.38 $36,140 495 $14.35 $29,848 Trade, Transportation and Utilities 1,027 $17.45 $36,296 4,343 $16.00 $33,280 1,328 $16.10 $33,488 Utilities 40 $35.60 $74,048 - - - 20 $35.60 $74,048 Wholesale Trade 397 $22.15 $46,072 571 $19.08 $39,676 429 $22.03 $45,812 Transportation and Warehousing 109 $18.60 $38,688 - - - 228 $14.98 $31,148 Financial Activities 105 $18.55 $38,584 626 $19.70 $40,976 161 $18.08 $37,596 Finance and Insurance 98 $19.35 $40,248 539 $21.43 $44,564 141 $18.75 $39,000 Real Estate and
Rental and Leasing 7 $7.45 $15,496 87 $9.03 $18,772 19 $14.00 $29,120 Professional and Business Services 69 $18.88 $39,260 1,037 $17.55 $36,504 - - - Professional, Scientific, and Technical Services 23 $11.10 $23,088 450 $17.78 $36,972 28 $11.45 $23,816 Education and Health Services 989 $18.23 $37,908 6,198 $15.58 $32,396 2,463 $17.95 $37,336 Leisure and Hospitality 264 $4.43 $9,204 1,652 $5.43 $11,284 352 $4.63 $9,620 Arts, Entertainment, and Recreation - - - 179 $5.58 $11,596 26 $6.08 $12,636 Accommodation and Food Services 257 $4.50 $9,360 1,472 $5.43 $11,284 326 $4.50 $9,360 Other Services 96 $7.48 $15,548 678 $9.53 $19,812 154 $12.93 $26,884 Public Administration 215 $21.00 $43,680 1,099 $20.63 $42,900 263 $19.33 $40,196 Total Employment/ Average Wage or Salary 3,925 $15.87 $33,010 22,585 $14.29 $29,725 6,433 $15.38 $31,994