Profiling user-trigger dependence for Android
malware detection
*
Karim O. Elish
a, Xiaokui Shu
a, Danfeng (Daphne) Yao
a,*,
Barbara G. Ryder
a, Xuxian Jiang
ba
Department of Computer Science, Virginia Tech, 2202 Kraft Dr, Blacksburg, VA 24060, United States bDepartment of Computer Science, North Carolina State University, Raleigh, NC 27606, United States
a r t i c l e i n f o
Article history:Received 29 May 2014 Received in revised form 25 August 2014
Accepted 1 November 2014 Available online 14 November 2014
Keywords:
Malware detection User-intention Static program analysis Android malware User-trigger dependence
a b s t r a c t
As mobile computing becomes an integral part of the modern user experience, malicious applications have infiltrated open marketplaces for mobile platforms. Malware apps stealthily launch operations to retrieve sensitive user or device data or abuse system re-sources. We describe a highly accurate classification approach for detecting malicious Android apps. Our method statically extracts a data-flow feature on how user inputs trigger sensitive API invocations, a property referred to as theuser-trigger dependence. Our evalu-ation with 1433 malware apps and 2684 free popular apps gives a classificevalu-ation accuracy (2.1% false negative rate and 2.0% false positive rate) that is better than, or at least competitive against, the state-of-the-art. Our method also discovers new malicious apps in the Google Play market that cannot be detected by virus scanning tools. Our thesis in this mobile app classification work is to advocate the approach ofbenign property enforcement, i.e., extracting unique behavioral properties from benign programs and designing corre-sponding classification policies.
©2014 The Authors. Published by Elsevier Ltd. This is an open access article under the CC BY-NC-ND license (http://creativecommons.org/licenses/by-nc-nd/3.0/).
1.
Introduction
Malicious mobile apps and vulnerable mobile computing platforms threaten the confidentiality of personal and orga-nization data and device integrityDavi et al. (2010); Enck et al. (2010). Malicious applications can exfiltrate sensitive data, abuse of system resources, and disrupt the normal usage of the device. With the increased connectivity to organizational
networks, vulnerable smartphones increase the attack sur-face of organizations, threatening the security of systems and data at a grand scale. Recent studies show that there exist hundreds of thousands of unique Android malware samples belonging to over 300 malware familiesforti-guard. Because of the pervasive use of Android as a mobile operating system (over 50% market share in western and some Asian countries), solutions for detecting malicious applications in the Android marketplace are urgently needed. Our work presents a new
* A preliminary version of the work appeared in the Proceedings of the IEEE Mobile Security Technologies (MoST) workshop, in conjunction with the IEEE Symposium on Security and Privacy. San Francisco, CA, USA. May 2012Elish et al. (2012). This work has been supported in part by Security and Software Engineering Research Center (S2ERC), an NSF sponsored multi-university Industry/University Cooperative Research Center (I/UCRC), NSF grant CAREER CNS-0953638, and ONR grant N00014-13-1-0016.
*Corresponding author. Tel.:þ1 (540)231 7787.
E-mail addresses:[email protected](K.O. Elish),[email protected](X. Shu),[email protected](D.(D. Yao),[email protected](B.G. Ryder),jiang@cs. ncsu.edu(X. Jiang).
Available online at
www.sciencedirect.com
ScienceDirect
journal homepage: www .e lsev ie r.com/locate/cose
http://dx.doi.org/10.1016/j.cose.2014.11.001
0167-4048/© 2014 The Authors. Published by Elsevier Ltd. This is an open access article under the CC BY-NC-ND license (http:// creativecommons.org/licenses/by-nc-nd/3.0/).
quantitative program analysis approach for detecting mali-cious Android applications that achieves a higher accuracy than previously reported classification methods.
Classification solutions have been proposed to model and approximate the behaviors of Android apps and distinguish malicious apps from benign ones. Classification decisions are made by analyzing apps'static (e.g., Grace et al., 2012b) or dynamic (e.g.,Amos et al. 2013) behavior features. Static fea-tures can be extracted from intermediate code representa-tions obtained through decompiling Android Dalvik bytecode. Dynamic features are collected by observing the run-time behaviors of the program. Various types of features can be extracted from Android permission, code, or execution for app classification.
The detection accuracy of a classification method depends on the quality of the features, e.g., how specific the features are. The accuracy of existing Android classification solutions is still far from ideal. The state-of-the-art classification with pure static features gives a false negative rate (i.e., missed detection, FN) of 9%Grace et al. (2012b). These features are extracted through data- and control-flow analyses. Hybrid features (i.e., a combination of static and dynamic features) extracted from programs give a better FN rate 4.2%Zhou et al. (2012)(e.g., dynamic features related to dynamic code loading and native code invocation). Most of the dynamic classifica-tion soluclassifica-tions give 10% or higher false positive rates (FP) while trying to maintain a reasonable FN rate, e.g., 10% FP inShabtai et al. (2012)and 15% FP inAmos et al. (2013). The false positive rate tells the percentage of benign apps wrongfully classified as malicious.
This work presents a high-precision Android app classifi-cation method based on one complex feature that leverages the dependence effects of program behaviors. Specifically, we extract the definition-and-use (i.e., def-use) data dependence properties related to sensitive operations and theiruser trig-gersin the app. Smartphone apps (Android, iOS, or Windows Phone) are unique in their user-centered and interaction-intensive design, in which operations typically require initia-tion by users'specific actions (or triggers). Our classification leverages the dependence relations between user inputs/ac-tions and sensitive API calls providing critical system func-tions. Our feature extracted from programs reflects the expected causal relations in the execution.
Our classification recognizes legitimate and desirable behavioral patterns in programs, as opposed to identifying
malicious patterns.Those behaviors are commonly found in
trustworthy programs, but not in malware. Our classification is based on whether or not a program possesses these benign properties.
Specifically, we analyze the def-use graph to extract a TriggerMetric feature for each API call. The TriggerMetric feature statically approximates whether or not the occur-rences of the call (i.e., call sites) are triggered by the user. Specifically, the TriggerMetric value represents the number of validcall sites among all the call sites of a specific API. The validity of an API call is defined based on def-use semantics; a call isvalidif at least one of the call's arguments depends on some user input(s). In other words, the TriggerMetric values of an app reflect the degree of sensitive operations that are triggered or intended by the user. The classification decision is
made based on TriggerMetric values (i.e., an app is classified as malware if it has an overwhelming number of triggerless sensitive operations).
Our contributions are summarized as follows.
We present a new Android app classification method that usesonecomplex feature rather than multi-feature as in the existing malware detection methods which focus on the presence of simple features such as permission or API call. TheTriggerMetricfeature captures the static depen-dence relations between user inputs/actions and sensitive operations providing critical system functions in pro-grams. This feature is extracted through nontrivial Android-specific static program analysis and is used in several quantitative analytical methods.
Our experimental evaluations on 2684 free popular apps and 1433 malicious apps suggest that our rule-based clas-sification with the single feature of user-trigger depen-dence is very effective. It detects 97.9% of the malware apps with a low (2.0%) false positive rate.
Our analysis reveals hundreds of malicious apps in the Google Play market, some of which were previously unre-ported and were not detected by any of the 48VirusTotal1 scanners.
The purpose of our work isnotto advocate the use of fewer features in program classification. Multiple classification tools and features should be utilized to paint a comprehensive picture about a program.
Rather, our thesis in this mobile app classification work is to advocate the approach of benign property enforcement.
Our analysis verifies whether or not a program is in compli-ance with our benign-property standards. In the face of rapid malware evolution, this type of benign-property enforcement may yield a more proactive defense than the malware-oriented detection approaches.
2.
Overview and definitions
Our classification methodology aims at exposing possible privileged actions of apps that are not intended by the user and lack proper dependences in the code. In this section, we give the description of how thetrigger-based dependencefeature is extracted from programs through static program analysis. We also discuss several metrics formed from our feature analysis.
2.1. Data dependence graph
A data dependence graph (DDG) is a common program anal-ysis structure which represents inter-procedural flows of data through a programHorwitz et al. (1990). The DDG is a directed graph representing data dependence between program in-structions, where a node represents a program instruction (e.g. assignment statement), and an edge represents the data dependence between two nodes. The data dependence edges are identified by data-flow analysis. A direct edge from noden1
to noden2, which is denoted byn1/n2, means thatn2uses the value of variablexwhich is defined byn1.
Formally, letIbe the set of instructions in a programP. The data dependence graphGfor programPis denoted byG¼[I,E], whereErepresents the directed edges inG, and a directed edgeIi/Ij2Eif there is a def-use path from instructionsIito
Ijwith respect to a variablexinP.
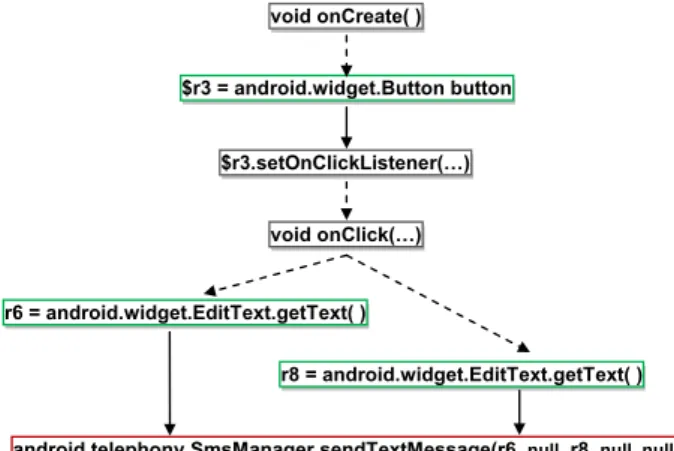
We show two DDG examples to motivate our data-flow analysis based on the dependence relations. The first example is a legitimate app for sending SMS messages.Fig. 1
shows its partial def-use dependence graph. The graph in-dicates that the API callsendTextMessage()depends on the some inputs from the user, as one of its argument is entered by the user via text fields, throughgetText()API. There are direct dependence paths between user inputs (e.g., data and actions) and thesendTextMessage()API.
Another example is about a real-world Android malware HippoSMS, which affects Android smartphones by subscribing to premium SMS services. The malware sends SMS messages to a hard-coded premium-rated number without the user's knowledge.Fig. 2shows a partial def-use dependence graph for HippoSMS. It shows the dependence relations associated with the arguments to a sensitive API call sendTextMes-sage(). Specifically,Fig. 2shows thatsendSMS(p0, p1, p2) method is called with a hard-coded premium-rated number 1066156686 as its p0 argument. The subsequent sendSMS method calls a sensitive API sendTextMessage()with the same hard-coded valuep0as itsphoneNumargument. There is no direct dependence path between thesendTextMessage() API call and any user inputs (e.g., data and actions).
We accurately extract these types of dependence proper-ties and quantify them for classification. Existing program analysis solutions cannot be directly applied to solve the problem, in part because of the lack of proper handling of Android-specific features such as Intents. In our work, we formalize the security problem of dependence-based app classification, and design efficient algorithms for parsing large specialized dataedependence graphs for extracting the trigger-based dependence feature. We refine our
data-edependence graph with reachability analysis obtained from
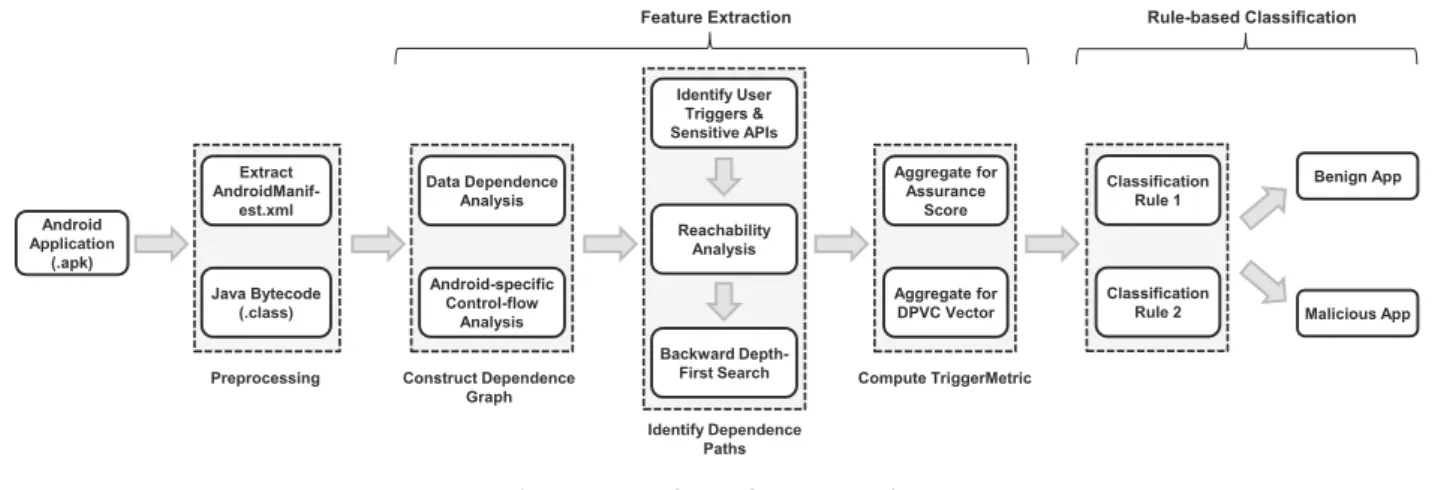
control-flow analysis. The reachability analysis prunes un-used code for high program analysis accuracy. The workflow of our analysis is shown inFig. 3.
2.2. TriggerMetric tuple per operation
In this section, we give the definitions for the terminology used in our classification, including operation,trigger, depen-dence path, andvalid call site. For each operation in a program, we give our definition for the TriggerMetric tuple, which rep-resents properties associated with call sites of the operation.
Anoperationis anAPI callwhich refers to a function call
providing system service such as network I/O, file I/O, tele-phony services in the program. We focus on a subset of function calls e the critical API calls that can be used for accessing private data and utilizing system resources.
Examples of the operations in our analysis are send/receive network traffic, create/read/write/delete operations for files, insert/update/delete operations in database and content pro-vider, execute system commands usingjava.lang. Runti-me.exec, access and return private information such as location information and phone identifiers, and send text messages in telephony services.
Atriggerrefers to a user's input or action/event on the app. A trigger is a variable defined in the program. For example, the user's input may be text entered via a text field, while the user's action/event is any click on UI element, such as a but-ton. Relevant API calls in UI objects that return a user's input value or listen to user's action/event are defined as triggers.
Our classification is based on analyzing unauthorized privileged operations that are not intended by the user. Because the analysis is automated (i.e., without any user participation), user-intention needs to be approximated. In our analysis user-intention is embodied in the trigger vari-ables. We specify the names of functions corresponding to triggers and operations in the program analysis.
A valid dependence path is a (directed) dependence path
between a trigger and an operation in a data dependence graph (DDG). In our static data-flow semantics, the path specifies a definition-and-consumption (def-use) relation, where a trigger is defined and later used as an argument to an operation. The existence of a valid dependence path means that the operation depends on a user trigger.
$r3.setOnClickListener(…)
android.telephony.SmsManager.sendTextMessage(r6, null, r8, null, null) r6 = android.widget.EditText.getText( )
void onCreate( )
void onClick(…)
r8 = android.widget.EditText.getText( ) $r3 = android.widget.Button button
Fig. 1ePartial abstract dependence graph for a legitimate app.sendTextMessage()has the required user
dependence property. User triggers are shown in green nodes.
void onCreate( )
void sendsms(“1066156686”, “8”, “ ”)
void sendsms(Str p0, Str p1, Str p2)
r0 = @p0: String r1 = @p1: String r2 = @p2: String
android.telephony.SmsManager.sendTextMessage(r0, r1, r2, …) Fig. 2ePartial abstract dependence graph for HippoSMS malware. There is no direct path showing a dependency between user triggers andsendTextMessage().
Fig. 4illustrates two different operationscandc0in a pro-gram, each having two call sites (i.e., each call occurs twice in the program),s1ands2forc,s01ands02forc0. Three dependence paths are valid, with proper user triggers on the paths, whereas a valid dependence path for call sites02does not exist. The trigger may be transformed before being used as an argument in the operation, thus the dependence path be-tween them may be long. In Section3we present our detailed program analysis and graph algorithms.
Avalid call sitesof an operationcis a call site that has a valid user-trigger dependence path. Acall site is the occur-rence of an operation. An operation may have one or more call sites in a program.
Definition 1. TriggerMetric feature is a two-item tuple<k,l>for an operation c in a program,where.
k is the number of valid call sites of operation c,and l is the total number of call sites of operation c.
For the example inFig. 4, the TriggerMetric values for op-erationscandc0are<2, 2>and<1, 2>, respectively. For an app withndistinct operations, there are nTriggerMetric tuples
associate with it,<k1,l1>,…,<kn,ln>, one corresponding to
each operation.
2.3. Aggregated metrics
One can compute several useful values aggregated from then TriggerMetric tuples of a program. These aggregated metrics provide a behavioral summary of the program. Intuitively, the assurance score Vis a single value for an app representing the portion of call sites that are intended by the user across all operations in the app.
Definition 2. Assurance scoreV2[0%, 100%]of a program is the
percentage of valid call sites out of the total number of call sites across all the operations.Given the n TriggerMetric tuples{<ki,li>}of
a program,where kiis the number of valid call sites and liis the
number of total call sites for operation i,and n is the total number of distinct operations,V is computed as follows.
V¼ Pn i¼1ki Pn i¼1li (1) Android Application (.apk)
Preprocessing Construct Dependence Graph Identify Dependence Paths Benign App Reachability Analysis Identify User Triggers & Sensitive APIs Backward Depth-First Search Data Dependence Analysis Android-specific Control-flow Analysis Extract AndroidManif-est.xml Java Bytecode (.class) Aggregate for DPVC Vector Aggregate for Assurance Score Compute TriggerMetric Feature Extraction Classification Rule 2 Classification Rule 1 Rule-based Classification Malicious App
Fig. 3eWorkflow of our analysis.
Fig. 4eIllustration of dependence paths and various metrics for a program having two distinct operationscandc′. Each operation has two call sitess1ands2ands0
1ands02, respectively. A solid line represents the existence of a dependence path from some user trigger to a call site. A dashed line represents that none of the call site's dependence paths has a user trigger.
For the example inFig. 4,V¼3/4, as there are total 4 call sites in the program, among which 3 are valid.
One can also compute the distribution associated with TriggerMetric values in a program, which provides useful in-sights into the program's behaviors.
Definition 3. DPVC Vector W of a program is the normalizedD
is-tribution of thePercentages of ValidCall sites per operation.For operation i,the percentage of valid number of call sites is defined as ki/li,wherekiis the number of valid call sites andliis the number of total call sites for the operation i.Let n be the total number of distinct operations in the program.
Each percentage value determines the bin whose contents are augmented by one. After all percentage values are distributed, the value of each bin is divided by n, the total number of operation in the program. This yields a normalized distribution. Specifically, the distribution of the n percentage values {k1/l1,…, kn/ln} is represented
by the following 12 bins: 0%, (0%, 10%), [10%, 20%), [20%, 30%),…, [90%, 100%), 100%.
For the example inFig. 4(n¼2), the percentages of valid number of call sites for the two operations (candc0) are 100% (2/2) and 50% (½), respectively. Thus, most of the corre-sponding DPVC vector is 0, except for bins (50%, 60%) and 100%, i.e., one count in the [50%, 60%) bin, and one count in the 100% bin. After normalization, the entry for both the 100% bin and [50%e60%) bin is 0.5. Therefore, the final normalized distribution vector is {0, 0, 0, 0, 0, 0, 0.5, 0, 0, 0, 0, 0.5}, whose components are summed to 1.
The DPVC vector is computed from the TriggerMetric feature. Intuitively, it provides the in-depth statistics on the dependence-based validity of the calls in the program. The vector is used in our classification in Section4, where we compare the DPVC vector of an unknown app with ones of known malware apps to infer their behavior similarities.
2.4. Program analysis for feature extraction
The TriggerMetric feature is extracted from programs through static program analysis. In this section, we justify our use of data-flow analysis (as opposed to control-flow analysis) for this purpose. Our method tracks how a user's input propa-gates throughout the program usingdata-flow analysis. Alter-natively, one may attempt to capture how the user control action leads to a sensitive API call, which requirescontrol-flow analysis.
For our trigger-based dependence analysis, data-flow analysis is more appropriate than control-flow. For example, control-flow analysis cannot be used to track the user's input (data) that is used as arguments in sensitive API calls. How-ever, data-flow analysis alone may overestimate the de-pendences due to the lack of the control analysis on branches (e.g.,if). In this work, our feature is extracted from data-flow dependence analysis, which is coupled with event-specific control-flow dependence analysis. Our approach can be generalized to comprehensive control-flow analysis for improved accuracy.
Our dependence analysis tracks the propagation of triggers through events, including Android Intent. Intent is an event-based mechanism for communication between applications
or components (Activity, Service, Receiver) in Android. For example, information entered by the user in oneActivitymay be passed through an Intent to anotherActivityorServicefor processing. Therefore, the dependence graph needs to be augmented in order to obtain the complete set of operations that depend on trigger variables through events. Without this expansion, the dependence analysis may underestimate the dependence relations (i.e., fail to report legitimate trigger-operation dependence relations). Because of our focus is on dependences related to user activities, we perform Intent-specific flow analysis, as opposed to general control-flow analysis.
Next, we give a detailed description of the techniques used in our program analysis. The program analysis outputs Trig-gerMetric values for all the sensitive operations in the pro-gram. Then in Section4, we present our classification method based on the TriggerMetric values. Our evaluation results are given in Section5.
3.
Feature extraction using dependence
analysis
We present in detail our technique used for extracting the TriggerMetric feature from Android applications. To that end, we generate and analyze the data dependence graph, includingi)the general data-flow dependences,ii)the event-specific data dependence analysis for handling Android Intent and gathering comprehensive data dependence infor-mation,iii)reachability analysis for pruning unused code, and iv)backward depth-first search for finding dependence paths and computing a TriggerMetric for each operation.
Our program analysis takes as inputs the trigger set and the operation set, which are manually selected based on their semantics. The output of the program analysis is a set of TriggerMetric values {<kc, lc>}, one value for each sensitive
operationc, e.g.,sendTextMessage().
The pseudocode of our procedure for computing Trigger-Metric values of a program is shown in Algorithm 1.
We first describe our construction of the dependence graph based on explicit def-use relations. The basic DDG graph is then augmented in order to capture def-use relations due to events.
3.1. General-purpose data-flow dependence
We use data-flow analysis to construct the data dependence graph (DDG) with intra- and inter-procedural call connectivity information to track the dependences between the definition and use of user-generated data in a given program. The intra-procedural dependence edges are identified based on local use-def chains. On the other hand, the inter-procedural dependence edges are identified based on constructing a call-site context-sensitive call graph supported by points-to analysisto build accurate call graphs.Context-sensitiveanalysis differentiates calling contexts of a function during analysis. Context-insensitiveanalysis analyzes a function summarizing over all calling contexts.
Thus, a context-insensitive analysis may not provide as accurate a solution.
The above general-purpose data-flow analysis does not cover the data-flow associated with events, as Android event communications are usually implicit. To achieve a compre-hensive dependence coverage, we describe our technique for the necessary event-specific dependence analysis next.
3.2. Augmentation with event-specific data dependence Our augmented analysis handles two types of eventsei) im-plicit method invocation (e.g., through listeners in GUI) andii) Android-specific Intent-based inter-app or inter-component events. Our approach is to perform necessary control-flow analysis, which findsbridgesbetween disjoint graph compo-nents, so that one can obtain the complete reachability of
triggers. We describe our Android Intent-based dependence analysis that tracks the control-flow among Intent-sending methods in intra- and inter-application communication. This Intent-specific control-flow analysis is necessary for capturing data dependence relations between triggers and operations across multiple apps and their components.
Android Intent can declare a component name, an action and optionally includes data or extra data. For example, an Intent can be used to start a new activity by invoking the startActivity(Intent i) or startActivityForResult (Intent i,…)methods. An Intent should be sent to a target component by matching the Intent's fields with the declara-tion of the target component in the manifest. Android Intents can be used for explicit or implicit communication. An explicit
Intent specifies that it should be delivered to a particular component specified by the Intent, whereas an implicit Intent requests the delivery to any component that supports a desired operation.
For explicit Intent, where the target component name is specified, we first identify the source component and the target component that are linked through an Intent object. This step pinpoints the Intent creation and sending methods (e.g., startActivity(Intent i)andsendBroadcast(Intent i)) to capture the control-flow dependences between the source and target components. In particular, we analyze the Intent object constructor to extract the name of the target component if it is provided. If it is not provided, we search the parameters in the setClass(), setComponent() or setAction() methods on the Intent object, which specify the target's name to obtain the target component. Given this information, the dependence graph is augmented by adding a directed edge from the Intent-sending method of the source component to the entry point of the target component. This analysis is per-formed for all explicit Intents created in a given application.
For an implicit Intent, the target component can be any component that declares its ability to handle a specified ac-tion. The target component is determined by the Android system based on the manifest file. We handle the implicit Intent by analyzing the AndroidManifest.xml file to extract a list of components with their actions to identify the target component. Implicit method invocation, such as those in the GUI, must be accounted for in the dependence graph. Our approach is to connect the dependent calls to the relevant API calls related to threads and listeners with their callee in the graph. For example, Button.setOnClickListener() is linked with an implicit call to its event handler implementa-tiononClick(). We identified a list of all event handlers from Android developer documentation for our analysis. These methods effectively augment the general-purpose data dependence graph with the necessary Android event-specific data-flow information.
Obfuscation, Java reflection, and dynamic code loading cannot be analyzed statically. Dynamic analysis approaches (e.g.,Newsome and Song, 2005; Yin et al., 2007) are needed to extract related runtime behavioral features.
3.3. Reachability analysis
The above operations produce a flow- and context-sensitive data-flow dependence graph with intra- and inter-procedural dependence analysis, and intra-and inter-application Intent-based dependence analysis. We then perform a reachability analysis for the app in order to remove unreachable code“dead code”. Unreachable code is a portion of the program which contains classes/methods that are not executed. To that end, we construct an inter- and intra-procedural control-flow graph which shows all the possible execution paths. Given this control-flow graph and the list of user triggers and sensitive API calls, we perform reachability analysis to identify reach-able user triggers and sensitive API calls from the entry points of the app. Specifically, we trace forward from the given entry point looking for the identified user triggers and sensitive API calls. For example, we perform reachability analysis to check whether a certain user trigger, e.g. click button, is reachable
from the main activity. An activity is a visible portion of an application which handles user interaction.
There might be some user triggers inside other activities, but these activities never get executed or called from the main/parent activity. Hence, there is no reachable path from the entry point and these user triggers, and they can be safely ignored to increase the precision of our analysis. Similarly, some sensitive API calls may not be reachable from the entry points and never get executed. For example, a sensitive API getLastKnownLocation()in a tool app is unreachable from the apps entry points, and therefore will not be executed. Thus, we ignore and call it unreachable sensitive API call.
On the other hand, we call user trigger or sensitive API call reachable if there is a reachable path from the given entry point to this user trigger or sensitive API call. For example, assume that there is a sensitive APIsendTextMessage()identified in a service component in app SendSMS. A service is an invisible portion of an application which performs background task. This service will be called from the main activity upon user clicks on a button. In this case, the sensitive API identified inside the service component will be executed. Thus, there is a reachable path from the main activity entry point to this sendTextMes-sage(), and hence we call it reachable sensitive API call.
As explained above, some user triggers and sensitive API calls may not be reachable and hence can be ignored in our analysis. Our subsequent dependence analysis will only be performed on reachable components. The reachability analysis increases the analysis precision by excluding unreachable code.
3.4. Finding user-trigger dependence paths
Once the dependence graph is constructed, the next step is to identify paths between user trigger and sensitive API call pairs. We scan the graph for the occurrences of call sites of sensitive operations. In Algorithm 1,checkPath Existence() performs this task by performing backward depth-first traversal. For each call site siof an operationc, we perform
the backward tracing from si on the dependence graph
searching for any user triggers on the dependence paths. For eachc, we record thevalidnumberkcof call sites, and thetotal
numberlcof call sites.<kc,lc>is output as the TriggerMetric of
the callc, according to Definition 1.
Our implementation of the static analysis framework uti-lizes libraries in Soot, a static analysis toolkit forJava soot. Our framework analyzes Java bytecode or source code.
Our DDG construction improves the def-use analyses pro-vided by Soot.2 Our prototype propagates def-use relations across the boundaries of methods. Our current prototype dose not analyze native libraries. Yet, our approach can be gener-alized to analyze native code.
4.
Classification method
The classification decisions are based on the assurance score Vand DPVC vectorWof an app. An app is classified as either benign or malicious. These values are computed from the
2We augmentedSootlibraries to support the inter-procedural call dependence analysis.
extracted TriggerMetric tuples (<ki,li>) of the app, according to
Definitions 2 and 3. Because of the simplicity of our feature, our classification is based on rules. In addition to classification decisions, our analysis also reports the names of operations with invalid call sites in the program.
Specifically, given the TriggerMetric values obtained from the program analysis, our classification has three steps: i) computingVandW,ii)preliminary classification based onV with respect to a pre-defined threshold T, and iii) further classification based on the weighted similarity analysis be-tween vectorWand those of known malware samples. In the next section, we present our two classification rules.
4.1. Our classification rules
4.1.1. Classification with assurance score
The threshold-based classificationRule 1aims to detect apps that have low assurance scores, indicating the existence of a large portion of invalid call sites without proper user triggers.
Rule 1. Given the assurance score V of an Android app and an
assurance threshold T2(0, 100%], if V<T, then the app is classified as malware. Otherwise, it is classified as benign.
Clearly, the choice ofTaffects the accuracy of the classi-fication. In our experiments in Section 5, we found that a threshold of 75% gives a proper balance between the false positives (FP) and false negatives (FN). Probable malware needs to be further inspected.
For each app, we also applied the similarity-based classi-fication rule.
4.1.2. Weighted similarity analysis on DPVC vector
This classification compares the DPVC vector of an app with the DPVC vectors of known malware samples. The purpose is
to detect the apps who havesimilar distributions with malware in terms of the valid call sites. To that end, we first computed the DPVC vectorWifor each malwarei2[1,m] in a known
malware sample set of sizem. Then, we computed the average DPVC vector, which is denoted byM; that is, for each itemMjin
vectorM,Mjis computed as in Equation(2).
Mj¼
Pm i¼1Wij
m (2)
Vector M represents theaverage distribution of the per-centage of valid call sites per operation among the known malware.
Rule 2. Given the DPVC vector W of an app, the average malware
DPVC vector M, a similarity function f, and a threshold T0, if f(W, M) T0, then the app is classified as malware. Otherwise, it is classified as benign.
Any similarity function may be used on DPVC vectors. In our experiments, we used a weighted cosine similarity func-tionTan et al. (2006). The function computes the cosine sim-ilarity between vectorsWand M, while applying weights to the ranges with smaller percentage values, namely 0% and (0, 10%). The weights are computed based on an exponential function 2xand then are normalized.
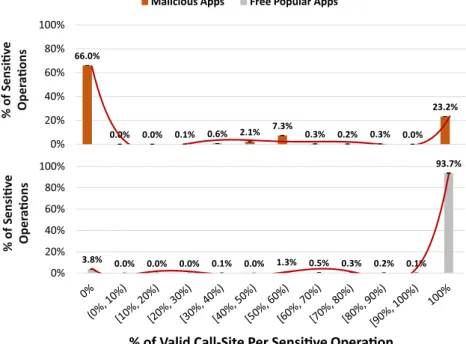
The reason for choosing the exponential weight function for this similarity measure is that we observed that the malware apps have a distinct distribution pattern from the legitimate apps towards the low percentage region, as shown
in Fig. 5. The weights amplify this distinction in the
classification.
Definition 4. A program is classified as benign if it is classified as benign by bothRule 1 andRule 2.Otherwise, it is classified as malicious.
Fig. 5eAveraged DPVC vectors representing a fine-grained distribution of per-operation valid call sites for 1433 malware apps (top) and 2684 free popular apps (bottom).
Our evaluation indicates the effectiveness of the above classification rules on the thousands of apps studied. We also painstakingly performed necessary manual inspections on some apps to validate our results and identified the causes of inaccuracies.
In the next section, we present category of features derived from our TriggerMetric value which can be used for classifi-cation as well.
4.2. Variations of classification rules
Our classification rules are based on aggregated statistics on valid call sites of a program. One can define other classifica-tion rules using the TriggerMetric values {<k,l>} of a program. These rules may reflect different degrees of user-trigger dependence that is required in a trustworthy application.
To demonstrate the generality of the TriggerMetric feature, in this section we describe two examples of such classification rules, namelyAll-Valid-Call-Sites Rule and Any-Valid-Call Site Rule. Both rules defined below are based on the number ofvalid call siteskiwith respect to thetotalnumber of call siteslifor an
operationiin the program.
Rule 3. All-Valid-Call-Sites Rule. A program is classified as
benign, if and only if all the call sites of all the sensitive operations are valid, i.e., having user-trigger dependence. If ki¼licsensitive
operation i, then the program is benign. Otherwise, the program is classified as malicious.
This above rule is equivalent to setting assurance thresholdTto 100% in our classificationRule 1. In our exper-iments, there are 80.5% (2162) of apps that have 100% assur-ance scores. We conjecture that such a rule leads to low or zero missed detection, but many false positives.
A more relaxed classification rule can be defined below, which only requiresat least onevalid call site per sensitive operation.
Rule 4. Any-Valid-Call-Site Rule. A program is classified as
benign, if for each sensitive operation there is at least one valid call site. If ki1csensitive operation i, then the program is classified as
benign. Otherwise, the program is classified as malicious.
For the example in Fig. 4, this program is classified as malicious byRule 3and benign byRule 4. In-depth compari-son of the impact of these various classification rules and thresholds on Android security will be our future work.
In our experimental evaluation, the classification decisions are based onRule 1andRule 2.
5.
Experimental evaluation
The objective of our evaluation is to answer the following questions:
1. Do the distributions of the assurances scores of malware and benign apps significantly differ?
2. What is the false negative (i.e., missed detection) rate when classifying known malware samples?
3. Can our method discover new malware apps that have not been previously reported?
4. What are the reasons for false positives?
5.1. Experiment setup
We performed an evaluation with 1433 Android malware apps collected by Zhou and Jiang (2012) and VirusShare.3 The known Android malware apps perform malicious functional-ities, such as sending unauthorized SMS messages (e.g., FakePlayer), subscribing to premium-rate messaging services automatically (e.g., RogueSPPush), listening to SMS-based commands to record and upload the victim's current loca-tion (e.g., GPSSMSSpy), stealing users'credentials (e.g., Fake-Netflix), and granting unauthorized root privilege to some apps (e.g.,AsrootandDroidDeluxe).4
We also evaluated 2684 free popular real-world Android apps from Google Play market, covering various application categories. These free apps include those with different levels of popularity as determined by the user rating scale. In particular, we used 1039 high popularity apps, 713 interme-diate popularity apps, and 932 low popularity apps. We assumed that the trustworthiness of these free apps is un-known and they may be malware or may contain malicious components. We converted Android app code (apk) from the .dex format to .class files using the DaretoolOcteau et al. (2012)and extracted features from the Java bytecode.
5.1.1. Averaged DPVC vector of known malware
We computed the DPVC vector for each of the 1433 malware samples, and then computed their average DPVC vector ac-cording to Equation(2). The average malware DPVC vector ap-proximates the distribution of valid call sites in malicious apps. It was used for the similarity test of unknown apps inRule 2.
5.1.2. Thresholds for classification rules
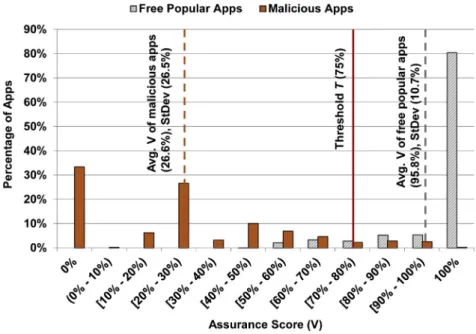
For our two classification rules (Section 4), we choose the assurance threshold T to be 75% forRule 1and the similarity thresholdT'to be 0.8 forRule 2. Empirical results showed that these values provide a high detection rate without producing excessive false alerts.
5.2. Known malicious apps
Assurance Scores of Known Malware.Most of the malware apps have low assurance scores, indicating that a significant number of sensitive API calls are made without proper user triggers. Invalid call sites that we observed include those for writing and sending information through the network, sending unauthorized SMS messages, executing system commands, and accessing user's private data. E.g.,Asrootand BaseBridgeuseRuntime.exec()to execute system commands without valid user triggers.
We found that 479 malware apps out of 1433 apps have 0% assurance scores. The rest of the 954 apps have positive
3http://virusshare.com/.
4The malware naming convention follows Zhou and Jiang
assurance scores. Among them, many malware apps are repackaged from benign apps,5e.g., ADRD, DroidDream, and Geinimi. Malware writers bundle malicious code with existing benign apps. Repackaging explains our observation that a significant number of malware apps (954 out of 1433) have non-zero assurance scores. Positive assurance scores indicate that a portion of the sensitive operations in these malware apps exhibit the required dependences on user triggers.
FakeNeflix is the only malware app that has a 100% assurance score.FakeNetflixis a phishing app, which pro-vides a fake user interface to trick the user to enter her or his Netflix credential. This type of phishing malware circumvents virtually all behavior-based detection approaches, including ours. App certification and user education are more effective defenses than program analysis for this type of social engi-neering malware.
The detailed distribution of the assurance scores for the known malicious apps can be found inFig. 6.
5.2.1. Classification results on known malware
The classification results on known malware apps are given in
Table 1. Using assurance scores,Rule 1labels most (92.5%) of the samples as malicious, as they have lower-than-75% V values.Rule 1labels 108 apps (7.5%) as probably benign. Using DPVC vectors,Rule 2labels malicious for 5.4% (77) apps out of the 108 probably benign cases, as these apps have low per-centages for valid call sites per operation. Thus,we correctly
detect 97.9% of the 1433 malware samples.The false negative
rate is 2.1%, i.e., 31 malware apps are misclassified as benign.
The main reason for misclassification is malware repack-aged from existing benign code, resulting in malware with profiles similar to benign apps. For example, one of the 31 undetected malware apps isDroidKungFuSapp, which con-tains malicious code bundled with com.aijiaoyou.an-droid.sipphone(an app for learning Chinese). As a result, this malware app has a high assurance scoreVof 85.7% and a low similarity value (0.015) with known malware.
There are two possible countermeasures to combat the misclassification of repackaged malware apps. The first countermeasure is to adjust the rules thresholds used for the classification. For example, we set a threshold for rule 1
(assurance scoreV) to 75% in our evaluation. One can raise this threshold to be 90% or more. In this case, the repackaged malware such as DroidKungFuSapp with assurance scoreVof 85.7% will be detected.
A more advanced countermeasure is to separate and identify the original benign portion of the app and the injected malicious code. In any repackaged app, the malicious com-ponents are highly communicated/connected together and loosely connected with other benign components. Hence, one possible way to identify this is to analyze the connectivity of the call graph of a repackaged app to identify the loosely connected or disconnected graph components. Then, one can Fig. 6eDistinct distributions of assurance scores (V) for known malicious apps and free popular apps.
Table 1eSummary of classification results on 1433 known malware apps. Rule 2 is applied to the apps that are classified as benign by Rule 1. The false negative (FN) rate refers to the portion of malware apps classified as benign by both rules and is 2.1%.
Rule 1 (V) Rule 2 (DPVC)
Malicious Benign Malicious Benign (FN)
92.5% 7.5% 5.4% out of 7.5% 2.1% out of 7.5% 5The problem of detecting repackage apps (e.g.,Crussell et al.
(2012)) has a more specific goal from our general app classifica-tion. It typically requires graph-based pair-wise app similarity analysis.
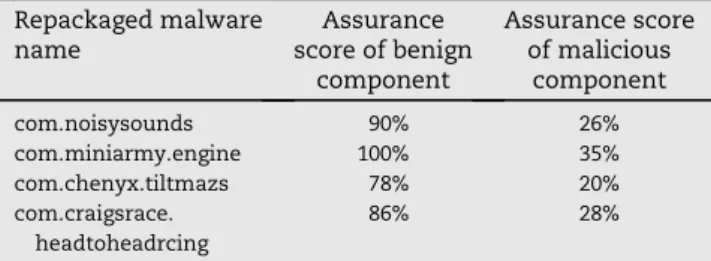
compute features separately for each graph components and observe the imbalance. Table 2 shows the results of our assurance scoresVfor the benign and malicious components separately for some of the repackaged malware apps. TheV scores for the benign components are much higher than the malicious components which show the validity of our pro-posed feature.
5.3. Free popular apps
Because the ground truth on trustworthiness of the free popular apps are not known, our analysis on them is more complex. Some of the classification decisions are validated through significant manual inspection of the code. We present our results on thei)assurance score computation,ii) classifi-cations using two rules, andiii)new malware discovery.
5.3.1. Assurance scores of free apps
Among the 2684 free popular apps, 80.5% of them have 100% assurance scores, indicating that all the call sites of all the sensitive operations have valid user-trigger dependence. The detailed distribution of the assurance scores are shown in
Fig. 6. For the 80.5% of the apps that have 100% assurance
scores, we utilized a signature-based malware scanning tool VirusTotal for additional validation. VirusTotal has 48 signature-based scanners (e.g., McAfee, NOD32, BitDefender). We found that only one scanner out of 48 scanners in Viru-sTotaltriggers an adware alert for 13 free popular apps which have 100% assurance scores (true positives). The rest of the free popular apps with 100% assurance scores are benign (true negatives), none of them trigger any alert byVirusTotal.
Through manual inspection, we find that the use of adver-tisement and analytics libraries is one main reason for sensi-tive operations to be called without proper user triggers. We selected several apps with less-than-100% V scores and computed their assurance scores with and without the ad/an-alytics libraries. TheVscores are boosted significantly without the ad/analytics libraries. The results are shown inTable 3.
We also found a few malicious apps with high enough assurance scores (e.g., V is 89%) to pass our classification threshold (i.e., false negative), e.g., a spyware wallpaper app com.ysler.wps.d3davailable on Google Play market.
5.3.2. Classification results of free popular apps
Our classification results are summarized inTable 4. Most of these free popular apps from Google Play market are classified asbenignby both rules.Rule 1labels 7.2% (193) of the 2684 apps as malicious. We then appliedRule 2to both categories of apps.
For apps classified as malicious byRule 1. We appliedRule 2
to these 7.2% of the apps.Rule 2labels 6.5% of the total (175 of 193) as malicious. The other 0.7% (18) are labeled benign.
For apps classified as benign byRule 1. We appliedRule 2to
these 92.8% of the apps.Rule 2labels 1.7% (47) of them as malicious, and classifies the rest 91.1% as benign.
There are 240 apps that are labeled as malicious by bothor either one of the rules. Their popularity distribution is as fol-lows, with higher concentrations of suspicious apps in me-dium and low popularity categories.
High popularity category: 70 apps (29.2%)
Medium popularity category: 87 apps (36.3%)
Low popularity category: 83 apps (34.5%)
To confirm the correctness of our results, we then per-formed various code inspection on them, the detail of which are described next.
5.3.3. New malicious apps found
To confirm that the apps classified as malicious are truly malicious, manual code inspection was performed. We also utilized theVirusTotalfor additional validation.
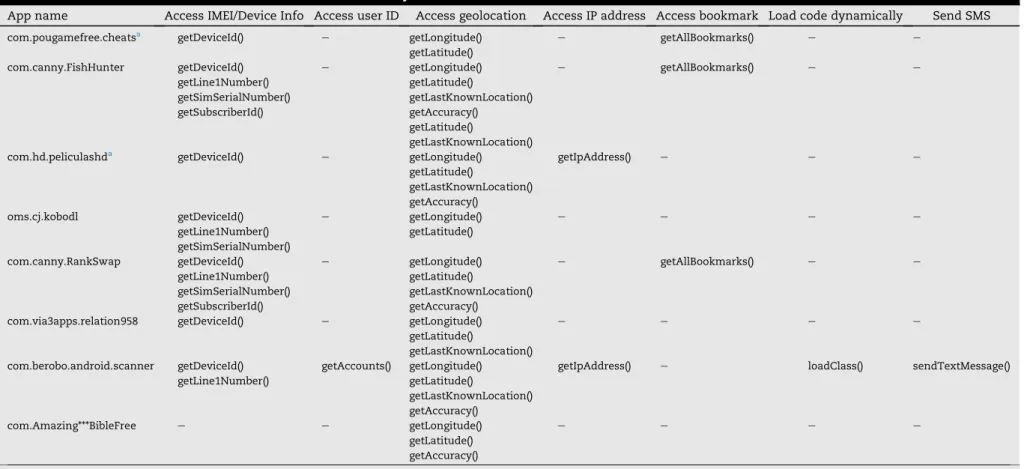
Our method discovered many new malicious Android apps that cannotbe detected by the VirusTotal tool.6These new malware apps did not trigger any alerts in VirusTotal. A subset of these new malicious apps is shown in Table 6 with
Table 3eAssurance scores of subset of selected benign apps including or excluding the ads/analytics libraries.
App name Including
ads libs Excluding ads libs com.canadadroid.fantasy 75.0% 100.0% com.canadadroid.penguinskiing 79.2% 100.0% com.CalcFinalProgress 85.2% 96.3% AzureNightwalker.ContactList 89.7% 97.4%
Table 4eSummary of classification results after applying both rules on 2684 free popular apps.
Rule 1 (V)
Malicious Benign
7.2% 92.8%
Rule 2 (DPVC) Rule 2 (DPVC)
Malicious Benign Malicious Benign 6.5% 0.7% 1.7% 91.1% Table 2eAssurance scores for the benign and malicious
components in some repackaged malware apps. Repackaged malware name Assurance score of benign component Assurance score of malicious component com.noisysounds 90% 26% com.miniarmy.engine 100% 35% com.chenyx.tiltmazs 78% 20% com.craigsrace. headtoheadrcing 86% 28%
Table 5eAverage feature-extraction time for an app.
Procedure Average time (sec)
Reachability Analysis 14.17 Finding Dependence Paths 54.30 AndroidManifest.xml Parsing 0.01 Graph Construction using Soot 89.53 Total Time 158.01
6Out of the 240 apps, 137 apps triggers at least one alert in VirusTotal.
Table 6eMalicious activities of a subset of new malware found by our method.
App name Access IMEI/Device Info Access user ID Access geolocation Access IP address Access bookmark Load code dynamically Send SMS
com.pougamefree.cheatsa getDeviceId() e getLongitude() e getAllBookmarks() e e
getLatitude()
com.canny.FishHunter getDeviceId() e getLongitude() e getAllBookmarks() e e getLine1Number() getLatitude()
getSimSerialNumber() getLastKnownLocation() getSubscriberId() getAccuracy()
getLatitude()
getLastKnownLocation()
com.hd.peliculashda getDeviceId() e getLongitude() getIpAddress() e e e
getLatitude()
getLastKnownLocation() getAccuracy()
oms.cj.kobodl getDeviceId() e getLongitude() e e e e
getLine1Number() getLatitude() getSimSerialNumber()
com.canny.RankSwap getDeviceId() e getLongitude() e getAllBookmarks() e e getLine1Number() getLatitude()
getSimSerialNumber() getLastKnownLocation() getSubscriberId() getAccuracy()
com.via3apps.relation958 getDeviceId() e getLongitude() e e e e getLatitude()
getLastKnownLocation()
com.berobo.android.scanner getDeviceId() getAccounts() getLongitude() getIpAddress() e loadClass() sendTextMessage() getLine1Number() getLatitude() getLastKnownLocation() getAccuracy() com.Amazing***BibleFree e e getLongitude() e e e e getLatitude() getAccuracy() a App has been removed from Google play market by 12/05/2013.
compute r s & security 49 (2015) 255 e 273
examples of their sensitive function calls that lack of valid user-trigger dependence. All of them are confirmed by our manual analysis to have malicious functionalities. InTable 6, each column is a category of malicious action, e.g., unjustified dynamic code loading and unnecessary accessing of user in-formation. Names of call sites without valid user-trigger dependence are given. All the apps shown in this table fail both of our classification rules, yet do not trigger any alerts in VirusTotal.
We highlight a few of the new malware that we discovered in the free popular apps. Our method detects a malicious app Time Machine, which is repackaged from an ebook app. The malware invokes many sensitive APIs (in Jslibs library) to perform unjustified operations, such as recording sound, retrieving phone state, and exfiltrating geolocation informa-tion. We find that an organizer app com.via3ap-ps.usobesit618 is bundled with a piece of malware collecting private information, such as device ID, email address, latitude and longitude, phone number, and user-name, and it uploads the details to a remote server. Another malware app is a game-guide appcom.bfrs.krokr, which is bundled with adware AndroidApperhand (aka Android.-Counterclank).AndroidApperhand is a piece of aggressive adware. It attempts to modify the browser's home page, copy bookmarks on the device, shortcuts, push notifications, and steal build information (brand, device, manufacturer, model). This adware also attempts to connect to a remote host.
For the apps that are labeled as malicious byonly one rule (2.4% out of 2684 apps), we have confirmed that most of the apps (2.2% of 2.4%) contain aggressive advertisement libraries, such asMobclix, Tapjoy, andWaps. These libraries invoke sensitive operations without any user triggers. Unlike regular ad libraries, these aggressive ad libraries contain an over-whelmingamount of invalid call sites. Most of them have a large number (>50%) of sensitive operations with zero valid call sites, which is consistent with known malware. Other researchers have also confirmed the potential security issues raised by these aggressive ad librariesGrace et al. (2012a).
5.3.4. False positive rate (FPR)
FPR is computed asFP/FP þTN, where TN stands for true negative (benign apps). 240 apps are classified as malicious by our method. VirusTotal scanning confirms 137 of them are malicious. For the rest of 103 apps, we randomly selected 21 apps out of these 103 apps and perform a thorough manually code inspection. We found that 11 of the 21 apps have definitive malicious or aggressive code behaviors that threaten the system assurance and data confidentiality in Android (described in Section 5.3.3 and
Table 6). These behaviors were found in either the main
components or adware. In the other 10 apps we did not find any threats, thus concluded that they are benign (false positives). The total false positives are estimated at 103 * 10/ 21¼49. Since the trustworthiness of the free popular apps is unknown, we used VirusTotal to check all the free popular apps classified as benign by our method (true negatives). We found that only one scanner out of 48 scanners inVirusTotaltriggers an adware alert for 27 apps (true positives). The true negatives (TN) are 2684240þ4927¼2466, yielding a 2.0% FPR.
5.4. Performance evaluation
The experiments were conducted on a computer which has 3.0 GHz Intel Core 2 Duo CPU E8400 processor and 3 GB of RAM. We measure the time for parsing the AndroidManifest.xml file, Soot execution for constructing the dependence graph, the reachability analysis, and finding the dependence paths by traversing the graph. The average processing time for an app is about 158.01 s. This processing time does not include the time required to convert the dex format to jar.Table 5shows the average time required by each analysis phase.
5.5. Summary
These experimental results suggest that our rule-based clas-sification with a single complex feature is quite effective. We summarize our major experimental findings.
1. There are an overwhelming number of malware apps with zero or low assurance scores, indicating that a large portion of sensitive call sites in these programs are invalid. The DPVC vectors (representing a fine-grained distribution of per-operation valid call sites) of malware and benign apps have significantly different distributions (shown inFig. 5). Malware has a high concentration of zero or low per-operation valid call sites.
2. We obtained a low false negative (i.e., missed detection) rate of 2.1% when classifying 1433 known malware sam-ples based on their assurance scores and DPVC vectors, suggesting the effectiveness of our detection.
3. Our method identified 240 free popular apps (8.9%) as sus-picious from Google Play market.7These malware exces-sively access device resources and personal information without any user knowledge. Our program analysis method effectively pinpoints these problematic call sites. Our method detects many malware that cannot be detected by VirusTotal scanning. Some of them are shown inTable 6. We confirmed them by manual code inspection. Our false positive rate (FP/FPþTN) is estimated at 2.0%. Our method identified more suspicious apps from the medium and low popularity categories than the high popularity category. 4. We observed several types of triggerless operations that are
benign. Sensitive operations duringi)app launching activities (e.g.,default_app_set.main.ver1),ii)background service components (e.g., com.monotype.android.font.dev.-comic), oriii)benign ad/analytical libraries (e.g.,rappsd.v1) are typically automatically completed without user triggers. These factors result in lower assurance scores and skewed DPVC vectors, which may cause false positives. The classifi-cation accuracy is also affected by the accuracy ofDarein translating Dalvik bytecode to Java bytecode.
6.
Discussion
In this section, we discuss the security guarantees provided by our app classification work, and sources of inaccuracy in our
7Google later took some malware apps off the Play market, e.g., Us-Obesity-And-You-Teenagers.
program analysis. We also describe possible extensions to the feature definitions.
6.1. Security analysis
Our app classification can be used to detect malware that in-vokes sensitive operations. Sensitive operations typically involve accessing system resources and sensitive data. Infer-ring their user-intention dependences enables the detection of potential data confidentiality and authorization issues. Examples of malicious patterns that can be detected by our analysis include:
Resource access: executing sensitive operations without proper user triggers, such as sending unauthorized SMS messages, subscribing to premium-rate services automat-ically, or granting unauthorized root privilege to apps.
Data access:accessing sensitive data items without proper user triggers, such as recording and uploading the victim's current location. Our static analysis does not track sensi-tive data variables. Instead, the function calls that may be used to access sensitive data are labeled (as operations) and analyzed.
In our model, the accuracy of the analysis is closely related to the accuracy of the data dependence analysis. Intra-procedural analysis captures fine-grained def-use relations within a function. The intra-procedural def-use relations can prevent a superfluous user input attack, thusly. One possible attack scenario is where the malware may require superfluous user inputs (before making function calls to conduct unau-thorized activities) attempting to satisfy the dependence, but the user inputs are not consumed by the calls. For example, the user enters a phone number and a message to send SMS. The phone number entered by the user can be ignored and replaced with other number inside sendTextMessage() function. This type of data flow can be detected by tracking the dependence between the user inputs entered and the sensi-tive API calls, thus the superfluous user inputs can be identified.
Social engineering app is an application that provides fake user interface to look legitimate in order to circumvent the user and perform malicious activities (e.g., stealing money). Social engineering apps may demonstrate proper trigger-operation dependences, because of the seemingly conform-ing dependence paths between user triggers and sensitive operations. Therefore, due to the intrinsic nature of our user-intention analysis, it is not suitable for detecting social engi-neering apps. Possible solutions for this could be using app certification and user education.
The legitimate apps which require few user interactions may raise false alarm. For example, a calendar app can send an automatic reminder email message of a calendar event that previously scheduled by the user. Hence, the sensitive API that sends the email message may raise an alarm according to our security model since it is not explicitly triggered by the user. For example, the user has previously entered this event into the calendar. This action can be used as a trigger that justifies the operation of sending reminder emails. Our approach can be extended to address this problem by
expanding and generalizing the definition of user triggers. The analysis for this calendar problem will be more complicated than our current solution. The reason is that the information entered by the user is stored in a data structure or file to be read back when it is needed. Hence, there is no direct dependence between sending reminder email operation and the original user triggers used to store the information. One needs to expand and include this type of indirect dependence relation.
For the rule-based method, it is easy for the malware writers to game with the analysis than the machine learning-based classification. This is because the machine learning techniques utilize a large number of features compared to the rule-based method. So, it is harder for the attacker to compromise since she/he has to deal with many features in order to circumvent the security solution. On the other hand, the rule-based method might be easy for the attacker to compromise since she/he has to deal with a one/fewer num-ber of features.
Precisely modeling a program's semantics and intention is in general challenging and open problem. In the seminal work on computer virusCohen (1987), Cohen described the seminal impossibility result on malware analysis. The defense is still an open problem and similar arm-race issue exists in virtually all security solutions.
6.2. Sources of inaccuracy in feature extraction
Overestimation of trigger-operation dependence may cause false negatives in the analysis report (i.e., failing to detect potentially malicious operations in the app). Certain depen-dence paths may only exist under specific data or control conditions. These branch conditions may not be statically predictable, resulting in overestimation. Some data depen-dence overestimation may be mitigated by identifying the specific conditions for certain dependence paths to be valid (e.g., by symbolic execution).
Conversely, underestimation of triggers may cause false positives. For instance, legitimate API calls can be triggered by runtime events such as clock-driven events from the calendar (e.g., the calendar app sends a reminder email message of a calendar event), or triggered by incoming network events. These runtime events may not be explicitly triggered by the user and thus lack the proper dependence according to our security model. One mitigation to the problem is to generalize and expand our definitions of triggers to include other legiti-mate triggering events. However, because triggers may be generated at runtime, static analysis alone may not be suffi-cient for feature extraction. Hybrid features extracted from both static and dynamic analyses are needed for complete dependence properties in a program. Its realization remains an interesting open problem.
Static program analysis has difficulty in performing the analysis on programs that employs obfuscation or encryption techniques. Obfuscation is mainly used to make the programs code difficult to understand.
Some Android apps use obfuscation to protect intellectual property Enck et al. (2011). ProGuard8 is a recommended
obfuscation tool by Google to protect against readability and does not obfuscate control flow. Hence, its impact is limited on static program analysis.
As indicated byEnck et al. (2011), it is easy to recognize some forms of the obfuscated code in Android apps. In particular, class, method, variable, and Java filename names are converted to single letters (e.g., a.java). However, several ads and analytics libraries are obfuscated to protect their intellectual property Enck et al. (2011). To obtain a rough estimate of the number of apps whose main code is obfus-cated not the ads or analytics libraries, we used the same approach proposed inEnck et al. (2011)to search for a single letter Java filename (e.g., a.java) within a file path of the package name. This heuristic is used to obtain insight for finding obfuscation code in apps, but it is not a solid char-acterization. We found only 40 malware apps (2.8%) out of the 1433 apps have this code obfuscation. Moreover, we found 250 free popular apps (9.3%) out of the 2684 apps have this code obfuscation in part of their main code. Hence, we can infer from this statistics that the majority of the apps do not heavily employ code obfuscation. We applied our analysis on the reversed engineering Java bytecode using Dare tool to translate Dalivk bytecode to Java bytecode. The accuracy of our analysis is constrained by the accuracy of the reverse engineering tools.
There are several obfuscation techniques:
Renaming technique: it renames classes, variables, and methods using meaningless names. This type of technique can not affect our approach since it just renames classes, variables, and methods without changing the content or the control flow structure.
String encryption technique: it encrypts the string data.
Control flow obfuscation technique: it reorders the code and inserts additional code statements while preserving the code semantic.
The latter two techniques can affect our approach since they change the data and the structure of the program. On possible solution is to use dynamic analysisNewsome and Song (2005); Yin et al. (2007)to provide insights about the programs runtime execution. As a future work, we plan to utilize the dynamic analysis with our user trigger dependence approach to get insights on which sensitive APIs are triggered by user inputs/actions. On way to do this is to label the user inputs/actions and to interpose the sensitive APIs in .apk file and insert monitoring code to get the sensitive API call logs during the app execution.
7.
Related work
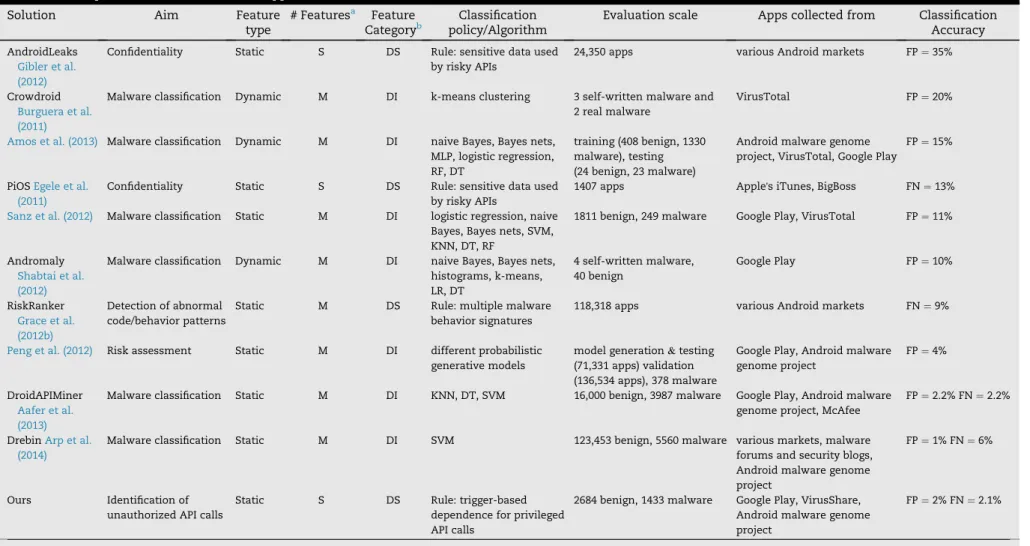
We categorize related Android app analysis work intoi) clas-sification with static features andii) classification with dy-namic or hybrid features. Both approaches are necessary for evaluating app security, providing complementary behavioral profiles.9We compare some of the existing mobile app clas-sification solutions inTable 7.
7.1. Classification with static features
In order to infer the trustworthiness of mobile applications, multiple approaches have been proposed to statically extract properties of a program from its code and/or its requested permissions (e.g.,Peng et al. (2012); Sanz et al. (2012)). One of the earliest such work is SCanDroid Fuchs et al. (2009). SCanDroid Fuchs et al. (2009) proposed to extract security specifications from the app's manifest and check whether the data-flows through the app are consistent with the stated specifications.10
The solution by Peng et al. (2012)calculated risk scores from the permissions requested by Android apps and found the hierarchical mixture of naive Bayes to be the best classifier for the risk score based app classification. The work bySanz et al. (2012)also extracted permission-usage based features, and evaluated several classifiers including random forests, naive Bayes, and Bayesian network. The false positive rate in
Sanz et al. (2012)is higher than 11%.
DroidAPIMinerAafer et al. (2013)extracted features related to API calls, and evaluated several machine learning classifiers includingk-nearest neighbor (KNN), decision tree, and sup-port vector machines. It achieves a 97.8% detection rate of the malware samples and a false positive rate of 2.2% with KNN. DrebinArp et al. (2014)analyzedAndroidManifest.xmland disassembled code to extract features on requested permis-sions and API calls, and used support vector machines (SVM) as a classifier. Drebin achieves 94% detection rate of the malware samples at a false positive rate of 1%. Both work used multiple sets of features as opposed to our work. A recent paper Wolfe et al. (2014)on Android malware classification utilizes the assurance score feature and dozens of other manifest-based features. The solution byWolfe et al. (2014)
achieves similar accuracy as ours. It utilizes a significant number of features than our work. It employs machine learning techniques, as opposed to our simple rule-based classification.
In comparison to the above permission-based classifica-tion, features extracted from code analysis are more fine-grained and specific. We highlight several such solutions next. The security goal in AndroidLeaks Gibler et al. (2012), SCANDALKim et al. (2012), and PiOSEgele et al. (2011)for iOS is focused on detecting data leak vulnerabilities, specifically on information flow for confidentiality analysis. The methods label sensitive data/sources and potentially risky sinks (typi-cally network API calls) and report when there are data-leaking dependence paths between them. PiOS reports a 13% false negative rate.
Although using dependence-path based analysis, our def-initions for the path have different semantics. As a result, our analysis with a complete coverage of sensitive operations provides comprehensive app profiling, which offers more protection than data confidentiality. For example, our analysis also detects system-assurance-related operations such as unauthorized camera access or recording, which is out of the scope the data leak solutions.
Multiple features were utilized to make classification de-cisions in RiskRankerGrace et al. (2012b). The classification is
Table 7eComparison with related mobile app classification work.
Solution Aim Feature
type
# Featuresa Feature
Categoryb policy/AlgorithmClassification Evaluation scale Apps collected from ClassificationAccuracy AndroidLeaks
Gibler et al. (2012)
Confidentiality Static S DS Rule: sensitive data used by risky APIs
24,350 apps various Android markets FP¼35%
Crowdroid
Burguera et al. (2011)
Malware classification Dynamic M DI k-means clustering 3 self-written malware and 2 real malware
VirusTotal FP¼20%
Amos et al. (2013) Malware classification Dynamic M DI naive Bayes, Bayes nets, MLP, logistic regression, RF, DT
training (408 benign, 1330 malware), testing (24 benign, 23 malware)
Android malware genome project, VirusTotal, Google Play
FP¼15%
PiOSEgele et al. (2011)
Confidentiality Static S DS Rule: sensitive data used by risky APIs
1407 apps Apple's iTunes, BigBoss FN¼13%
Sanz et al. (2012) Malware classification Static M DI logistic regression, naive Bayes, Bayes nets, SVM, KNN, DT, RF
1811 benign, 249 malware Google Play, VirusTotal FP¼11%
Andromaly
Shabtai et al. (2012)
Malware classification Dynamic M DI naive Bayes, Bayes nets, histograms, k-means, LR, DT 4 self-written malware, 40 benign Google Play FP¼10% RiskRanker Grace et al. (2012b) Detection of abnormal code/behavior patterns
Static M DS Rule: multiple malware behavior signatures
118,318 apps various Android markets FN¼9%
Peng et al. (2012) Risk assessment Static M DI different probabilistic generative models
model generation&testing (71,331 apps) validation (136,534 apps), 378 malware
Google Play, Android malware genome project
FP¼4%
DroidAPIMiner
Aafer et al. (2013)
Malware classification Static M DI KNN, DT, SVM 16,000 benign, 3987 malware Google Play, Android malware genome project, McAfee
FP¼2.2% FN¼2.2%
DrebinArp et al. (2014)
Malware classification Static M DI SVM 123,453 benign, 5560 malware various markets, malware forums and security blogs, Android malware genome project
FP¼1% FN¼6%
Ours Identification of unauthorized API calls
Static S DS Rule: trigger-based dependence for privileged API calls
2684 benign, 1433 malware Google Play, VirusShare, Android malware genome project
FP¼2% FN¼2.1%
a Number of features: single feature (S) or multiple features (M). bFeature category: domain-specific (DS) or domain-independent (DI).
compute r s & security 49 (2015) 255 e 273