Fraud Is What People
Make of It: Election
Fraud, Perceived Fraud,
and Protesting in Nigeria
Ursula Daxecker
1, Jessica Di Salvatore
2,
and Andrea Ruggeri
3Abstract
Why do fraudulent elections encourage protesting? Scholars suggest that informa-tion about fraud shapes individuals’ beliefs and propensity to protest. Yet these accounts neglect the complexity of opinion formation and have not been tested at the individual level. We distinguish between the mobilizing effects ofactual incidents
of election fraud and individuals’ subjective perceptions of fraud. While rational updating models would imply that both measures similarly affect mobilization, we argue that subjective fraud perceptions are more consistent predictors of pro-testing, also being shaped by attitudes, information, and community networks. Our empirical analysis uses geo-referenced individual-level data on fraud events, fraud perception, and protesting from the 2007 Nigerian elections. Our analysis yields two main findings: proximity to reported fraud has no effect on protesting and citizens perceiving elections as fraudulent are consistently more likely to protest, and more so if embedded in community networks.
Keywords
election fraud, protest, fraud perceptions, election observers, Nigeria
1
Department of Political Science, University of Amsterdam, Amsterdam, the Netherlands
2
Department of Politics and International Studies, The University of Warwick, Coventry, United Kingdom
3
Department of Politics and International Relations, Brasenose College, University of Oxford, Oxford, United Kingdom
Corresponding Author:
Ursula Daxecker, Department of Political Science, University of Amsterdam, PO Box 15578, 1001 NB Amsterdam, the Netherlands.
Email: u.daxecker@uva.nl
Journal of Conflict Resolution 1-30
ªThe Author(s) 2019
Contrary to expectations of major irregularities and mass violence voiced in the run-up to the 2015 general elections in Nigeria, the vote took place without centralized systematic fraud and proceeded largely peacefully (European Union Election Obser-vation Mission [EU EOM] 2015, 4, 6, 31). Opposition party candidate Muhammadu Buhari won the presidential election, and results were quickly accepted by incum-bent President Goodluck Jonathan, bringing about the first peaceful hand over of power by an incumbent president in Nigerian history. In comparison, massive irre-gularities and violence in earlier elections in 2007 and 2011 had triggered wide-spread protests and rioting during and after the vote (EU EOM 2007, 1-3, 6, 27; EU EOM 2011, 3, 27). At face value, this evidence suggests a link between the incidence of election fraud and popular mobilization where elections marred by irregularities are followed by contention, whereas the absence of large-scale manipulation pro-duces more stable and peaceful outcomes. The political science literature largely confirms such a link between electoral manipulation, on the one hand, and nonvio-lent and viononvio-lent collective protest, on the other, suggesting that election fraud induces grievances and reveals information to citizens that combine to facilitate various types of collective action (Kuntz and Thompson 2009; Tucker 2007). Yet, while theoretical arguments focus on individual-level motivations, systematic empirical assessments have evaluated them at more aggregate levels (Daxecker 2012; Hyde and Marinov 2014). An aggregate analysis, though useful for highlight-ing general patterns, is limited in evaluathighlight-ing whether those engaghighlight-ing in postelection collective action are motivated by objective (i.e., experience or information) or subjective (i.e., perception) evaluations of electoral problems. If citizens protest because they perceive elections as fraudulent rather than because they have received information about fraud in their vicinity, the relationship between election fraud and protesting could be subject to a variety of confounding factors such as partisanship or other biases. While knowing whether fraud perceptions, actual events, or both motivate citizens’ decision to protest is crucial for scholarship and policy, these issues remain largely unexplored.
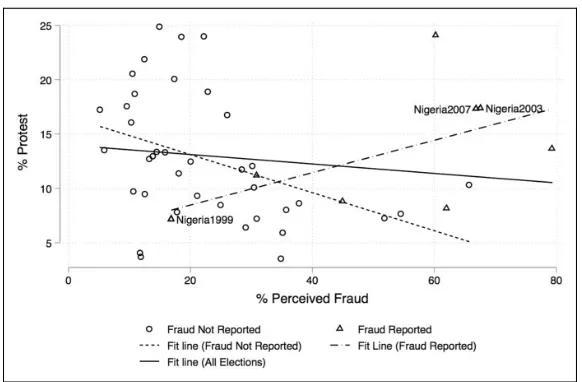
Figure 1 shows correlations in citizens’ protest participation, perceived electoral fraud, and fraud reported by international observers in recent African elections.1To create the figure, we aggregate data on fraud perceptions and protesting for all countries surveyed in Afrobarometer rounds 1 (1999 to 2001), 3 (2005), and 4 (2008) and combine them with information on fraud reported in most recent elec-tions by monitoring organizaelec-tions from the National Elecelec-tions in Democracy and Authoritarianism data (Hyde and Marinov 2012) and the Quality of Elections data (Kelley and Kolev 2010).2The resulting data set includes fifty country-year obser-vations with information on whether organizations reported election fraud, the per-centage of respondents perceiving elections as fraudulent, and the perper-centage participating in protests.
cases with and without observed fraud, whereas the solid line shows linear predic-tions for all observapredic-tions. The solid line indicates no clear association between fraud perception and protesting overall (r¼ .14) and a weak negative correlation in cases where monitors did not detect fraud or did not observe elections (r¼ .41). There is a moderate positive correlation between perception and protesting in observed elec-tions (r ¼.54), which is consistent with research showing that actual fraud, in particular if reported by international monitors, increases postelection protest (Hyde and Marinov 2014). Interestingly, the Nigerian elections in 1999 reveal a third, albeit empirically rare scenario. In these elections, fraud was reported by international monitors, but elections were not perceived as fraudulent by a large percentage of the population. We note that low fraud perceptions were accompanied by low protesting in the 1999 elections, but hesitate to draw broader inferences, considering the lack of other cases in this category. Overall, Figure 1 suggests diverging relation-ships for fraud perceptions, reported fraud, and protesting, supporting our call for disaggregated assessments.
[image:3.432.71.362.73.264.2]Our article makes four contributions. First, we introduce the distinction between reported incidents of electoral fraud, and hence more objective, and individual perception of electoral fraud, which is more subjective in comparison. The study of protest after electoral fraud has mostly assumed fraud to be an objective element of the rational calculus of mobilization, suggesting that individuals update their beliefs about fraud as a function of experiences with, or information about, actual fraud events. We argue that subjective perceptions are complex and are not simply reflections of factual information, suggesting a more consistent relationship
between fraud perception and mobilization than between reported fraud and mobi-lization. We purposely select the Nigerian 2007 elections as a case that fits macro-level patterns on reported fraud and protesting (see Figure 1) because it allows us to establish more convincingly whether aggregate patterns reflect causal pathways at the microlevel. In particular, we can trace and compare the effect of observational and perception-based measures of fraud on decisions to protest. Using disaggregated data on reported fraud by the European Union (EU) and domestic observers (among others), perceived fraud by citizens, and protesting from the 2007 Nigerian elec-tions, our empirical findings support the importance of individual percepelec-tions, confirming recent research linking individual fraud perceptions and protesting (Nor-ris 2014). Yet we find no clear evidence that protest is directly motivated by reports of fraud incidents in citizens’ proximity, which contradicts theoretical claims made in the existing literature. Validations of our fraud measure show that it has expected effects on other attitudinal indicators including decreasing citizens’ trust in the electoral commission. We also show that our findings are not a result of measure-ment error or systematic bias (See Online Appendix A2). In contrast, our study finds consistent effects of fraud perceptions on protesting, suggesting that people’s beliefs about whether fraud occurred may be subject to partisan or other biases rather than information about factual events. Scholars of US politics are increasingly exploring the causes and consequences of people’s divergent beliefs about their political environment, including the integrity of elections, but these issues have rarely been examined in developing countries, despite the fact that information scarcity and politicization may figure even more prominently.
Second, we explore potential reasons for the disparate findings for reported fraud and citizens’ fraud perception by examining a variety of confounding factors. We include support for losing candidates, citizens’ information levels, and individuals’ connections in the community to examine whether the effect of perceived fraud is conditional on these confounders. In contrast to other work (Robertson 2015), we do not find evidence consistent with a prominent alternative to the rational updating model of opinion formation, the motivated reasoning model. Political attitudes such as the winner–loser gap do not condition the effect of fraud perceptions on protest-ing. Similarly, we find no conditional effect for information levels, contradicting claims that fraud primarily mobilizes informed citizens (Norris 2014, 12). We find some evidence for a conditional effect of community networks. Individuals active in community organizations are more likely to mobilize if they perceived elections as fraudulent or were in the proximity of a reported fraud incidence (although the effect is weak for reported fraud). These findings support ample work on the importance of social embeddedness for mobilization (Granovetter 1985; Putnam 1994; Trejo 2012).
these organizations seem to assume. Practitioners suggest that observer reports influence citizens’ fraud perceptions (Merloe 2015), but we would then expect that fraud perceptions and information about fraud affect protesting similarly. Our find-ings are in line with recent work showing only limited effects of observers on perceptions of integrity (Bush and Prather 2017).
Fourth, our article shows that the choice of observation-based versus perception-based measures is not trivial. Recent trends toward disaggregation in the study of protest and conflict reflect an interest in testing theoretical mechanisms at appropriate levels of analysis. Yet existing literature relies primarily on subnational observational data cataloguing contentious events, ignoring that citizens may hold widely divergent beliefs about these events (Silverman 2018). In our study, only perception-based fraud measures produce findings consistent with theoretical expectations about the mobilizing effect of election fraud, whereas observation-based measures with high subnational disaggregation do not show any significant results. Citizens’ decision to protest in response to fraud hence seems shaped by their subjective perceptions of what is happening rather than neutral assessments of fraud events.
Elections and Collective Action
The literature on collective action has often noted the importance of elections as triggers of nonviolent and violent mobilization. Elections can function as focal
points that help create an occasion for participation in collective action (Oliver
1989; Schedler 2009; Tucker 2007). While elections have provoked reactive elec-toral mobilization in advanced, industrialized democracies, research has mainly focused on nondemocratic states holding elections because the disconnect between the principles and practice of participation appears crucial in motivating mobiliza-tion (McAdam and Tarrow 2010; Schedler 2009). Factors argued to contribute to electoral contention are elections in which intimidation and election fraud are wide-spread (Daxecker 2012; Fjelde and Ho¨glund 2016; Hyde and Marinov 2014; Kuntz and Thompson 2009; Trejo 2014; Tucker 2007), poor economic performance that induces voters to publicly express a desire for greater democracy (Brancati 2013), strong and effective opposition parties that help coordinate antiregime action (Beau-lieu 2014a; Bunce and Wolchik 2010), and antiregime protests in neighboring states inspiring protests (Beissinger 2007).
participation of many individuals, a focus on opposition parties, for example, relies on the implicit assumption that parties can mobilize voters at will and fails to consider whether, and how, individuals’ responses to elite behavior vary. Work that more clearly considers individual incentives to participate, such as arguments on how fraud aggrieves voters or how individuals’ desire for democracy is shaped by economic conditions, is better able to theorize individual motivations. Yet systema-tic empirical analyses of individual-level explanations assess the incidence of col-lective action in the aggregate by examining the yearly number of protests during elections or the level of violence per election (von Borzyskowski 2013; Brancati 2013; Daxecker 2012; Hyde and Marinov 2014; Trejo 2014). This “center-centered” focus of scholarship on electoral protest neglects significant subnational variation in the incidence of election fraud and protesting (Lankina 2015). Importantly, an analysis aggregated to the election country-year cannot tell us whether people turn-ing out to protest are motivated by fraud events, fraud perceptions, or both. Explicit theorizing on fraud as a motivation for protesting and systematic empirical tests at the individual level is thus missing in the literature on electoral mobilization.
From Election Fraud to Protesting: Explaining
Individual Incentives
Why do elections, and particularly fraudulent elections, affect citizens’ decisions to protest?3Scholars have noted that the introduction of elections produces a desire for the expressive benefits of voting even in nondemocratic regimes (Gandhi and Lust-Okar 2009). As Schedler (2009) puts it, electoral authoritarian regimes “institute the principle of popular consent, even as they subvert it in practice,” yet thereby endow-ing “citizens with normative as well as institutional resources” (p. 388) that can be utilized to engage in collective protest. Fraudulent elections can thus function as focal points for collective action, facilitating coordination and allowing discontent with the system to crystallize into electoral mobilization (Schedler 2009; Tucker 2007).
Proximity to Fraud and Mobilization
intimidation, who are prevented from voting, who are pressured to sell their vote, or who observe ballot stuffing should experience more grievances and thus be more likely to mobilize (Kuntz and Thompson 2009).5With regard to information, those close to actual fraud should be more likely to find out about it, whether through acquaintances or the media. Increasingly certain beliefs about fraud subsequently alter individuals’ cost–benefit calculation, increasing their confidence in the like-lihood of a protest being successful (Little 2012; Tucker 2007).6Moreover, infor-mation about fraud can spread to other communities once evidence on fraud is reported in the local media.7
Proximity to fraud events, then, should be linked to a greater propensity for protesting because it means citizens may have experienced fraud firsthand or because they receive information about its incidence. The first hypothesis thus posits that proximity to observed fraud leads to collective protest. Below, we also examine possible conditional effects.
Hypothesis 1:Individuals in the proximity of reported fraud are more likely to protest.
Fraud Perception and Mobilization
We proceed to discussing how citizens’ subjective perception of election fraud affects mobilization. On the one hand, prominent models of opinion updating expect that new information affects individual perceptions in unbiased and efficient ways (Gerber and Green 1999). For election fraud, this model suggests that individuals rationally update their beliefs when information about irregularities—whether through personal experience or the media—becomes available. Existing arguments on fraud and mobilization indeed imply that individuals update their perception of elections in response to credible information about fraud (Hyde and Marinov 2014; Tucker 2007), but these effects have not been established at the individual level (Bush 2015).8Practitioners similarly suggest that information about election fraud from journalists, citizen monitors, and domestic and international observers affects citizens’ perceptions of elections, although recent experimental work establishes only modest individual-level effects (Bush and Prather 2017). Hence, according to the rational updating model, individuals’ subjective perception of elections as frau-dulent should primarily be a function of knowing about fraud and affect mobilization in ways similar to proximity of fraud discussed above: citizens mobilize when information about fraud incidents becomes available.9
only those supporting the opposition would form fraud perceptions and protest. Below, we develop some of these possible conditional effects, but we first examine whether fraud perceptions have a direct effect on protesting. Since we examine the effect of proximity to fraud separately in Hypothesis 1, empirical results for the hypotheses will help determine the relative importance of actual versus perceived fraud in mobilizing individuals.
Hypothesis 2:Individuals who perceive elections as fraudulent are more likely to protest.
Conditional Effects
We have outlined direct effects of proximity to fraud and fraud perceptions in Hypoth-eses 1 and 2. However, a host of confounding relationships could also shape fraud perceptions or the effect of reported fraud on protesting, including the winner–loser gap, citizens’ information levels, and individuals’ connections in the community.
First, in contrast to rational updating, work on motivated reasoning finds that citizens’ political orientation influences how information is acquired and processed, with the result that reports of election fraud increase fraud perception only for those already opposed to incumbents (Robertson 2015). Others have shown that those supporting losing candidates generally assess elections more critically (Beaulieu 2014b; Birch 2008; Cantu´ and Garcı´a-Ponce 2015), suggesting that a winner–loser gap shapes fraud perceptions. This gap implies that fraud perceptions mobilize only those who supported losing candidates. Similarly, for proximity of fraud, those supporting the winning candidate may not mobilize in response to fraud.
Second, since citizens have varying access to credible information about the incidence of fraud, the effect of fraud events but also fraud perceptions should be more pronounced in individuals with frequent media access or those most informed about politics (Kerr 2013, 828; Norris 2014, 14). The effect of fraud on protesting might thus be conditional on access to quality information about its incidence.
Finally, whether citizens mobilize when experiencing or perceiving fraud may also depend on whether they are active in civil society organizations (Boulding 2014; Trejo 2012). Such networks can lower the risk of mobilization and facilitate coordination, which would suggest that fraud perceptions have a stronger mobilizing effect on individuals with close ties to community organizations. Hence, our third hypothesis examines conditional effects of proximity to fraud and fraud perceptions on mobilization.
Hypothesis 3a:The effect of proximity to fraud and fraud perceptions on protesting should be more pronounced for individuals who voted for the losing party.
Hypothesis 3c: The effect of proximity to fraud and fraud perceptions on protesting should be more pronounced for individuals who are active local community members.
Research Design
Case Selection: Elections and Fraud in Nigeria
In Figure 1, we provided a first-cut analysis of reported fraud, fraud perception, and protesting at the election country-year level in Africa. While we argue that theoretical mechanisms need to be assessed at the microlevel, we aim to select a case that fits existing arguments and macro-level evidence. The 2007 elections in Nigeria are very close to the regression line in Figure 1 and thus represent the most likely scenario for findings on fraud and protesting in the existing litera-ture (Hyde and Marinov 2014). Hence, if we are facing an inferential fallacy due to data over-aggregation (Cederman and Gleditsch 2009), selecting a case on the regression line of the aggregate data allows us to test quantitatively the assumed theoretical mechanisms, distinguishing perceived and reported fraud at the indi-vidual level.
In addition, Nigeria is a useful test case because it is not a consolidated democracy: it frequently experiences electoral manipulation and contention over electoral out-comes. In 2007, Nigerian citizens voted in state assembly elections on April 14 and general assembly and presidential elections on April 21. The two largest parties were the ruling People’s Democratic Party (PDP) and the opposition party All Nigeria Peoples Party (ANPP). The PDP won in most states and its presidential candidate Umaru Yar’Adua received 69.8 percent of votes compared to 18.7 percent for ANPP candidate Muhammadu Buhari. Election fraud was widespread in both elections and involved both parties, as described in the EU report (EU EOM 2007). Incidents ranged from problems with the voter registration process, violence and intimidation of voters during the campaign, the theft and stuffing of ballot boxes in many areas, the intimi-dation of voters on election day, and extensive vote buying (Kerr 2013; Osumah and Aghemelo 2010; Rawlence and Albin-Lackey 2007).
To show the generalizability of our findings beyond Nigeria, the Online Appen-dix presents models of fraud perception and protesting for all African countries using data on respondents in Afrobarometer rounds 1, 3, and 4 (Table A7). We show that the positive effect of fraud perception on individual mobilization holds for all countries surveyed in Afrobarometer.
Data and Variables
We create a data set with all respondents from the fourth round of the Afrobarometer survey in Nigeria (Akinremi et al. 2008). Using respondents as the unit of analysis makes it possible to empirically test the mechanisms linking fraudulent elections to protest at the individual level. The survey was conducted in May 2008, that is, just over a year after the elections took place in April 2007. The sample consists of 2,325 individuals.12The survey includes information about the state, district, and town or village of each respondent. We used this information to assign geographical coordi-nates to respondents at the lowest level of aggregation, that is, the town or village. Approximately half of the towns were correctly identified using automated geocod-ing, while others were manually geocoded using sources such as gazetteers, inter-active maps, or online depositories of geographic coordinates.13 Town or village coordinates were retrieved for 2,225 respondents, but the remaining 100 respondents could not be coded and are thus not included in the analyses. These respondents are located in 230 of 775 local government areas (LGAs), the second-order administra-tive unit, in Nigeria.14
chance. Respondents are less likely to give socially desirable but incorrect answers when surveys offer face-saving alternatives (Persson and Solevid 2014). In addi-tional analyses (available on request), we reran our analyses on male, younger, and less-educated subsamples, that is, respondents who have been shown to respond more truthfully (Preisendo¨rfer and Wolter 2014). We do not find patterns consistent with social desirability bias.
We create two independent variables to test the hypotheses linking election fraud to protest. Our main explanatory variables for election fraud are (1) respondents’ proximity to fraud incidents reported in the EU EOM 2007 election observation final report and (2) respondents’ perceptions of election fraud. Hypothesis 1 expects that proximity to fraud incidents induces mobilization because individuals may have experienced fraud directly or obtained information about fraud occurring close to them. We provide several measures of reported fraud using information on election-day fraud from the detailed list of incidents reported in the EU EOM final report for the 2007 elections. The EU mission monitored both the state elections (April 14) and presidential elections (April 21), hence the EU final report contains fraud incidents occurring in both elections. The report contains 651 fraud incidents that occurred on election day, providing the source, location, and type (procedural breaches, violence, and classic election fraud) for each incident. In terms of source, the report includes events directly observed by the EU (54 percent of all incidents), but the remaining 46 percent relies on information from EU observer interviews with witnesses, infor-mants whose identity was known to EU observers, election officials, journalists, and domestic observer organizations such as the Transition Monitoring Group or the Justice, Development, and Peace Commission. This variety in reporting from inter-national and domestic monitoring organizations but also journalists and eyewit-nesses should help reduce the risk of selection bias and reporting bias. There is one exception: the EU EOM report indicates that for security reasons, observers could not be deployed in the states of Bayelsa, Delta, and Rivers, and no incidents were reported for those states. We include a dummy variable coded 1 for these three states in all empirical models to account for this omission. In robustness tests (section A4 in Online Appendix), we further examine potential selection bias in the reporting of fraud incidents in more detail but find no support for the most worri-some types of bias.
those LGAs or states. Hence, events affecting larger areas result in reported fraud in the closest polling station for each respondent. This procedure results in 651 geo-coded incidents, of which 215 are breaches of electoral procedures (type 1), 256 are violent events (type 2), and 180 are fraud events such as ballot stuffing (type 3).17 We use ArcGIS Version 10.3 to calculate several measures of Afrobarometer respondents’ proximity to fraud. Our main measure is a dummy coded 1 if a fraud incident was reported within five kilometer of a respondent in Afrobarometer, 0 otherwise; 22 percent of respondents are located within five kilometers of an inci-dent (see Table A8 for summary statistics). We selected the five kilometer threshold because it is proximate enough to plausibly expect that respondents received infor-mation about fraud. Furthermore, considering the distribution of polling stations in Nigeria, this threshold would on average encompass 50 polling stations per respon-dent.18In the Online Appendix (section A6.4), we examine heterogeneous effects across different types of fraud. More blatant or easily observable types of fraud, such as violence, may have stronger or more direct effects on protesting than other, less visible kinds such as procedural breaches or ballot stuffing. In models distinguishing fraud type, however, we do not find evidence of meaningful differences.
There are two concerns regarding our measure of proximity to fraud. First, it expects homogenous effects on mobilization, regardless of respondent’s settlement type. Yet proximity to fraud events in sparsely populated rural areas could imply that information about fraud is shared more rapidly across a smaller group of people. A second concern is that we do not have precise location information for Afrobarom-eter respondents and instead rely on the centroids of respondents’ villages, towns, or cities.19In large cities, this could be problematic because it might mean that respon-dents are further from fraud (or closer to it) than our measure indicates. In robustness tests, we also experimented with shorter distance thresholds and interacted proxim-ity measures and respondent settlement type (see Online Appendix A2.4). Our main findings on perceived fraud remain robust.
We create several additional operationalizations of proximity to reported fraud. We create additional dummies for fraud incidents within ten and twenty kilometers from a respondent. We also calculate three distance-based measures. First, we calculate individuals’ average distance to the three incidents closest to them. Sec-ond, we do the same for the five closest fraud incidents. Third, we measure indi-viduals’ distance from fraud (in kilometer). Distance varies from several meters to more than 190 km, but more than 94 percent of respondents are within 100 km of an incident.
about their trust in INEC. We create a dummy coded 1 if a respondent trusts INEC “somewhat” or “a lot,” 0 otherwise.
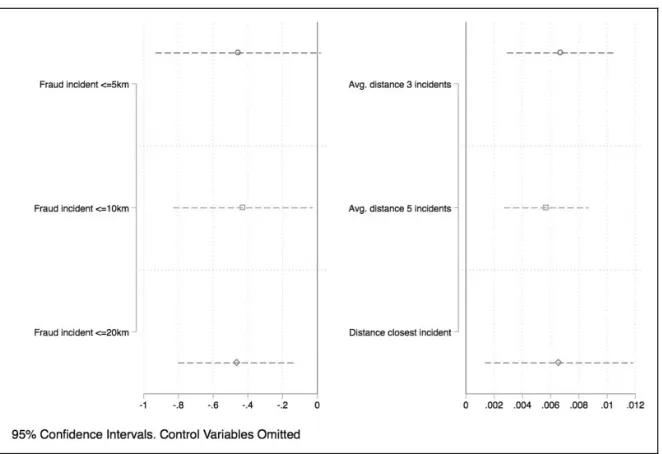
We include the same controls as in models of protesting, except for the temporal and spatial lag of protesting. The coefficient plot below (Figure 2; full results in Table A2.1 in Online Appendix) reports the results and shows that individuals within five, ten, or twenty kilometers of reported fraud are less likely to trust INEC. Similarly, the positive coefficients of distance-based measures suggest that the further away respondents are from fraud incidents, the more likely they are to trust INEC. This evidence shows that proximity to frauddoesaffect perceptions, robustly and in ways we would expect. If proximity to fraud was capturing a variety of factors unrelated to fraud, we would not observe these meaningful reductions in trust for electoral institutions. Hence, this exercise strengthens the validity of our reported fraud measures by confirming their expected effects on respondents’ trust in elec-toral institutions as captured in the Afrobarometer survey. The Online Appendix (section A2) provides additional validations of the proximity to fraud measure.
[image:13.432.52.383.73.300.2]We proceed to discussing fraud perceptions, the second main independent vari-able. Hypothesis 2 expects that citizens’ perceptions of election fraud motivates protests. We code perceptions with a dummy using respondents’ answers to the following question (Q71): “On the whole, how would you rate the freeness and fairness of the last national election, held in 2007?” We code fraud perception as 1 if
respondents say elections have been “not free and fair” or “free and fair, but with major problems.” More than 67 percent of the respondents in the sample evaluated the election as fraudulent, while 32 percent thought they were free and fair or had only minor problems (see Table A8 in Online Appendix for descriptive statistics). In robustness tests, we control for additional grievances to ensure that fraud percep-tions do not simply reflect other economic, ethnic, or other political grievances (Table A6.2).20
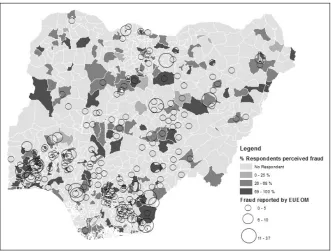
Figure 3 depicts the geographical distribution of fraud perception and fraud incidents across LGAs in Nigeria. For fraud perception, LGAs with darker shades represent a higher percentage of respondents perceiving fraud. For fraud incidents, we show the number of all types of fraud incidents for each LGA. Note that LGAs in the lightest shade of gray are those without respondents in round 4 of the Afroba-rometer survey.
[image:14.432.51.382.74.325.2]Our third hypothesis argues that the effect of fraud (real or perceived) could be conditional on other factors. Partisan biases, access to information, and community networks could affect whether people perceive elections as fraudulent, and an effect of perception could thus be conditional on these attitudes. Similarly, those close to fraud events might mobilize only if they supported losers, are informed, or
are active in their community. To examine whether these confounders affect the estimated effect of fraud, we code three additional variables from the Afrobarom-eter survey that we include as controls in all models but also interact them with proximity to fraud and fraud perception (Figure 4; Table 3). First, we use infor-mation on vote choice to capture the “win–loss status” identified as influential in shaping fraud perceptions (Robertson 2015).21 Unfortunately, Afrobarometer did not ask respondents about their vote choice in 2007 but asked which party they would vote for “if presidential elections were held tomorrow.”22 We use respon-dents’ answers to this question to code whether they did or did not vote for the incumbent, the PDP. Only 43 percent of the respondents declared they would vote for the PDP.23
The variable is coded 1 if respondents indicate that they would not vote for the PDP, since that implies they likely supported a losing party in 2007. Second, not all individuals have equal access to information or interest in political processes, mean-ing the effect of fraud as a coordination device may be conditional on individuals’ access to information. In the survey, 78 percent of respondents owned a radio, while only 58 percent has a television (55 percent has both). We thus create a dummy for individuals who listen to radio news every day (58.6 percent). Third, citizens with strong ties in the community may be more likely to act on fraud since these com-munities will mobilize them to contest the electoral outcome. A dichotomous vari-able is used to identify individuals who are active members of religious groups or other community-based associations. Active community members amount to 58 percent of the sample.
We control for several other factors that could affect mobilization, fraud perception, and/or proximity to fraud. Using round 4 of Afrobarometer, we begin with individual characteristics, controlling for the age of respondents, whether they are from urban areas, and whether they voted in the 2007 elec-tions. We then control for an indicator at the census enumerator area (EA) level (the smallest administrative unit used by the national census), namely, whether most houses in an EA have access to electricity. We also control for the (logged) number of polling stations within a respondent’s LGA since the num-ber of stations close by could affect both individuals’ propensity to find out about fraud and the likelihood of mobilization. There were more than 118,000 polling stations in Nigeria for 2007 elections, with a mean of 232 per LGA. The map in the Online Appendix shows the distribution and density of the polling booths (Figure A3). We also include a dummy variable for the three states that were not visited by EU observers for security reasons (Bayelsa, Delta, and Rivers).
changes in Afrobarometer with each round. We therefore aggregate information for respondents in round 3.5 to the LGA level and assign values to round 4 respondents for the same LGA for all LGAs surveyed in both rounds. Because Afrobarometer uses clustered sampling, an additional challenge is that the LGAs included in the two rounds are not identical. When a respondent’s LGA in round 4 was not surveyed in round 3.5, we calculated the spatial lag of the above-mentioned variables, hence to have geographically similar values, from round 3.5, and used it to replace unmatched LGAs in 4. A detailed discussion of the construction of these variables is provided in section A4 in the Online Appen-dix. From round 3.5, we thus include a dummy variable for LGAs experiencing protests, a dummy for police presence, two ordinal measures of past living conditions and individuals’ expectations of fraud in the 2007 election, and the spatial lag of protesting to account for spatial interdependencies.24 Table A8 in Online Appendix presents descriptive statistics for all variables. We use logistic regression with LGA clustered standard errors to estimate the effect of perceived and actual electoral fraud on the likelihood of protests. While not all of our variables are measured at the individual level, we cannot specify multilevel models because Afrobarometer only oversamples the South-South region of Nigeria and the number of respondents within LGAs is strongly unbalanced, varying from 1 (Karaye, in the North) to 46 (Port Harcourt, in the South). We include respondents’ survey weights in the logistic regression to account for selection probabilities and oversampling.
Results
We proceed to testing Hypotheses 1 and 2 and present results in Table 1. We estimate three baseline models. In the first two models, we include perceived fraud and reported fraud separately; in model 3, both are included in the specification. Table 1 shows that perceived fraud positively affects individuals’ odds of mobi-lization (models 1 and 3), while reported fraud has a positive but insignificant effect (models 2 and 3).
Table 1.Logistic Regression of Protesting, Baseline Models.
Model 1 Model 2 Model 3
Perceived fraud 0.371* 0.375*
0.186 0.186
Fraud incident5 km 0.259 0.308
0.243 0.242
Radio news 0.180 0.198 0.178
0.185 0.184 0.185
Community member 0.933* 0.956* 0.936*
0.193 0.190 0.195
Loser vote 0.375* 0.278** 0.346*
0.164 0.166 0.169
Not observed 0.513* 0.563* 0.608*
0.218 0.250 0.234
Age 0.006 0.006 0.005
0.006 0.006 0.006
Urban respondent 0.094 0.151 0.124
0.211 0.202 0.205
Access electricity 0.489 0.534** 0.467
0.310 0.310 0.316
Voted elections 0.097 0.061 0.102
0.194 0.192 0.194
Police presencet1 0.163 0.177 0.157
0.261 0.256 0.258
Protestt1 0.299 0.251 0.272
0.271 0.280 0.269
Expect unfair electiont1 0.218 0.251** 0.207
0.150 0.145 0.147
Bad living conditiont1 0.041 0.033 0.044
0.111 0.113 0.111
SpLag protest 0.725 0.765 0.683
0.506 0.492 0.501
Polling stations (log) 0.295** 0.348* 0.326*
0.155 0.155 0.159
Constant 1.943* 1.589** 1.805*
0.871 0.820 0.895
Observations 1,279 1,329 1,279
AIC 1,195.106 1,227.309 1,194.385
BIC 1,277.568 1,310.384 1,282.001
Note:Standard errors are clustered on local government area. AIC¼Akaike Information Criterion; BIC
¼Bayesian Information Criterion. *p< .05.
Table 2.Reported Fraud Operationalizations.
Model 4 Model 5 Model 6 Model 7 Model 8
Perceived fraud 0.370* 0.371* 0.403* 0.421* 0.385* 0.185 0.185 0.185 0.187 0.183 Fraud incident10 km 0.102
0.215
Fraud incident20 km 0.000 0.192
Average distance three incidents 0.003 0.002
Average distance five incidents 0.003**
0.002
Distance closest incident 0.004**
0.002
Radio news 0.178 0.180 0.172 0.171 0.167
0.185 0.185 0.185 0.185 0.184 Community member 0.932* 0.933* 0.945* 0.959* 0.942*
0.193 0.194 0.190 0.188 0.191
Loser vote 0.383* 0.375* 0.400* 0.400* 0.405*
0.166 0.165 0.164 0.166 0.168
Not observed 0.474* 0.513* 0.361 0.365 0.425*
0.229 0.228 0.241 0.233 0.214
Age 0.006 0.006 0.007 0.007 0.006
0.006 0.006 0.006 0.006 0.006
Urban respondent 0.081 0.094 0.054 0.047 0.051
0.206 0.203 0.210 0.211 0.207 Access electricity 0.503 0.489 0.529** 0.521** 0.546**
0.310 0.311 0.302 0.298 0.291
Voted elections 0.101 0.097 0.092 0.089 0.095
0.195 0.194 0.195 0.195 0.195 Police presencet1 0.159 0.163 0.154 0.153 0.165 0.261 0.262 0.262 0.262 0.265
Protestt1 0.309 0.299 0.356 0.396 0.350
0.280 0.281 0.279 0.283 0.285 Expect unfair electiont1 0.218 0.218 0.230 0.227 0.230 0.150 0.149 0.152 0.152 0.150 Bad living conditiont1 0.042 0.041 0.026 0.017 0.036 0.111 0.111 0.110 0.109 0.111
SpLag protest 0.756 0.725 0.781 0.770 0.775
0.516 0.514 0.507 0.500 0.509 Polling stations (log) 0.285** 0.295** 0.279** 0.281** 0.261**
0.156 0.155 0.151 0.152 0.151
Constant 1.986* 1.943* 2.294* 2.359* 2.368*
0.871 0.870 0.856 0.860 0.836
deter turnout from opponents (Bratton 2008), it is unlikely that fraud has an insignificant effect on protesting because it was used primarily in incumbent strongholds.25 Only distance from closest fraud event reports a statistically significant, positive coefficient, counterintuitively suggesting that those further away from fraud become more mobilized, but this result is driven by outliers. Only 8 percent of respondents are more than 100 km away from a fraud inci-dent; when these are removed from the estimation (results not shown), the coefficient for distance is insignificant. We thus find no empirical support for Hypothesis 1 across different possible operationalizations. In contrast, fraud perception has a positive and significant effect across all models in Table 2. In substantive terms, the odds of mobilization increase between 37 percent and 42 percent for respondents perceiving elections as fraudulent.
The results in Tables 1 and 2 show robust evidence for the mobilizing effect of perception, but no evidence that proximity to fraud affects protesting. We proceed to examining Hypothesis 3, which examines important conditional effects. As dis-cussed, potential political grievances resulting from having voted for losing party, information available to respondents, or citizen links within local community could condition how fraud perceptions affect mobilization. Moreover, these confounders could also explain why reported fraud alone does not affect individuals’ participa-tion to protests.
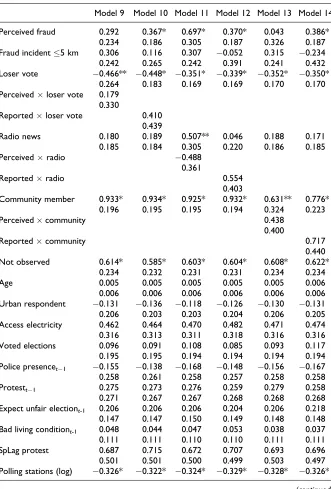
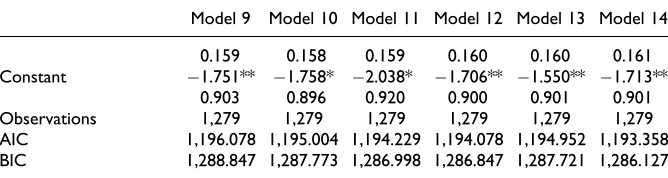
Table 3 presents models where we interact variables for loser vote, information, and community links with both fraud perception and reported fraud measures, test-ing the third hypothesis. For ease of interpretation, Figure 4 plots marginal effects for interactions between fraud perception, reported fraud, and confounders. For fraud perceptions (top panel), we find support only for the conditional effect of community networks (Hypothesis 3c). As Figure 4 shows, community membership does not increase protest propensities for individuals who do not perceive fraud. Yet individuals perceiving elections as fraudulent are more likely to protest if they are also active within their local communities. There is no evidence of similar effects on fraud perceptions for win–loss status or informed individuals. We find similar results for reported fraud (Figure 4, bottom panel). Having voted for electoral losers and paying attention to the media do not alter the effect of reported fraud on
Table 2.(continued)
Model 4 Model 5 Model 6 Model 7 Model 8
Observations 1,279 1,279 1,279 1,279 1,279
AIC 1,196.755 1,197.106 1,194.937 1,193.759 1,193.270 BIC 1,284.371 1,284.722 1,282.552 1,281.374 1,280.885
Note:Standard errors are clustered on local government area. *p< .05.
Table 3.Interactions with Loser Vote, Information, and Community.
Model 9 Model 10 Model 11 Model 12 Model 13 Model 14
Perceived fraud 0.292 0.367* 0.697* 0.370* 0.043 0.386* 0.234 0.186 0.305 0.187 0.326 0.187 Fraud incident5 km 0.306 0.116 0.307 0.052 0.315 0.234 0.242 0.265 0.242 0.391 0.241 0.432 Loser vote 0.466** 0.448* 0.351* 0.339* 0.352* 0.350*
0.264 0.183 0.169 0.169 0.170 0.170 Perceivedloser vote 0.179
0.330
Reportedloser vote 0.410 0.439
Radio news 0.180 0.189 0.507** 0.046 0.188 0.171 0.185 0.184 0.305 0.220 0.186 0.185
Perceivedradio 0.488
0.361
Reportedradio 0.554
0.403
Community member 0.933* 0.934* 0.925* 0.932* 0.631** 0.776* 0.196 0.195 0.195 0.194 0.324 0.223
Perceivedcommunity 0.438
0.400
Reportedcommunity 0.717
0.440 Not observed 0.614* 0.585* 0.603* 0.604* 0.608* 0.622*
0.234 0.232 0.231 0.231 0.234 0.234
Age 0.005 0.005 0.005 0.005 0.005 0.006
0.006 0.006 0.006 0.006 0.006 0.006 Urban respondent 0.131 0.136 0.118 0.126 0.130 0.131 0.206 0.203 0.203 0.204 0.206 0.205 Access electricity 0.462 0.464 0.470 0.482 0.471 0.474 0.316 0.313 0.311 0.318 0.316 0.316 Voted elections 0.096 0.091 0.108 0.085 0.093 0.117 0.195 0.195 0.194 0.194 0.194 0.194 Police presencet1 0.155 0.138 0.168 0.148 0.156 0.167 0.258 0.261 0.258 0.257 0.258 0.258 Protestt1 0.275 0.273 0.276 0.259 0.279 0.258 0.271 0.267 0.267 0.268 0.268 0.268 Expect unfair electiont-1 0.206 0.206 0.206 0.204 0.206 0.218 0.147 0.147 0.150 0.149 0.148 0.148 Bad living conditiont-1 0.048 0.044 0.047 0.053 0.038 0.037 0.111 0.111 0.110 0.110 0.111 0.111 SpLag protest 0.687 0.715 0.672 0.707 0.693 0.696 0.501 0.501 0.500 0.499 0.503 0.497 Polling stations (log) 0.326* 0.322* 0.324* 0.329* 0.328* 0.326*
mobilization.26We find weak evidence of a conditional effect for community mem-bership. While the interaction term is not significant, Figure 4 shows that respon-dents active in communities have higher odds of mobilization when fraud is reported in their proximity, weakly supporting Hypothesis 3c. Reported fraud and community membership are mutually reinforcing and increase respondents’ likelihood to pro-test. This interaction effect, however, seems to be driven by community membership more than proximity to fraud, since those active in communities mobilize more even in the absence of proximate fraud events. Findings from interactions also question claims prioritizing aggregate over local effects of fraud. If fraud perceptions or reported fraud are diffused nationally through media or opposition parties, we would expect support for these conditional effects.
Additional Robustness Tests
[image:21.432.49.383.90.179.2]In additional robustness tests discussed in detail in the Online Appendix, we validate our dependent variable with observational data on electoral protest (A1), present additional validations of reported fraud (section A2), show a map of polling station locations and densities (A3), discuss the possibility of selection bias in the reporting of fraud events in the EU report (A4), and outline the construction of lagged variables from Afrobarometer round 3.5 (A5). The Online Appendix also presents additional models of protesting to examine interaction effects between observed and perceived fraud (A6, Table A6.1); control for eco-nomic, ethnic, or political grievances (A6, Table A6.2); show models at the LGA rather than the individual level (A6, Table A6.3); explore different fraud types (A6, Table A6.4); and present an extended baseline model that controls for individuals’ education level and income (A6, Table A6.5). Finally, to assess generalizability, we report the effect of perceptions and reported fraud using Afrobarometer surveys for all African countries (A7). Robustness tests confirm our main findings while addressing concerns regarding our inferences.
Table 3.(continued)
Model 9 Model 10 Model 11 Model 12 Model 13 Model 14
0.159 0.158 0.159 0.160 0.160 0.161 Constant 1.751** 1.758* 2.038* 1.706** 1.550** 1.713**
0.903 0.896 0.920 0.900 0.901 0.901 Observations 1,279 1,279 1,279 1,279 1,279 1,279 AIC 1,196.078 1,195.004 1,194.229 1,194.078 1,194.952 1,193.358 BIC 1,288.847 1,287.773 1,286.998 1,286.847 1,287.721 1,286.127
Note:Standard errors are clustered on local government area. *p< .05.
Figure
4.
Predicted
probabilities
of
conditional
effects
(Table
Conclusion
The mobilizing potential of fraudulent elections is the subject of a growing litera-ture. We depart from existing studies by examining the effects of election fraud on protest participation at the individual level. This emphasis on individuals addresses a mismatch between disaggregated theory and overaggregated empirical evidence in previous work. While theories focus on how election fraud provides information crucial for citizen coordination or produces grievances in voters that function as mobilizing shocks, empirical studies examine the effect of aggregate, election-level fraud assessments rather than individual assessments. For our individual-level anal-ysis, we purposely select a case that fits aggregate patterns established in the liter-ature. As Figure 1 at the beginning of the article shows, the 2007 Nigerian elections are close to the regression line, having been assessed as fraudulent by international and domestic observers and experiencing substantial postelection mobilization. Choosing such a case allows us to quantitatively assess two distinct pathways linking election fraud to mobilization. We distinguish between the mobilizing effects of reported and observational (and perhaps relatively more objective) measures of election fraud and individuals’ perception (and hence relatively more subjective) measures of fraud. Our results from the 2007 elections in Nigeria show that only fraud perceptions have a positive and consistent effect on protesting, whereas prox-imity to fraud documented by observers does not affect mobilization. Fraud percep-tion thus has strong and consistent effects on mobilizapercep-tion at the individual level in Nigeria, yet this pattern cannot be identified with aggregate data. Conversely, fraud reported by observers weakly correlates with protesting in the aggregate, yet we cannot identify individual-level effects.
problematic. Third, our findings fail to support the rational updating model of opinion formation but also its primary competitor, the motivated reasoning model. We find no evidence that information about fraud events leads to the updating of individuals’ beliefs, nor do our results show that partisan attitudes condition individuals’ fraud perceptions and mobilization. We thus need to develop models of opinion formation in unconsolidated democracies.
Acknowledgments
Earlier versions were presented at the 2015 International Studies Association Annual Con-ference in New Orleans, LA, the 2015 European Network for Conflict Research in Bonn, Germany, the 2018 Folke Bernadotte Academy Workshop on Elections in Emerging Democ-racies in Stockholm, Sweden, and the 2018 Mannheim Centre for European Research seminar series in Mannheim, Germany. We thank Sarah Bush, John Campbell, Hanne Fjelde, Thomas Flores, Mascha Rauschenbach, conference and workshop participants, theJCReditors, and anonymous referees for their helpful comments. We also thank Sarah Birch, Sarah Bush, and Thomas Flores for their helpful comments on earlier versions of the manuscript. Elio Ami-carelli provided excellent research assistance. Equal authorship implied, all remaining errors are our own.
Declaration of Conflicting Interests
The authors declared no potential conflicts of interest with respect to the research, authorship, and/or publication of this article.
Funding
The authors disclosed receipt of the following financial support for the research, authorship, and/or publication of this article: Daxecker received funding from the Netherlands Orga-nization for Scientific Research (NWO), Innovational Research Incentives Scheme Veni No. 451-13-030 and the European Commission, Marie Curie Career Integration Grant (CIG) No. 618422.
Supplemental Material
Supplemental material for this article is available online.
Notes
1. All figures in the article are created in Stata Version 14 using commands Plotplain and Plottig (Bischof 2018).
Democracy and Authoritarianism and Quality of Election. We cannot include round 2 (2004) since Afrobarometer did not ask respondents about fraud perception.
3. Other work has examined the effect of fraud perceptions on turnout (Birch 2010). 4. The subnational incidence of fraud is strategic. Yet, while theoretical work predicts that
swing voters should be targeted with fraud, empirical evidence has not produced con-sistent findings, thus not providing clear guidance on the subnational determinants of fraud (Mares and Young 2016).
5. Our data from the European Union Election Observation Mission (EU EOM) report include more than 600 instances of election fraud, discussed in detail in the empirical section. 6. This informational mechanism on fraud and protesting draws on threshold models of
protest by Kuran (1991).
7. Arguably, information about fraud can also spread to more distant locations through other channels such as cell phones, the national or international media, or opposition parties. For example, international election-monitoring organizations such as the Eur-opean Union (EU) publish postelection statements immediately after elections and more detailed reports just a few months later. Similarly, opposition parties could mobi-lize voters nationally in response to fraudulent elections. While we cannot rule out that mobilization also occurs through more aggregate channels, it seems implausible to expect no effect for local fraud incidence, especially for serious fraud events or those affecting large areas and lots of individuals. In empirical models (Figure 4 ; Table 3), we also examine interactions between opposition support, citizen information levels, and fraud incidence. These models fail to show that only informed individuals or those supporting the opposition mobilize in the face of election fraud, which is inconsistent with claims on the predominance of aggregate effects.
8. Brancati (2014) examines the individual-level effects of international election monitoring on citizen perceptions of electoral integrity, but the experimental treatment provides information about observers’ responsibilities rather than whether, or how much, fraud was detected in elections. Norris (2013) shows congruence between expert and citizen perceptions of electoral integrity but aggregates individual perceptions.
9. Election fraud is strategic and incumbents have an advantage in carrying out fraud, raising the possibility that areas with many irregularities are those where the state has greater coercive capacity, which could counter the mobilizing effect of fraud. To make sure that results on reported fraud are not influenced by state coercive capacity, our empirical models control for state presence.
10. While citizens were subject to extensive electoral manipulation, the vast majority did not accept these tactics as legitimate or simply part of the political process. In a study of the 2007 elections, Bratton (2008, 622-23) finds that only 7 percent of Nigerians considered vote buying “not wrong at all,” and even fewer, 5 percent, strongly supported the use of violence for political goals. Further, voters quite often reject vote buying offers (Bratton 2008). It thus seems reasonable to assume that Nigerians value voting for its expressive benefits and do not see it simply as a struggle over access to resources.
12. We lose observations because of missing values on the loser vote variable described below. Results shown in Tables 1–3 are robust if we omit this variable and run our models on the larger sample of respondents (results omitted).
13. We use the Stata package GEOCODE3 to retrieve coordinates using the name of loca-tions. Other sources used can be found at https://itouchmap.com/latlong.html, https:// www.postalcodedb.com/, http://geopostcodes.com/
14. Afrobarometer uses clustered sampling.
15. We use question 23C, Afrobarometer Nigeria round 4, which asks: “Here is a list of actions that people sometimes take as citizens. For each of these, please tell me whether you, personally, have done any of these things during the past year. If not, would you do this if you had the chance: attended a demonstration or protest march?” Answers are coded ordinally, and we code as 0 those not having attended and those indicating that they might if they had a chance. Only individuals having attended at least one protest are coded as 1. 16. In an e-mail conversation, EU EOM staff confirmed the use of Independent National Electoral Commission (INEC) codes. The EU EOM also provided us with an Excel sheet with all 118,307 polling units and coordinates from INEC.
17. This number is higher than the total (470) reported by the EU EOM because observers aggregate some incidents. For example, Incident Report No. A.15.06 aggregates fraud in nine different local government areas (LGAs) as a single event.
18. While 50 polling stations might seem like a large number, Nigeria has almost 120,000 polling stations because INEC aims to provide a polling station for a maximum of 500 voters within a one kilometer (in urban areas) and two kilometers (in rural areas) radius of each voter. In our sample, respondents were on average 667 m from a polling station. See Online Appendix A3 for additional discussion; again our results are not sensitive to the five kilometer threshold selected.
19. Afrobarometer does not share exact coordinates for respondents to protect respondents’ anonymity.
20. Another concern is that network effects from protesting could affect fraud perceptions rather than the other way around. We control for community membership in all models to control for such network effects. As an alternative (results not shown), we also added a control variable for respondents who often discuss politics with friends and family. Our main results unchanged. Moreover, in additional specifications (not shown), we aggregated data to the LGA level to see whether protests and fraud perception in the future (April 2008) predict expectations of fraudulent elections among respondents of an LGA in the past (January to February 2007). We find that LGAs with higher expec-tations of fraudulent elections before the polling had more respondents perceiving fraud after elections, but these LGAs were not more likely to experience protests. This suggests that anticipating fraud was not enough to mobilize individuals after elections, providing some evidence against a purely post hoc rationalization of protesting and fraud perceptions.
and could not easily be included in the analysis because respondents are not subnationally representative.
22. Another disadvantage of our measure is that respondents in nondemocratic regimes may not answer truthfully.
23. Official results show the People’s Democratic Party’s (PDP) Yar’Adua winning with 69.8 percent in 2007, but given the massive cheating, this figure should not be taken as actual PDP support.
24. Living conditions range from very good (1) to very bad (4), while the electoral fraud expectation variable ranges from 1 (not fair, not free) to 4 (completely free).
25. In the case of Nigeria, we find that most instances of fraud did not occur in states that strongly supported the incumbent party (PDP). Scatterplots (not shown) show that state-level vote shares for the PDP do not correlate with the number of fraud incidents reported by the EU (correlation¼ .08).
26. The effect of information on perceived and reported fraud remains the same when we operationalize information with a dummy for respondents’ interest in political issues (results not shown).
References
Akinremi, Taofeeq, Adewumi Gbenga, Bratton Michael, Olusegun Olaniyan, Olusola Moses, Liasu Idris, Segun Ajiga, Chukwuma Innocent, Omotosho Shola, Gyimah-Boadi Emma-nuel, Logan Carolyn, and Mattes Robert. 2008.Afrobarometer Round 4: The Quality of Democracy and Governance in Nigeria, 2008. Ann Arbor, MI: Inter-university Consor-tium for Political and Social Research.
Beaulieu, Emily. 2014a.Electoral Protest and Democracy in the Developing World. Cam-bridge, UK: Cambridge University Press.
Beaulieu, Emily. 2014b. “From Voter ID to Party ID: How Political Parties Affect Perceptions of Election Fraud in the US.”Electoral Studies35:24-32.
Beissinger, Mark R. 2007. “Structure and Example in Modular Political Phenomena: The Diffusion of Bulldozer/Rose/Orange/Tulip Revolutions.”Perspectives on Politics5 (2): 259-76.
Birch, Sarah. 2008. “Electoral Institutions and Popular Confidence in Electoral Processes: A Cross-national Analysis.”Electoral Studies27 (2): 305-20.
Birch, Sarah. 2010. “Perceptions of Electoral Fairness and Voter Turnout.”Comparative Political Studies43 (12): 1601-22.
Bischof, Daniel. 2018. “New Graphic Schemes for Stata: Plotplain and Plottig.”The Stata Journal17 (3): 748-75.
Borzyskowski, Inken von. 2013. “Sore Losers? International Condemnation and Domestic Incentives for Post-election Violence.” Working Paper. Florida State University. Boulding, Carew. 2014.NGOs, Political Protest, and Civil Society. Cambridge, MA:
Cam-bridge University Press.
Brancati, Dawn. 2014. “Building Confidence in Elections: The Case of Electoral Monitors in Kosova.”Journal of Experimental Political Science1 (1): 6-15.
Bratton, Michael. 2008. “Vote Buying and Violence in Nigerian Election Campaigns.” Elec-toral Studies27 (4): 621-32.
Bunce, Valerie J., and Sharon L. Wolchik. 2010. “Defeating Dictators: Electoral Change and Stability in Competitive Authoritarian Regimes.”World Politics62 (1): 43-86.
Bush, Sarah Sunn. 2015.The Taming of Democracy Assistance. Cambridge, MA: Cambridge University Press.
Bush, Sarah Sunn, and Lauren Prather. 2017. “The Promise and Pitfall of Election Observers in Building Election Credibility.”Journal of Politics79 (3): 921-35.
Cantu´, Francisco, and Omar Garcı´a-Ponce. 2015, September. “Partisan Losers’ Effects: Per-ceptions of Electoral Integrity in Mexico.”Electoral Studies39: 1-14.
Cederman, Lars-Erik, and Kristian Skrede Gleditsch. 2009. “Introduction to Special Issue on ‘Disaggregating Civil War.’”Journal of Conflict Resolution53 (4): 487-95.
Daxecker, Ursula. 2012. “The Cost of Exposing Cheating: International Election Monitoring, Fraud, and Post-election Violence in Africa.”Journal of Peace Research49 (4): 503-16. Daxecker, Ursula, Elio Amicarelli, and Alexander Jung. 2018. “Electoral Contention and
Violence (ECAV): Introducing a New Dataset.”Journal of Peace Research.
EU EOM (European Union Election Observation Mission). 2007.EU EUOM 2007 Nigeria— Final Report—Gubernatorial and State Houses of Assembly Elections and Presidential and National Assembly Elections. European External Action Service.
EU EOM (European Union Election Observation Mission). 2011.Nigeria—Final Report— General Elections 2011. European External Action Service.
EU EOM (European Union Election Observation Mission). 2015. Federal Republic of Nigeria—Final Report—General Elections 28 March 2015, 11 April 2015—July 2015. European External Action Service.
Fjelde, Hanne, and Kristine Ho¨glund. 2016. “Electoral Institutions and Electoral Violence in Sub-Saharan Africa.”British Journal of Political Science46 (2): 297-320.
Gaines, Brian J., James H. Kuklinski, Paul J. Quirk, Buddy Peyton, and Jay Verkuilen. 2007. “Same Facts, Different Interpretations: Partisan Motivation and Opinion on Iraq.”Journal of Politics69 (4): 957-74.
Gandhi, Jennifer, and Ellen Lust-Okar. 2009. “Elections under Authoritarianism.”Annual Review of Political Science12 (1): 403-22.
Gerber, Alan, and Donald Green. 1999. “Misperceptions about Perceptual Bias.” Annual Review of Political Science2 (1): 189-210.
Granovetter, Mark. 1985. “Economic Action and Social Structure: The Problem of Embedd-edness.”American Journal of Sociology91 (3): 481-510.
Gyimah-Boadi, Emmanuel, Mattes Robert, Bratton Michael, and University of Nairobi. 2007. Afrobarometer Round 3.5: The Quality of Democracy and Governance in Nigeria. Insti-tute for Development Studies. Ann Arbor, MI: Inter-university Consortium for Political and Social Research.
Hyde, Susan D., and Nikolay Marinov. 2014. “Information and Self-enforcing Democracy: The Role of International Election Observers.”International Organization68 (2): 329-59. Kelley, Judith, and Kiril Kolev. 2010.Election Quality and International Observation 1975-2004 : Two New Datasets. Available at: https://papers.ssrn.com/sol3/papers.cfm?abstract_ id¼1694654
Kerr, Nicholas. 2013. “Popular Evaluations of Election Quality in Africa: Evidence from Nigeria.”Electoral Studies32 (4): 819-37.
Kuntz, Philipp, and Mark R. Thompson. 2009. “More Than Just the Final Straw: Stolen Elections as Revolutionary Triggers.”Comparative Politics41 (3): 253-72.
Kuran, Timur. 1991. “Now Out of Never: The Element of Surprise in the East European Revolution of 1989.”World Politics44 (1): 7-48.
Lankina, Tomila. 2015. “The Dynamics of Regional and National Contentious Politics in Russia: Evidence from a New Dataset.”Problems of Post-Communism62 (1): 26-44. Little, Andrew T. 2012. “Elections, Fraud, and Election Monitoring in the Shadow of
Rev-olution.”Quarterly Journal of Political Science7 (3): 249-83.
Lodge, Milton, and Charles S. Taber. 2013.The Rationalizing Voter. Cambridge, UK: Cam-bridge University Press.
Mares, Isabela, and Young Lauren. 2016. “Buying, expropriating, and stealing votes.”Annual Review of Political Science19 : 267-288.
McAdam, Doug, and Sidney Tarrow. 2010. “Ballots and Barricades: On the Reciprocal Relationship between Elections and Social Movements.”Perspectives on Politics8 (2): 529-42.
Merloe, Patrick. 2015. “Election Monitoring Vs. Disinformation.”Journal of Democracy 26 (3): 79-93.
Norris, Pippa. 2013. “Does the World Agree about Standards of Electoral Integrity? Evidence for the Diffusion of Global Norms.”Electoral Studies32 (4): 576-88.
Norris, Pippa. 2014.Why Electoral Integrity Matters. Cambridge, UK: Cambridge University Press.
Oliver, Pamela E. 1989. “Bringing the Crowd Back in: The Nonorganizational Elements of Social Movements.”Research in Social Movements, Conflict and Change11 (1989): 1-30. Omotola, J. Shola. 2010. “Elections and Democratic Transition in Nigeria under the Fourth
Republic.”African Affairs109 (437): 535-53.
Osumah, Oarhe, and Austin Aghemelo. 2010. “Elections in Nigeria since the End of Military Rule.”Africana4 (2): 9-39.
Persson, Mikael, and Maria Solevid. 2014. “Measuring Political Participation—Testing Social Desirability Bias in a Web-survey Experiment.”International Journal of Public Opinion Research26 (1): 98-112.
Preisendo¨rfer, Peter, and Felix Wolter. 2014. “Who Is Telling the Truth? A Validation Study on Determinants of Response Behavior in Surveys.”Public Opinion Quarterly78 (1): 126-46.
Rawlence, Ben, and Chris Albin-Lackey. 2007. “Briefing: Nigeria’s 2007 General Elections: Democracy in Retreat.”African Affairs106 (424): 497-506.
Robertson, Graeme. 2015. “Political Orientation, Information and Perceptions of Election Fraud: Evidence from Russia.”British Journal of Political Science45 (1): 29-51. Schedler, Andreas. 2009. “Electoral Authoritarianism.”In The SAGE Handbook of
Compara-tive Politics, edited by Landman Todd and Robinson Neil, 381-393. Thousand Oaks, CA: Sage.
Silverman, Daniel. 2018. “What Shapes Civilian Beliefs about Violent Events? Experimental Evidence from Pakistan.”Journal of Conflict Resolution. Online first. Available at: https:// journals.sagepub.com/doi/10.1177/0022002718791676
Trejo, Guillermo. 2012.Popular Movements in Autocracies: Religion, Repression, and Indi-genous Collective Action in Mexico. Cambridge, UK: Cambridge University Press. Trejo, Guillermo. 2014. “The Ballot and the Street: An Electoral Theory of Social Protest in
Autocracies.”Perspectives on Politics12 (2): 332-52.