Optimising nutrient use efficiency in crop
production
Holly Jean Butler
B.Sc. (Hons) Biological Sciences with Biomedicine
This thesis submitted in partial fulfilment of the requirements for the degree of Doctor of Philosophy at Lancaster University
ii
This project was supported by the Centre for
Global Eco-Innovation and is part financed by the
iii
Declaration
I declare that the contents in this thesis are my own work and have not been submitted in
the same form for the award of higher degree at any other institution. Chapters 2-4 have
been peer reviewed and published as a consequence of this project, whilst Chapters 5-7
have been submitted for publication.
Holly J. Butler
iv
Contents
Title Page i
Centre for Global Eco-Innovation ii
Declaration iii
Contents iv
Acknowledgements viii
Abstract ix
List of Abbreviations xi
List of Figures xiv
List of Tables xix
Chapter 1 General Introduction 1
Chapter 2 Using Fourier transform IR spectroscopy to analyze
biological materials
Matthew J. Baker, Júlio Trevisan, Paul Bassan, Rohit Bhargava, Holly J. Butler, Konrad M Dorling, Peter R. Fielden, Simon W. Fogarty, Nigel J. Fullwood, Kelly Heys, Caryn Hughes, Peter Lasch, Pierre L. Martin-Hirsch, Blessing Obinaju, Ganesh D. Sockalingum, Josep Sulé-Suso, Rebecca J. Strong, Michael J. Walsh, Bayden R. Wood, Peter Gardner and Francis L Martin
Nature Protocols 9(8): 1771-1791 (2014)
56
Chapter 3 Using Raman spectroscopy to characterise biological
materials
Holly J. Butler, Lorna Ashton, Benjamin Bird,
Gianfelice Cinque, Kelly Curtis, Jennifer Dorney, Karen Esmonde-White, Nigel J. Fullwood, Benjamin Gardner,
v Pierre L. Martin-Hirsch, Michael J. Walsh, Martin R.
McAinsh, Nicholas Stone, and Francis L. Martin
Nature Protocols 11(4): 664-687 (2016)
Chapter 4 Application of vibrational spectroscopy techniques
to non-destructively monitor plant health and development
Holly J. Butler, Martin R. McAinsh, Steven Adams,
and Francis L. Martin
Analytical Methods 7(10): 4015-4378 (2015)
120
Chapter 5 Observation and quantification of Calcium uptake at
the adaxial surface of leaves of tomato (Solanum
lycopersicum)using Raman spectroscopy
Holly J. Butler, Steve Adams, Martin R. McAinsh, and
Francis L. Martin
Submitted for publication: Analyst August 2016
143
Chapter 6 Detecting nutrient deficiency in plant systems using
synchrotron FTIR microspectroscopy
Holly J. Butler, Steve Adams, Martin R. McAinsh, and
Francis L. Martin
Submitted for publication: Vibrational Spectroscopy
Invite for special issue ‘Prominent Young Spectroscopists’
vi
Chapter 7 Pre-symptomatic detection of Ca stress in tomato
using vibrational spectroscopy and next generation sequencing
Holly J. Butler, Steve Adams, Martin R. McAinsh, and
Francis L. Martin
Prepared for publication: Nature Communications
207
Chapter 8 General Discussion 246
References 252
Appendix I Other Publications 281
Application of IR spectroscopy to environmental
health monitoring using sycamore (Acer
pseudoplantus) as a sentinel species
J. Ord, Holly J. Butler, Martin R. McAinsh, Francis L. Martin
Analyst (2016) 141: 2896-2903
Gold nanoparticles as a substrate in bioanalytical
near-infrared surface-enhanced Raman
spectroscopy
Holly J. Butler, Simon W. Fogarty, Jemma G. Kerns,
Pierre L. Martin-Hirsch, Nigel J. Fullwood, Francis L. Martin
Analyst (2015) 140: 3090-3097
vii
Aluminium foil as a potential substrate for ATR-,
transflection FTIR and Raman spectrochemical
analysis of biomedical specimens
Li Cui, Holly J. Butler, Pierre L. Martin-Hirsch, Francis L. Martin
Analytical Methods (2016) 8(3): 481-487
304
Appendix II Conference Abstracts 312
viii
Acknowledgements
This project would not have been possible without the invaluable expertise, assistance and encouragement of my supervisors Professor Frank L. Martin and Dr Martin
McAinsh. They showed faith in a wide-eyed undergraduate and I’m forever thankful for the fantastic supervision they have imparted with me. Thanks to the Centre for Global
Eco-Innovation (CGE) and to Dr. Steven Adams at Plant Impact Plc for supporting and encouraging this research.
Endless thanks go to the Centre for Biophotonics and its members, specifically my two brothers Kelly Heys and Rebecca Strong, my spirit animal Maria Paraskevaidi, as well as Blessing Obinaju, Junyi Li, Georgios Theophilou, Alana Mitchell and the other wonderful people I’ve met and worked with along the way. Special thanks go to Dennis Touliatos, Richard Boyle, Dr Geoff Holroyd and Dr Dawn Worrall in the Plant Physiology and Molecular Biology lab groups for their help and guidance. I would also like to thank the Faculty of Science and Technology, UKEMS, the Royal Society of Chemistry, and the SPEC 2016 organising committee for awarding me with travel grants. A special mention must be given to the Clinical Infrared and Raman Spectroscopy (CLIRSPEC) network for welcoming me so warmly into the field of ‘spectrophilia’.
Ultimately, I have to thank those closest to me who have provided me with unsurmountable personal support and inspiration. To Mom and Dad – thank you for everything. From the experiences I’ve had, to my outlook on life, I owe it all to you
both. My motivation in life has always been to make you proud and I hope I have succeeded so far. To Hayley and Louis; thanks for instilling that competitive edge in me from an early age. Further thanks go to you both, as well as Ben and Pam, for providing me with the most welcome distractions in the world: Madison, Fynley, Lucy, Charley,
ix
Abstract
Food security for a growing population presents a significant challenge for crop
production, with increasing pressures upon agriculutral productivity. There is a vast need to improve crop yield and quality using an efficient approach that does not present negative environmental impacts. A novel interrogation technique that is able to provide information of the overall health of a plant, would be extremely beneficial in an
agriculutral, as well as research, setting. This information could be utilised to better understand the mechanisms of plant functions, including stress responses.
Vibrational spectroscopy encompasses a range of techniques that are able to derive chemically specific information from a biological sample in a rapid,
non-destructive and cost-effective manner. Fourier-transform infrared (FTIR) spectroscopy
and Raman spectroscopy are two such approaches and have been readily implemented across biological samples. However, their applications in the field of plant science have been relatively underexploited. This is largely associated with the presence of water and fluorescent metabolites found in plant tissues.
The application of attenuated total reflectance (ATR)-FTIR and spontaneous Raman spectroscopy for in vivo plant monitoring to elucidate spectral alterations indicative of healthy plant growth in a non-destructive manner. These approaches are able to characterise the biochemical signature of leaves at distinct developmental stages, and correspond to known biological processes within the leaf such as cell wall
expansion. This information is useful prior to monitoring studies as normal leaf growth could be considered background variance. No significant local or systemic effects manifest as a consequence of interrogation with these techniques, establishing this as a non-destructive approach for plant system investigations.
Raman microspectroscopy as a tool for monitoring nutrient uptake at the leaf surface is also considered, alongside complementary ion probe and elemental analysis. Such a technique is useful in the agrochemical production of foliar fertilisers, where the efficiency of specific formulae can be rapidly compared. This can also further the current understanding of nutrient transport into plant tissues, as well as translocation.
x successfully illustrated at concentrations as low as 15 mM using Raman
microspectroscopy. Ion probe analysis also complemented these findings, with elemental analysis unable to detect this subtle uptake of nutrients. This assay is now being
implemented in agrochemical practise as a fertiliser screening method.
Deficiencies in essential nutrients such as calcium are detrimental to crop yield and thus are a potential target for improving crop production. A range of spectroscopic methods, including the use of synchrotron radiation, were utilised to
pre-symptomatically detect these deficiencies prior to their onset in live samples. Coupled with multivariate analysis, these techniques discriminate between deficient and control
samples with high sensitivity and specificity, without extensive sample preparation that traditional analytical techniques require. These results suggest that Raman and ATR-FTIR spectroscopic approaches could highly valuable in the field, where plant health and nutrient status could be assessed rapidly in situ.
xi
List of Abbreviations
λ Wavelength
AES Atomic emission spectroscopy
ANN Artificial neural network
ANOVA Analysis of variance
ATR Attenuated total reflectance
AU Arbitrary units
BER Blossom end rot
Ca Calcium
CARS Coherent anti-Stokes Raman scattering
CCD Charge coupled device
CE Carbon equivalents
CGE Centre for Global Eco-Innovation
CLIRSPEC Clinical Infrared and Raman Spectroscopy network
CV Cluster vector
DBM Difference between mean
DP Penetration depth
DTGS Deuterated triglycine sulphate
E Energy
EC Epidermal cell
EDTA Ethylenediaminetetraacetic acid
EMCCD Electron-multiplying charge coupled device
f Frequency
FAAS Flame atomic absorption spectroscopy
FAO Food and Agriculture Organization
xii
FFPE Formalin-fixed, paraffin-embedded
FFS Forward feature selection
FTIR Fourier-transform infrared
FPA Focal plane array
GHG Greenhouse gas
GC Guard cell
GM Genetically modified
HCA Hierarchical cluster analysis
ICP Inductively coupled
IR Infrared
IRE Internal reflection element
InGaAs Indium gallium arsenide
Linac Linear accelerator
LD Linear discriminant
LDA Linear discriminant analysis
LDC Linear discriminant classifier
low-E Low emission
MCT Mercury cadmium telluride
MIR Mid-infrared
MIRIAM Multimode infrared IR imaging and microspectroscopy
beamline
MS Mass spectrometry
NA Numerical aperture
NE Newly expanded
NIR Near-infrared
OES Optical emission spectrometry
xiii
PC-DFA Principal component – discriminant function analysis
PCA Principal component analysis
QCL Quantum cascade lasers
RF Random forest
RNA Ribonucleic acid
SERS Surface-enhanced Raman spectroscopy
SFL Spectrometer focal length
SORS Spatially offset Raman spectroscopy
SG Savitzky-Golay
SNR Signal-to-noise ratio
SR Synchrotron radiation
SRS Stimulated Raman scattering
SVM Support vector machine
TERS Tip-enhanced Raman spectroscopy
TGAC The Genome Analysis Centre
UN United Nations
UV Ultraviolet
xiv
List of Figures
Title Page
Figure 1.1 Population growth since 1950 to 2015 6
Figure 1.2 The prevalence of undernourishment around the globe
between 2014-2016
8
Figure 1.3 Liebig’s law of the minimum 10
Figure 1.4 The relationship between nutrient availability and optimal
growth
14
Figure 1.5 Worldwide food wastage in 2007 16
Figure 1.6 The electromagnetic spectrum of light 20
Figure 1.7 Jablonski energy level diagram displaying the energy
transition processes in infrared, Raman (Stokes and
anti-Stokes) scattering and fluorescence.
21
Figure 1.8 Common vibrational modes of chemical bonds
characterised by the CH2 group of CH2X2 compounds.
22
Figure 1.9 The interaction of light with a sample 23
Figure 1.10 A Michelson interferometer 25
Figure 1.11 Schematic overview of the Diamond Light Source, at the
Rutherford Appleton Laboratory
26
Figure 1.12 Schematic of the three primary sampling modes in FTIR
spectroscopy; (A) Transmission FTIR; (B) Transflection FTIR and (C) attenuated total reflectance (ATR)-FTIR.
28
Figure 1.13 Typical infrared and Raman spectra of live plant leaf of the
Solanum lycopersicum
xv
Figure 1.14 Generalised overview of a spontaneous Raman
microspectrometer.
32
Figure 1.15 Examples of unprocessed IR and Raman spectra displaying
discrepant baselines.
34
Figure 1.16 The application of baseline corrections on Raman and IR
spectra
35
Figure 1.17 The effects of normalisation on baseline correction IR
spectra derived from three plants species
36
Figure 1.18 An overview of principal component analysis observing the
data transformation and the corresponding visual outputs
38
Figure 1.19 A comparison between PCA and PCA-LDA scatterplots. 39
Figure 2.1 Typical biological spectrum showing biomolecular peak
assignments
58
Figure 2.2 The instrumentation underlying the main forms of IR
spectroscopic sampling
58
Figure 2.3 FTIR spectroscopy work flow for imaging and diagnosis 59
Figure 2.4 Visual effect of different pre-processing steps on a set of FTIR spectra
60
Figure 2.5 Classification rates of all possible combinations between
three pre-processing, three feature extraction and two supervised classifier options
74
Figure 2.6 IR image reconstruction of a human colon mucosa 74
Figure 3.1 Schematic identifying light scattering after laser exposure
on a sample surface.
97
Figure 3.2 Raman microspectroscopy work flor diagram highlighting
key aspects of experimental design
xvi
Figure 3.3 Generalised overview of instrumentation options within a
typical spontaneous Raman spectroscopic microscope system
99
Figure 3.4 Simplified overview of the effect of laser excitation
wavelength on the fluorescence background
102
Figure 3.5 Raman spectra derived from blood serum containing 150
and 40 nm gold nanospheres
104
Figure 3.6 Examples of common troubleshooting issues during
spectral acquisition
113
Figure 3.7 A brief overview of pre-processing options in Raman
spectral analysis
114
Figure 3.8 Raman map of fixed endometrial tissue 115
Figure 4 Front cover of Analytical Methods 2015 7(10) 121
Figure 4.1 An overview of experimental principles and procedure 123
Figure 4.2 Visible effect of ATR-FTIR spectroscopy on leaf tissue 126
Figure 4.3 Cross-validated PCA-LDA 1D scores plot of ATR-FTIR
spectra to determine spectral effects of the technique
126
Figure 4.4 Cross-validated PCA-LDA 1D scores plots of Raman
spectra to determine spectral effects of the technique
127
Figure 4.5 Spectral data derived from ATR-FTIR and Raman
spectroscopy to identify alterations indicative of healthy growth
127
Figure 4.6 Spectra derived from ATR-FTIR and Raman with grouped
time points to depict spectral differences symptomatic of leaf development
xvii
Figure 4.7 Three biomarker extraction approaches to establish spectral
biomarkers indicative of plant development
129
Figure 4.8 Linear regression analysis at key biomarker wavenumbers 131
Figure 5.1 A schematic overview of experimental procedure 149
Figure 5.2 Example of the effects of surfactant use in Ca solution
dispersal
155
Figure 5.3 Proof of concept study observing Ca(NO3)2 solution upon
the leaf surface
156
Figure 5.4 First derivative spectra of aqueous Ca(NO3)2 with and
without EDTA
158
Figure 5.5 Raman intensity at 1050 cm-1 at different time points to
observe increased Ca(NO3)2 treatments
159
Figure 5.6 Raman intensity at 1050 cm-1 to observe uptake over
72-hours
160
Figure 5.7 Raman intensity at 743 cm-1 at different time points to observe increased Ca(NO3)2 treatments
161
Figure 5.8 Raman intensity at 743 cm-1 to observe uptake over
72-hours
163
Figure 5.9 Ca2+ ion concentration on the adaxial leaf surface in comparison to plastic and a glass surface
165
Figure 5.10 NO3- ion concentration on the adaxial leaf surface in
comparison to plastic and a glass surface
165
Figure 5.11 % Ca content within the ‘banded area’ and ‘remaining’ area
of leaflet using FAAS
168
Figure 6.1 Unprocessed spectra from benchtop FTIR with a globar
source in comparison to FTIR with SR
xviii
Figure 6.2 Microscope images from unfixed and fixed abaxial
epidermis from C. communis
189
Figure 6.3 A comparison of pre-processed spectra from unfixed
isolated abaxialepidermis and FFPE tissue from C. communis.
190
Figure 6.4 SR-FTIR spectral analysis of unfixed abaxial epidermis
from C. communis
193
Figure 6.5 Pre-processed spectra comparing the effects of varying Ca
availabilities in GCsand ECs
194
Figure 6.6 Leave-one-out cross validated PCA-LDA analysis of both
fixed and unfixed C. communis samples.
196
Figure 7.1 Fresh and dry weights of S. lycopersicum plants grown in
modified Hoagland’s solution to mimic Ca deficiency
219
Figure 7.2 Ca content (%) as determined by FAAS of Ca deficient
samples
221
Figure 7.3 Processed Raman mean spectra and corresponding 1D
PCA-LDA scatterplots for full Ca treatment
223
Figure 7.4 Processed Raman mean spectra and corresponding 1D
PCA-LDA scatterplots for Ca remediation
225
Figure 7.5 Processed ATR-FTIR mean spectra and corresponding 1D
PCA-LDA scatterplots for full Ca treatment
227
Figure 7.6 Processed ATR-FTIR mean spectra and corresponding 1D
PCA-LDA scatterplots for Ca remediation
228
Figure 7.7 Separation of Ca treatments replicates based upon gene
expression values derived from RNA-sequencing analysis.
230
Figure 7.8 Hierarchical cluster map of gene probes displaying intensity
differences in expression between Ca treatments
xix
List of Tables
Title Page
Table 1.1 The average concentration of essential macro- and
micro-nutrients in dried plant matter, their function within plant growth and the common symptoms of deficiency
12
Table 2.1 FTIR spectroscopy modes used for the interrogation of
cellular materials
61
Table 2.2 Sample types and preparation 63
Table 2.3 Typical conditions of the main variables affecting SNR in
spectroscopy instruments
65
Table 2.4 Some existing FTIR spectroscopy data analysis software 66
Table 2.5 Instruments and corresponding data acquisition software 68
Table 3.1 Raman microspectroscopy method derivatives and the
respective experiment benefits and limitations
99
Table 3.2 Data analysis software for Raman spectral datasets 106
Table 3.3 Commercially available instruments and corresponding
operational software
109
Table 3.4 Sensitivity and specificity rates of control and
endometrial cancer patients from blood serum and plasma 115
Table 4.1 Average CO2 assimilation for equivalent leaflets to
determine detrimental effects of ATR-FTIR spectroscopy 126
Table 4.2 Key wavenumber features determined by DBM, CV and
FFS feature extraction methods
128
Table 4.3 Top discriminating biomarkers as derived from feature
extraction techniques with tentative wavenumber assignments
xx
Table 5.1 The rate of ion uptake at the adaxial leaf surface using
ion probe measurements
166
Table 6.1 Discriminating spectral regions derived from Figure 6.3,
4 and 5 with tentative molecular assignments
191
Table 6.2 Discriminating biomarkers of Ca deficiency from
PCA-LDA analysis of SR-FTIR spectra of unfixed and fixed
C. communis samples
197
Table 6.3 Classification rates of each tissue sample and Ca
treatment (%) using a PCA-LDC
199
Table 7.1 Sensitivity and specificity values of binary SVM
classifiers for distinguishing Ca treatments
224
Table 7.2 Standard deviation of sensitivity and specificity values of
binary SVM classifiers for distinguishing Ca treatments
224
Table 7.3 Functional overview of genes identified within each
cluster identified using HCA between Ca treatments
232
Table 7.4 Top 5 differentially expressed genes with known function
from each hierarchical cluster between Ca treatments
1
Chapter 1
2
General Introduction
Contents
Page
Chapter Title Page 1
Contents 2
1.1 Aims & Objectives 4
1.2 Introduction 6
1.3 Food Security 8
1.4 Nutrient Use Efficiency 9
1.4.1 Nutrient Deficiencies 11
1.4.2 Fertilisers 14
1.4.3 Environment Impacts of Inefficient Crop Production 15
1.5 Calcium in Plants 17
1.5.1 Calcium Deficiencies 17
1.5.2 Calcium Signalling 18
1.5.3 Measuring Cytosolic Free Ca2+ 19
1.6 Vibrational Spectroscopy 20
1.6.1 Fundamentals of Fourier Transform Infrared Spectroscopy 23
1.6.1.1 Instrumentation 24
1.6.1.2 Light Sources 24
1.6.1.3 Sampling Modes 27
1.6.1.4 Detector 29
1.6.2 Fundamentals of Raman Spectroscopy 29
1.6.2.1 Instrumentation 32
3
1.6.3.1 Baseline Correction 33
1.6.3.2 Normalisation 36
1.6.4 Multivariate Analysis 37
1.6.4.1 Principal Component Analysis 37
1.6.4.2 Linear Discriminant Analysis 39
1.6.4.3 Classification Algorithms 40
1.6.5 Vibrational Spectroscopy in Plant Research 41
1.6.5.1 Applications of FTIR Spectroscopy 41
1.6.5.2 Applications of Raman spectroscopy 42
4
1.1 Aims & Objectives
This project has the fundamental aim of developing vibrational spectroscopic techniques for plant based research, with a focus upon agricultural applications. Specifically, the suitability of IR and Raman spectroscopies are evaluated as rapid, non-destructive, in vivo analytical techniques that are able to deduce molecular information without the need of extensive sample preparation steps. Known barriers to translation of biospectroscopy in plant research, such as water interference in IR and fluorescence in Raman, are investigated and the viability is determined.
Additional to this initial aim, the non-destructive nature of these approaches will be addressed; by monitoring any detrimental side effect of in vivo spectral acquisition on plant tissue. The spectral information derived from this study would then be correlated with known biological changes within these tissue, to determine the viability of the information extracted.
Once the suitability of these approaches has been determined, Raman
spectroscopy as a novel method to analyse the fertiliser efficiencies will be investigated. By using these techniques to observe and quantify Ca2+ uptake at the adaxial leaf
surface, the addition of key fertiliser components can be examined. With industrial collaboration, this approach would be fed directly into a fertiliser product production pipeline, where compositions could be compared readily.
Nutrient deficiencies have a significant impact on crop yield in agriculutral settings, and thus a range of spectroscopic measurements will be implemented to describe the biochemical alterations indicative of nutrient deficiency. Due to the importance of Ca as a plant nutrient, Ca stress will be the focus of these investigations. Initially, the analysis of fixed tissue using FTIR spectroscopy coupled to SR will be investigated and compared against traditional benchtop instruments. SR will also be used to derive FTIR measurements from fresh tissues with high water content, to overcome limitations of FTIR in plant research.
Subsequent to this investigation, blossom-end rot in S. lycopersicum, the
6
1.2 Introduction
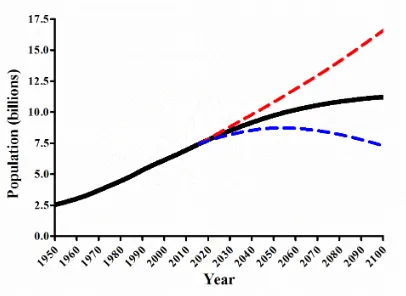
The total world population has been on a steep rise since the early 1950s and currently stands at 7.3 billion people; and this figure is expected to increase. By 2050, the population is projected to reach 9 billion people and will likely surpass 11 billion by 2100 (Figure 1.1)1. With increasing population size, there is an equivalent increase in pressure upon crop production due to the demand for sustainable food sources 2,3. In
order to provide a sufficient food supply for the growing population, it is imperative to improve agricultural productivity 4. It is estimated that as much as 70 – 100% more food
will be required to feed our population by 2050 5. There are a number of significant
barriers to this process namely; the availability of water, nutrients, and arable land, as well the effects of abiotic and biotic stresses upon crops and of course, climate change 6. All of these factors contribute to reduced agricultural productivity and thus the concept of food security is established.
[image:26.595.117.523.362.658.2]7 Fundamental plant research remains the key to optimising crop production and has spearheaded the ‘Green Revolution’ 7,8. The diverse field of plant science has
contributed to improved crop efficiency, ultimately resulting in increased crop yield and quality 9. There have been huge advances made in the field of genetically manipulated (GM) crops, creating more resilient crop species that are resistant to environmental stresses including disease, pathogens and herbicides 10-12. Although the development of
GM crops provides a powerful approach to improving agricultural productivity, there is a substantial ethical obstruction to real-world applications 13.
The selective breeding of organisms naturally resistant to stresses such as water scarcity, is one favourable alternative that has been particularly well exploited in plant research 14. The complementary use of pesticides has also contributed to overall
improvements in crop yield, although these present negative connotations with regards to unnecessary chemical use in the environment and food chain 15,16 . Movement away from traditional soil based growth protocols, such as using hydroponic systems, has also contributed to improved agricultural efficiency, as both water and nutrient supply are optimised for the specific crop 17.
Nutrient availability can be considered one of the most significant factors impacting crop yield and consequently fertiliser use is a primary resource for improving
productivity. Maintaining an optimum level of soil fertility is paramount to an effective agricultural environment and can significantly increase crop yield. However, the use of fertilisers is a relatively inefficient process, with the vast majority of current nutrient supplementation protocols focused upon a few specific nutrients, namely nitrogen (N), phosphorous (P) and potassium (K).
In order to optimise crop production by improving nutrient use efficiency, there is a need for a novel crop screening technology that will allow rapid determination of crop nutrient status, as well as to monitor the effects of nutrient supplementation. Generally speaking, plant monitoring and interrogation tools are often limited to technical
8 invasive, destructive, and time-consuming analytical processes that are not suitable for in situ investigation in field environments 19.
A technique that was able to derive nutrient specific biochemical information rapidly, non-invasively, with the potential of analysis in the field would be hugely beneficial to the field on plant biology. Specifically, the nutrient status of crops could be determined, allowing the exact nutrient requirements to be established. This is a
movement towards a precision farming approach where fertilisers are only applied at the levels to which are necessary, leading to more efficient resource use as well as increase crop yield and quality 20.
1.3 Food Security
Since first being coined at the first World Food Conference held by the United Nations (UN) Food and Agriculture Organization (FAO), the term ‘Food Security’ has evolved
21. Today the phrase encompasses the concept that everybody throughout the world has
continual access to safe and nutritious food that they require for a healthy and active lifestyle 22. It is evident that, even at this point in time, there is a significant shortfall in achieving this aim, with up to 795 million people currently experiencing food poverty 23.
9 The effects of insufficient food security are predicted to worsen, with the primary pressures of a growing population, land availability and climate change. This will likely be felt initially in rural areas of developing countries, where more than 70% of the world of the world’s starving population reside (Figure 1.2)24. However, there is predicted to be a significant effect throughout the world as the gravity of the problem increases 25.
The reader is directed to the following reviews for further information regarding the topic of food security which provide in-depth analyses of pressures and challenges surrounding this issue 2,26-28.
Crucial to achieving widespread food security is the ability to produce food in an
adequate quantity and quality in the most efficient way possible 29. There have been many advancements for optimised crop production such as the use of light emitting diode (LEDs) lighting systems in agricultural settings for providing optimal light and temperature conditions, as well as the use of vertical farming apparatus for space
efficiency in urban environments 30,31. Both of these approaches present increased energy efficiencies during crop production and thus simultaneously tackle the issues of
greenhouse gas (GHG) emissions associated with food production. However, one of the most significant factors in crop production is adequate supply of the essential nutrients to the crop and as such is the primary target for increased crop production efficiency 32.
1.4 Nutrient Use Efficiency
The availability of nutrients during crop development is crucial to optimum crop yield and quality 33. Plants require six essential macro-nutrients; nitrogen (N), potassium (K), phosphorous (P), calcium (Ca), sulphur (S) and magnesium (Mg), and eight micro-nutrients; boron (B), chlorine (Cl), copper (Cu), iron (Fe), manganese (Mn),
molybdenum (Mo), nickel (Ni) and zinc (Zn) 34. These nutrients are indispensable due to
their pivotal role in biochemical processes downstream of photosynthesis and all have specific roles in plant growth and development 32. Their transport is primarily in ionic
form through the soil and their uptake is dependent upon the root parameters, shoot-root
10 can absorb and utilise those nutrients, defined as the nutrient use efficiency 36. The relationship between nutrient availability and crop growth was well characterised by the work of Justus von Liebig, who established that crop growth was limited due to the least available nutrient rather than a generic availability of all nutrients 37. Referred to as Liebig’s Law of the Minimum, this theory is best described by Liebig’s Barrel, where
the shortest stave is responsible for water (yield) loss (Figure 1.3).
Figure 1.3. Liebig’s Law of the Minimum. Crop yield is dependent upon the most limiting
[image:30.595.150.494.225.692.2]11
1.4.1 Nutrient Deficiencies
Although nutrient deficiencies, particularly those of micro-nutrients, are relatively rare in nature, they are commonplace in agricultural systems due to intensive farming practises
38. Insufficient availability of essential crop nutrients has a detrimental impact on crop
growth and thus can significantly reduce crop yield (Figure 1.4). The theoretical yield, compared to the actual obtained yield of a given area is referred to as the yield gap 39. Nutrient availability is the main limiting factor in reducing this yield gap, but is difficult to quantify due to the diversity of arable lands, crop species and also the relationships of nutrients themselves 40. Nutrient uptake and deficiency are not independent of other nutrients and synergistic, antagonistic and additive relationships have been identified in nutrient stressed organisms 41.
Nutrient deficiencies can therefore manifest across a range of crop species, with a variety of species specific symptoms (Table 1.1). The tissues in which these symptoms manifest are often indicative of the mobility of the limiting nutrient. A mobile element can be readily translocated from one tissue to another and thus many symptoms are presented in mature tissues, where nutrients such as Mg and P are transported to younger tissues in deficient conditions 42. In contrast, a deficiency in immobile elements such as
Ca and Cl, results in insufficient nutrient supply to younger tissues from the soil, but also from older tissues 43.
However, the detection of nutrient deficiency of crops via visual symptoms is restricted; initially, due to non-specific symptoms and also due to delayed onset of deficiency 19. As Table 1.1 begins to illustrate, visual symptoms are analogous between different
elemental deficiencies, and can vary significantly between crop species. Furthermore, the interpretation of visual symptoms suggests that a nutrient deficiency has fully developed within an organism and by this stage remediation may already be impossible
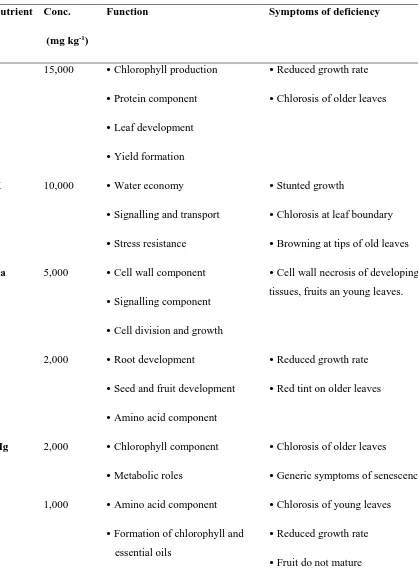
12
Table 1.1. The average concentration of essential macro- and micro-nutrients in dried plant matter (adapted from 34, their function within plant growth and the common symptoms of deficiency (adapted
from 33.
Nutrient Conc.
(mg kg-1)
Function Symptoms of deficiency
N 15,000 Chlorophyll production
Protein component
Leaf development
Yield formation
Reduced growth rate
Chlorosis of older leaves
K 10,000 Water economy
Signalling and transport
Stress resistance
Stunted growth
Chlorosis at leaf boundary
Browning at tips of old leaves
Ca 5,000 Cell wall component
Signalling component
Cell division and growth
Cell wall necrosis of developing tissues, fruits an young leaves.
P 2,000 Root development
Seed and fruit development
Amino acid component
Reduced growth rate
Red tint on older leaves
Mg 2,000 Chlorophyll component
Metabolic roles
Chlorosis of older leaves
Generic symptoms of senescence
S 1,000 Amino acid component
Formation of chlorophyll and essential oils
Chlorosis of young leaves
Reduced growth rate
13
Cl 100 Oxygen production in photosynthesis
Maintaining osmotic pressure
Chlorosis of young leaves
Wilting
Fe 100 Chlorophyll synthesis
N assimilation
Carbohydrate metabolism
Chlorosis of vascular tissues
Leaf chlorosis leading to white leaves
Mn 50 Water electrolysis in photosynthesis
Chlorosis of vascular tissues
Chlorosis of young leaves
B 20 Membrane integrity
Cell wall growth
Deformity of young tissues
Cracking of stalks and fruit
Zn 20 Enzyme systems
Protein synthesis
Stunted plant growth
Variable between species
Cu 6 Chlorophyll component
Lignin, protein and carbohydrate metabolism
Twisted leaves
Pale white shoot tips
Variable between species
Mo 0.1 Enzyme systems
Protein synthesis
Chlorosis of leaf margins
Rolling of leaves
Ni 0.1 Enzyme systems Reduced growth
14
Figure 1.4. The relationship between nutrient availability and optimal growth. Adapted from
38
Alternatively, nutrient stress can be identified using plant or soil analysis approaches, where the exact elemental content of these tissues is determined using an analytical approach such a inductively coupled plasma (ICP)-mass spectroscopy (MS), ICP- atomic emission spectroscopy (AES), ICP- optical emission spectrometry (OES),
flame atomic absorption spectroscopy (FAAS), and flame photometry 32,45,46. The result of tissue specific sampling is that an exact nutrient profile can be established and consequently remediation can be targeted. However, such approaches often require extensive sample preparation steps that are not easily implemented in agricultural environments.
1.4.2 Fertilisers
[image:34.595.125.525.83.321.2]15 the vast majority of fertilisers applied contain at least one of these essential nutrients. It is estimated that in 2016 alone, over 194.1 million tonnes of N, P and K containing fertiliser will be applied worldwide in order to improve soil fertility 47. Whilst this approach is effective when a reduction in these nutrients is present, this is not efficient when another essential mineral is the limiting factor; a deficiency can only be
remediated by supplementation of that exact nutrient, based upon the Law of the Minimum 33,37. Aside from being inefficient in regards to crop yield and agricultural
productivity, this is extremely costly to the grower and presents a host of negative
environmental impacts 48.
Furthermore, a plentiful supply of nutrients in the growth medium is not always a precursor to active absorption of these nutrients and thus nutrient stress can still occur 33. Nutrient uptake from the soil is dependent upon a number of root and soil parameters; a potential outcome of this is that some nutrients are not accessible from the soil, despite their abundance 35. As such, foliar fertilisers have been suggested as an alternative approach to nutrient supply, particularly as a short term aid to nutrient stress 49. There are a number of associated benefits of foliar rather than soil based fertiliser applications; largely centred upon the reduced volume requirement as well as potential improvement in nutrient recovery rate 50. Additionally, foliar nutrient applications can be combined with other crop treatments such as herbicides, for increased productivity 49.
1.4.3 Environmental Impacts of Inefficient Crop Production
There are a number of undesirable side effects of inefficient crop production, supplementary to the shortcomings in crop yield that are damaging to global food security. Broadly speaking these can be economical, social and also environmental; it is the latter of which is of interest in this instance.
The traditional approach to fertiliser application is a relatively inefficient process,
due to generic application of N, P and K containing fertilisers regardless of specific nutrient requirements of the crop. This, in itself, is highly inefficient, and there is also a
16 farmland each year, as 90% of total emissions from farm operations are attributed to fertiliser use 51. The extensive effects of fertiliser use on GHG emissions are excellently addressed by Snyder et al., and the reader is directed to this review for additional information 52.
N-based fertilisers also present other significant environmental issues that occur when they are leached from agricultural land. The loss of N into the surrounding
ecosystem has been shown to have negative impacts on human health, biodiversity and contamination of water supplies 53. Eutrophication is one such example of the
detrimental effects of fertiliser run off and can cause devastating loss of marine life 54.
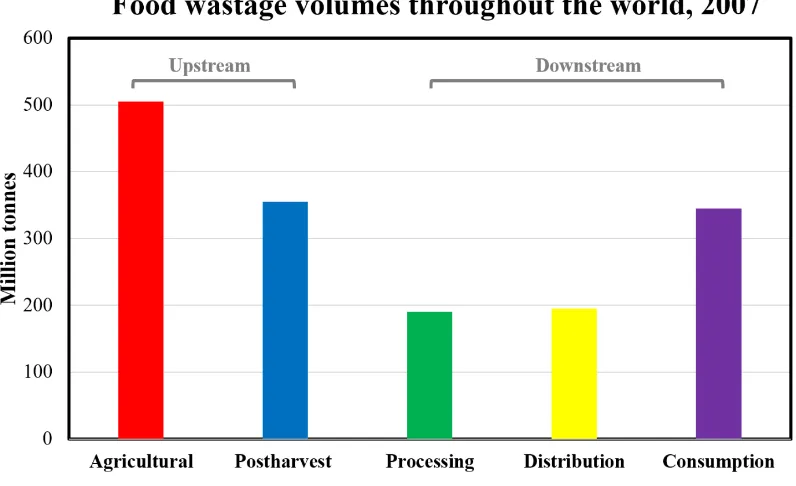
Figure 1.5. Worldwide food wastage in 2007, regarding the relative areas of the food production chain. Adapted from 55.
Aside from the impacts of fertiliser use in crop production, there is also the issue of food quality. Nutrient availability has a direct effect on crop yield, but also on crop quality, and thus inadequate growing conditions are transferred to the quality of the food. Up to 1.3 Gtonnes of edible produce was wasted worldwide in 2007 55. During
[image:36.595.113.511.297.540.2]17 produce is discarded purely based on appearance and shelf life, which is likely as a consequence of the nutrient status of the crop during growth 55. Downstream of this chain, specifically at retailers and in homes, an almost equivalent amount of food is wasted, with UK alone discarding 7 million tonnes of food every year (Figure 1.5) 56.
1.5 Calcium in Plants
Ca is an essential macronutrient in all living organisms that has a conserved function in many biological processes. Ca has a vital role in coordinating cellular responses and
signalling and acts as an important counter-cation in aiding anionic exchange across the plasma membrane in its divalent cation form (Ca2+). Ca2+ is cytotoxic to a cell at high concentrations as it has an affinity for biological molecules, causing precipitation of phosphate, aggregation of proteins and nucleic acids, and damage to the lipid membrane
57. As a consequence, controlling the concentration of Ca2+ has been a priority to a cell
since the early evolution of cellular life 58. It is thought that the energy expenditure of cells to maintain this homeostasis has been coupled through evolution to signal transduction in both eukaryotic and prokaryotic cells 59.
1.5.1 Calcium Deficiencies
Cahas a number of structural and functional roles in plants, particularly in binding strands of pectin together in the cell wall 60. A plant’s source of Ca is derived from the soil and is distributed through the plant via the apoplastic and symplastic pathways 61,62. Ca is relatively immobile in the phloem and consequently Cadistribution is largely reliant on xylem flow and therefore transpiration in particular tissues 63.
As a consequence of this, there are a number of Ca related deficiencies that can arise, which are commonly found in horticulture and agriculture 64. Ca deficiencies occur
when the element is unavailable in developing tissues, enclosed tissues and tissues that are supplied predominantly by the phloem 65. Insufficient Ca has been shown to cause up
to 50% loss of yield in crop production and has a distinctly negative impact on
18 ‘bitter pit’ affecting the fruit of tomatoes and apples respectively 68,69. Due to the
detrimental effect of these disorder, as well as the role that Ca2+ plays in fruit ripening, maintaining fruit firmness and reducing postharvest decay, Ca2+ supplementation in agriculture is becoming an emerging section of the crop enhancement market 60,70.
1.5.2 Calcium Signalling
Ca2+ is a fundamental signalling component of plant responses to environmental and
developmental stimuli, which are crucial to a number of plant functions such as
regulation of stomatal aperture 71. Due to the cytotoxic nature of Ca2+, the cytosolic calcium concentration ([Ca2+]cyt) must be kept at a tolerable level. [Ca2+]cyt is maintained
at a resting level of 100nM which can be up to a 20,000-fold difference from the extracellular Ca2+ concentration in the apoplast, a gradient that requires a substantial amount of energy to maintain 59.
This resting level in maintained by pumps and exchangers found on the cell plasma membrane, regulating efflux to the apoplast, and on endomembranes, regulating efflux to intracellular stores such as the vacuole and endoplasmic reticulum. These can be described as ‘off mechanisms’, an aspect of the by Ca2+ signalling toolkit described
by MJ Berridge and colleagues in 2000 in mammalian cells 72. The mechanisms in which [Ca2+]cyt are elevated in response to a stimulus can similarly be referred to as the ‘on
mechanisms’. To generate a transient Ca2+ signal, there is a passive movement of Ca2+
into the cytosol, which is mediated by a collection of channels that allow rapid influx of Ca2+ ions. Ca2+ floods the cytosol from both the apoplast via the plasma membrane and from intracellular stores via various endomembranes such as the tonoplast 73.
A role for calcium has been found to be ubiquitous with an array of plant functions, from stress signalling, to pollen tube growth , circadian clock regulation, pathogen interactions, and the highly researched area of regulation of stomatal aperture
74. A prevalent question is how such a simple ion can encode specificity in so many plant
functions. The issue of specificity is best described by the response of a plant cell to the
plant hormones auxin and abscisic acid (ABA), which both induce an elevation of [Ca2+]cyt although with opposite effects, as auxin stimulates stomatal opening whereas
19 been found to be involved with the elevation of [Ca2+]cyt, it is evident that there is the
ability within a plant cell to generate complex calcium signatures. The comprehensive review by McAinsh & Pittman discusses several mechanisms that may contribute to encrypting specificity 77.
1.5.3 Measuring Cytosolic Free Ca2+
Many Carelated studies have been facilitated by the ability to measure intracellular free
Ca2+ in living cells. These basic, non-destructive methods have enabled the visualisation Ca2+ influx in guard cells in response to ABA, Ca2+ localisation pollen tubes and root hair cells as well a host of other key studies that have helped shape the current
knowledge of Ca2+ functionality 78. Current widely implemented methods include the application of Ca2+-sensitive fluorescent dyes, the calcium-sensitive luminescent protein aequorin, cameleon sensing proteins and Ca2+-sensitive microelectrodes 79. These dyes work on the basis that the sensor dye and its loading, in no way compromises normal cellular function 78.
A key aspect of imaging cytosolic free Ca2+ and Ca monitoring is that all of these approaches are limited to certain model species such as Arabidopsis thialana and
20
1.6 Vibrational Spectroscopy
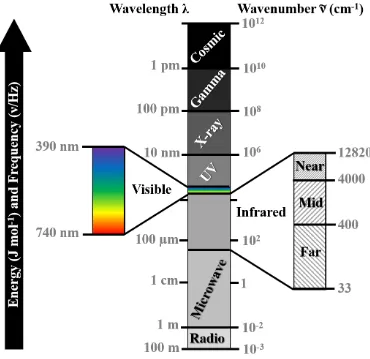
The principle of spectroscopy is the interaction between radiation and matter. Radiation is provided in the form of a wave that has both electric and magnetic field components. The electromagnetic spectrum describes the photon energy (E), wavelength (λ) and
frequency (f) of these waves (Figure 1.6). λ is inversely proportional to the f of the wave, whilst the f is proportional to the E. Photons are fundamental particles possess properties of both waves and particles, and can be described as having wave-particle duality. Max Planck pioneered mathematical modelling of photon energy as a function
of f and Planck’s constant describes the inverse proportionality of E to λ80.
[image:40.595.147.517.291.650.2]21 Vibrational spectroscopy is based on the principle that electromagnetic radiation causes chemical bonds to vibrate at energy levels higher than the zero-point energy 85,86. The molecules can only accept a photon that has the exact energy value required to elevate to a higher vibrational or electronic energy level. For many molecules, including biomolecules, this is in the mid-infrared (MIR) region, where fundamental bond
vibrations are excited to higher energy levels 84. An overview of energy transitions in vibrational spectroscopy is provided in Figure 1.7.
A given molecule will have a discrete number of vibrational modes dependent upon its chemical structure. A linear molecule will exhibit 3N – 5 modes, where N is the number of atoms in the molecule, and a non-linear molecule will have 3N – 6 vibrational modes 87. The disparity between the two is due to linear molecules being unable to rotate
upon their axis. Water, for example, has three distinct vibrational modes; the symmetric
22 and asymmetric O-H stretch [νs(O-H) and νsym(O-H) respectively] and the scissoring
mode [δ(H-O-H)] 88. A methylene group (-CH
2) of a CH2X2 compound, where X can be
any other atom, is often an example used to show the variety of vibrational modes and is overviewed in Figure 1.8.
Figure 1.8. Common vibrational modes of chemical bonds characterised by the CH2 group of
CH2X2 compounds.
These molecular bond vibrations may occur in the ground energy state; however, when a sample is irradiated with light this can occur at higher energy levels, and
consequently an alteration to the energy of the incidence photon occurs. This energy alteration can occur due to several distinct interactions with the sample, as portrayed in Figure 1.9. The incident light, at a defined energy intensity (I0), is partially absorbed
(IA), reflected (IR), and or transmitted (IT) through the sample 89. The absorption of
23 energy level, or inelastically (IIS) at an altered energy level. It is the latter of these
interactions that is the principle of Raman spectroscopy and is also discussed here. It is important to note that energy conservation is applicable in this instance and thus I0 = IA +
IR + IT + (IS + IIS).
1.6.1 Fundamentals of Fourier Transform Infrared Spectroscopy
Infrared (IR) spectroscopy measures the energy absorbed by a given sample, and is dependent upon the chemical bond vibrations resulting in a change in the dipole moment of the molecule and absorption of a photon 90. Consequently, some molecules that do not possess molecular dipoles will not be IR active, which is often the case in molecules that exhibit symmetry. The absorbance of energy by a given chemical bond can be
proportional to its concentration and follows the principle of the Beer-Lambert Law, thus allowing quantitative measurements using this approach 91,92. Instrumentation
Figure 1.9. The interaction of light with a sample results in absorption (IA), reflectance (IR),
transmission (IT), elastic scattering (Is), and inelastic scattering (IIS) of the incident photon
24 developments such as the Michelson interferometer and transformation algorithms have allowed rapid acquisition of IR spectra. In the following section, the principles of Fourier Transform (FT) IR spectroscopy are discussed; however, an in-depth review is presented in Chapter 2 that covers this topic in greater detail 3.
1.6.1.1Instrumentation
A standard benchtop FTIR spectrometer is composed of several key components: an IR light source, a Michelson interferometer, and a detector. The FT approach to acquiring
IR spectra is key to modern advancements in IR spectroscopy that allows the sampling of multiple light wavelengths in one measurement. This process is reliant upon the Michelson interferometer, a schematic of which is shown in Figure 1.10. In overview, an interferometer is comprised of two mirrors, one fixed and one adjustable, as well as a beam splitter. IR light is passed through this beamsplitter and focused upon both the fixed and adjustable mirror. When these two waves reflect back towards the
beamsplitter, they interact, effectively cancelling each other out when at equivalent pathlengths. As the adjustable mirror moves, the different pathlength results in two waves of different phases that consequently interfere when recombined. This
measurement of intensity as a function of distance (of the adjustable mirror) and time (mirror speed) is known as an interferogram 93. FT of this produces a typical IR spectrum that is plotted as a function of frequency in wavenumbers against spectral absorbance intensity 94.
1.6.1.2Light Sources
For FTIR spectroscopy, polychromatic light in the MIR region (4000 – 400 cm-1) is
used, where biological samples are known to vibrate 3. For traditional benchtop
25
Figure 1.10. A Michelson interferometer consisting of a fixed mirror, an adjustable mirror and a beamsplitter, that work to focus IR light at different wavelengths onto the sample under interrogation. Adapted from 97.
Synchrotron radiation (SR) is an alternative radiation source that is able to produce light up to 1000 brighter than conventional IR sources 98. Due to the superior
collimation of the IR light, it is possible to interrogate smaller area using apertures below the standard 10 µm spatial resolution achieved with globar sources 99,100. As with
traditional spectrometers, the minimum sampling area is still limited by the diffraction of light; however, SR is able to obtain spectra with increased spectral quality and intensity allowing increased sensitivity to subtle biochemical changes 101.
26 Diamond Light Source at the Rutherford Appleton Laboratory are available on a
proposal based process 102. An overview of this facility is provided in Figure 1.11. Initially, electrons are released from an electron gun via thermoionic emission and then accelerated using a linear accelerator (linac) which focuses the electron beam to high fluxes 103. These electrons are then further accelerated in the booster synchrotron using a
series of electromagnets that direct the beam until it approaches the speed of light, at which point electrons are then released into the storage ring where light is emitted 104.
This light is emitted at a range of wavelengths across the electromagnetic spectrum and
is thus applicable in IR studies.
27
1.6.1.3Sampling Modes
Commonly, FTIR spectrometers are coupled to microscope attachments that allow sampling from defined microscopic areas of a sample at high resolution. In this FTIR microspectroscopy approach, spectra can be obtained in two distinct sampling modes: transmission and transflection 105.
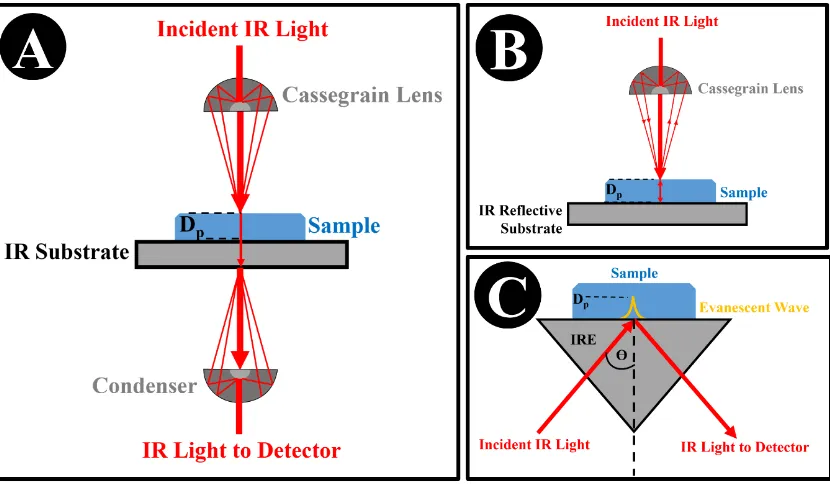
In transmission mode, the IR beam is passed through the sample and collected on the other side by a condenser and passed onto the detector, which is able to monitor alterations in the beam (Figure 1.12.A) 106. For this approach to be efficient, the sample
needs to be supported by a IR transparent substrate such as barium fluoride (BaF2) or
calcium fluoride (CaF2) 107. For transflection measurements, the IR beam is again passed
through the sample; however, the addition of an IR reflective slide is used to return the beam to the objective, where it is then collected by the detector (Figure 1.12.B). One benefit of this approach in comparison to transmission FTIR microspectroscopy is that reflective slides such as low-E have significantly lower cost implications, compared to high grade substrates required for transmission measurements. On the other hand, there is controversy in the field regarding the reproducibility of spectra obtained in
transflection mode, due to the presence of the electric field standing wave (EFSW) artefacts 108-110. Ultimately with both transmission and transflection measurements, sample thickness plays a substantial role in the resultant IR spectra, with a maximum thickness limit applicable for both modes as well as a minimum required thickness for transflection measurements due to the effects of the EFSW 3.
Due to the strong dipole present in the water molecule, H2O is highly IR active;
for this reason, samples that contain water are often swamped by absorption of this fundamental molecule. Consequently, samples obtained in transmission and transflectance measurements are largely limited to fixed tissues that have been dehydrated 111. Chemical fixative techniques such as formalin or ethanol fixation are
known to have significant impacts on IR spectra and thus limit spectral interpretation 112.
28 as diamond, zinc selenide, or germanium. Total internal reflectance (TIR) can occur within these prisms when IR is shone above a defined angle, known as the critical angle
115. The consequence of this is either a single, or multiple reflections, at the sample side
of the crystal, where an evanescent wave is produced. Thus when a sample is placed into contact with this IRE, it is interrogated with the evanescent wave 84. As with the basic
principles of IR spectroscopy, alterations to the energy of this beam as a consequence of vibrational of chemical bonds are detected using this approach.
One important consideration is the penetration depth (Dp) of the evanescent
wave, which is dependent upon the angle of incidence (ϴ), and the diffractive index of
[image:48.595.122.537.323.565.2]the IRE and the sample 116. Consequently, the optical thickness of the sample must be considered, or a reflective substrate should be used.
Figure 1.12. Schematic of the three primary sampling modes in FTIR spectroscopy; (A)
Transmission FTIR; (B) Transflection FTIR and (C) attenuated total reflectance (ATR)-FTIR. The net direction of the IR light is shown in each example as a thickened red line, although it is important to note that light will be shone from a variety of angles in the case of A and B. The angle of incidence in in ATR (ϴ), is fixed and is dependent upon the internal reflection element (IRE) of use. The depth of penetration (DP) is shown in each approach. These images
29
1.6.1.4Detector
Traditional benchtop FTIR spectrometers utilise single element detectors that obtain spectral information on a point-by-point basis 97. At ambient temperatures, deuterated triglycine sulphate (DTGS) detectors are often used due to their ease of use and
respectable spectral signal and sensitivity. However, liquid N cooled mercury cadmium telluride (MCT) detectors are more favourable for obtaining superior spectral quality, as using this photovoltaic approach yields is more sensitive to incident photons 106.
In regards to spectral acquisition, the use of these detectors enables spectral
measurements to be obtained from a single area, referred to as point spectra approach, but also allows for spectral mapping, where spectra are obtained in a point-by-point manner across a sample to then produce an image map 117. Using a point mapping approach, a spectral data cube is produced where the absorbance of a sample can be mapped with regards to its spectral information. Although highly informative and well implemented in the field of spectral histopathology, this approach is limited by
acquisition times due to the limitations of the detector 118,119.
The development of array detectors, such a focal plane array (FPA), have improved these acquisition times by allowing simultaneous measurements of spectra from defined points across a sample 120. An array is split into individual pixel areas which can be as low as 0.54 x 0.54 µm, providing extremely high spatial resolution by oversampling 3. This enhanced spatial resolution can often come at the price of reduced signal to noise ratio (SNR) in comparison to point approaches.
1.6.2 Fundamentals of Raman Spectroscopy
For an in-depth overview of Raman spectroscopy of biological samples, please see Chapter 3 in which a recently published article will encompass instrumental, sample and acquisition parameters of this technique. A brief overview of the technique will be provided here, also comparing Raman with the IR technique.
30
Figure 1.7 illustrates the Raman scattering effect and its two forms: Stokes and Anti-Stokes scattering. Stokes scattering occurs when the material exposed to radiation is in the ground energy state, and upon interaction with a chemical bond, is promoted to a higher energy level 122. The opposite is true for Anti-Stokes Raman scattering, as the material is already at an elevated energy level and returns to a lower energy level. The probability of Anti-Stokes shift is decidedly lower than its counterpart due to the increased likelihood that a material will be in its ground state at room temperature 123.
For this reason, the majority of benchtop Raman spectrometers measure Stokes
scattering, although coherent Anti-Stokes Raman spectroscopy (CARS) adaptations have resulted in increased signal strength and sensitivity 124.
Due to the inherently low probability of the Raman effect, Raman spectroscopy is a relatively weak signal and can be often enveloped by fluorescence contributions 125. A number of additional developments in the field of Raman spectroscopy have helped to overcome such issues, such as surface-enhanced Raman spectroscopy (SERS) and stimulated Raman spectroscopy (SRS) 126,127.
In in the case of vibrational spectroscopy, Raman scattering occurs as a
consequence of interaction with chemical bonds which have inherent polarisability 128. For a molecule to be considered polarisable, the electron cloud surrounding a molecule can be distorted. Thus, a Raman active molecule will exhibit a change in the
polarisability during a molecular vibration 129. Molecules with a strong dipole are often more difficult to polarise and so Raman spectroscopy can be considered complementary to IR spectroscopy, as not all polarisable molecules display changes in their dipole moment and vice versa 130.
An example of this in water; this is a highly polar molecule and consequently demonstrates strong absorption in the IR 88. In contrast, the strong polarity of this
molecule means that an incoming photon is unable to alter the electron field of these
bonds, and subsequently Raman spectroscopy is relatively insensitive to water contributions 123.
31 spectral features in comparison to the Raman spectrum. The broad peak between 3600 – 3000 cm-1 in the IR, is indicative of the νsym(O-H) bond of water, which is not apparent
in Raman spectra. This particular IR spectrum was obtained using ATR-FTIR spectroscopy and thus signal from a water containing sample was possible.
Similarly to IR spectroscopy, Raman spectra can be obtained in a point spectrum, point mapping and global imaging scale and thus allows imaging of samples to a high spectral resolution (diffraction limited). Furthermore, considerations to substrate choice must be made prior to spectral acquisition, as Raman active substrates will affect the spectral output of the approach. CaF2, quartz and metal-coated slides are considered
optimum, although the use of novel substrates such as aluminium foil has been shown
131-133.
32
1.6.2.1Instrumentation
There are a number of instrumentation options in a typical Raman spectrometer, the majority of which are covered in detail in Chapter 3. As in IR spectroscopy, Raman can be coupled to a microscope for spatial spectral measurements. A schematic overview of a standard Raman microspectrometer can be seen in Figure 1.14. Unless otherwise stated, spontaneous Raman microspectrometry will be discussed rather than alternative spectrometer approaches.
A typical Raman microspectrometer is composed of an excitation source, a
microscope with corresponding objectives, Rayleigh filters, a monochromator and a detector. Initially light of a defined light wavelength is focused upon the sample where vibration of polarisable bonds occurs which induces Raman scattering. In contrast to IR spectroscopy, Raman spectroscopy employs monochromatic light to interrogate samples and a range of wavelength frequencies can be used. Lasers are often in the visible region (wavelengths between 390 – 740 nm), although lasers from across the mid ultraviolet (UV; 200 nm) to the NIR (1084 nm) can be used. In this thesis, Raman spectroscopy will be described in regards to NIR Raman analysis using a 785 nm laser. The laser excitation wavelength has a direct effect on spectral dispersion and spatial resolution of the system as well as the overall spectral quality from a given sample 126,134.