© 2019, IRJET | Impact Factor value: 7.211 | ISO 9001:2008 Certified Journal | Page 6961
Prediction of cab demand using machine learning
Abdul Rahuman Aslam M A
1, Gobinathan V
2, Krishnan K
3, Rajasekaran G
41Student, Easwari Engineering College, Bhrathi Salai, Ramapuram, Chennai – 600089.
2 Student, Easwari Engineering College, Bhrathi Salai, Ramapuram, Chennai – 600089.
3Student, Easwari Engineering College, Bhrathi Salai, Ramapuram, Chennai – 600089.
4Assistant Professor, Easwari Engineering College, Bhrathi Salai, Ramapuram, Chennai – 600089.
---***---Abstract -
The cab service industry is booming for thelast couple of years and it is expected to grow in the near future. Taxi drivers need to decide where to wait for passengers as they can pick up someone as soon as possible. Passengers also prefer a quick taxi service whenever needed. The control centre of the taxi service decides the busy area to be concentrated. In the existing system, sometimes the taxis were scattered across the larger area missing the time based busy area like Airport, Business area, school area, Train stations etc. Effective taxi allocation can help both drivers and passengers to minimize the wait-time to find each other. In the proposed system, the future demand can be predicted using Recurrent Neural Networks based model that can be trained with given historical data. It can serve more customers in a short time by organizing the availability of taxi. The data set includes GPS location and other properties of the taxi like drop point, pickup point etc. This model is used to predict the demand for a particular time in different areas of the city.
Key Words: Taxi demand prediction, Recurrent neural network.
1.INTRODUCTION
Taxi drivers need to decide where to wait for the passengers so that they can pick someone quickly. Similarly, passengers also need to find their cabs quickly. Dispatching the taxi efficiently help both the customers and drivers. Effective dispatching of taxi helps to reduce waiting time for customers, as well as drivers.
A driver will not have enough information about where to wait in order to get passengers quickly. A taxi centre can organize and send the required number of taxis to the area based on the historical data. The historical data uses Global Positioning System (GPS) and predict future demand. In Tokyo, today this system is reducing the waiting time for the
customers, quickly respond to the sudden change of demands and it bridges the gap between the experienced drivers and novice drivers. These benefits allow the cab service to achieve maximum benefit. A real-time taxi demand prediction is proposed here and in this system, historical data is used to predict the future demand for taxis in a particular place at a particular time. Some of the real-time objectives include managing fleet of taxi to crowded area, effective utilization of resources to reduce waiting time, server more customers in a short time by organizing available taxi. Our system uses GPS location and other properties of the taxi like pickup point, drop point etc. to predict taxi demand. A model is trained using a recurrent neural network. The recurrent neural networks are used in speech recognition software. The recurrent neural networks are used for sequential data. It is being used in Google’s voice search and Apple Siri personal assistants. This algorithm is the achievement of deep learning in past years. Recurrent neural networks produce predictions result for the sequential data.
Taxi demand prediction is a time series analysis problem. It is a feed forward work neural network and the information moves from one network to another network and from the input layer to the output layer through the hidden layer. The difference between the normal neural network and the recurrent neural network is that in the recurrent neural network, the information cycles through the loop.
© 2019, IRJET | Impact Factor value: 7.211 | ISO 9001:2008 Certified Journal | Page 6962 learning algorithm. Recurrent Neural Networks take
the previous node output or hidden states as inputs. RNNs are useful as their intermediate values (state) can store information about previous inputs for a time interval. The main feature of a Recurrent Neural Network (RNN) is that the network possess at least one feedback connection, so the activations can flow round in a loop-wise manner.
That enables the networks to learn sequences and to do temporal processing, e.g., perform sequence recognition/reproduction or temporal association/prediction. Recurrent neural network architectures can have many variated forms. One common
The type that consists of a standard Multi-Layer Perceptron (MLP) plus added curves. These can escapade the powerful non-linear mapping capabilities of the MLP, and also have some form of memory. Since one can think about recurrent networks in terms of their properties as dynamical systems, it is needed to ask about their stability, observability and controllability:
Stability enterprises the boundedness over time of the network outputs and the response of the network output to minute changes to the weights or network inputs. Controllability is concerned with whether it is possible to control the dynamic behaviour patterns. An RNN is said to be controllable if an original state is steerable to a desired state within a finite number of sequential time steps. Observability is concerned with whether it is possible to observe the results of the control that is applied. A recurrent network is observable if the state of the network can be dogged from a fixed set of input and output measurements. The network input is the current taxi demand, while the output is the demand in the next time-step. The reason recurrent neural network is used is that it can be trained to store all the relevant information in a sequence to predict particular outcomes in the future. It is a time series forecasting problem to predict future demand. Hence, a sequential algorithm is used. It is desired to predict taxi demand in small areas so that the drivers know exactly where to go. The system is trained with the data set and create the model for future prediction.
A graph is plotted for the future prediction for the next time slot and the area to be crowded. This machine learning model predicts the future demand area in a
city based on neural network and the drivers were taken to wait in the area where the system identified as demand area.
2. RELATED WORKS
Fei Miao et al [1] proposed a modern robust transportation system that senses data collected from transportation systems that help in analyzing the passenger demands. Prediction Methods on taxi-passenger demand were travel time and travelling speed according to traffic monitoring data have been developed. In their proposed model Robotic mobility-on-demand systems that minimize the number of rebalancing trips and best parking systems that allocate resource based on a driver’s payments. These kinds of algorithms aim to reduce long mile or to minimize customers’ waiting time have been developed. Although optimization in robust approach aims to minimize the worst case cost under all possible random parameters, it results in average system performances. For a taxi dispatch system, it is essential to address the compensation between the worst case and the average dispatch costs under uncertain demand. Estimations show that under the robust dispatch framework we design, the average demand-supply ratio imbalance is reduced by 31.7%, and the average total idle driving distance is reduced by 10.130% or about 20 million miles in total in one year.
© 2019, IRJET | Impact Factor value: 7.211 | ISO 9001:2008 Certified Journal | Page 6963 the airport transport managers employ an approach
where it requires extended human intervention. They examine the corresponding p-values, which show the statistical significance of this difference. In this D-value is around 0:45 and p-D-value are less than 0.001. This means that neighbourhoods are different statistically for different k-values. If median and mean denote the improvement shown by the DIbiased weights method over the baseline method in terms of median and mean of prediction errors respectively for different k-values, the correlation between the corresponding D-values and the prediction errors, d_error (Median) and d_error (Mean) can be measured to show the relationship between the improvement in the dense quality neighbourhood and the prediction accuracy is improved. This paper shows Pearson’s correlation scores of 0.393 (with mean) and 0.484 (with median). They argue that the quality of the neighbourhood they identified is significantly improved by the consideration of relevant heterogeneous contextual factors, thus the performance is boosted (i.e. mean prediction error is less than 0.09 and the median prediction error is less than 0.06).
Desheng Zhang et al [3] states that the existing system of data collection is offline and collected by manual investigations and it may result in inaccurate data for real-time analysis. To address this, they have used a model called Dmodel, employing roving taxicabs and using them as real-time mobile sensors. By implementing this, they can infer arriving passenger moments by investigating the logical information. They used 450GB dataset of 14,000 taxicabs for a half year and it achieves 83% accuracy and outperforms the statistical model by 42%. Passenger demand prediction may be halted by bad weather, special events or accidents. They provide two parts of the solution for this. First, they mine a large dataset of historical data, consisting of taxi passengers and their related pickups. Second, to address the real-time dynamics, they consider thousands of taxi cabs and use them as real-time mobile sensors. It is possible because they use GPS data in dense urban areas. The front-end system and the back-end dispatching centre form a network called roving sensor network. The used Dmodel observes hidden contexts to infer demand based on historical and real-time taxi cab data. Dmodel analyses both the offline analysis of data and real-time data collected from roving taxis or sensor network formed by them. They used a novel
parameter, namely the pickup pattern. Dmodel utilizes the real-time pickup pattern so that the model can select customized and compact training data to increase the accuracy of inference. The use of Dmodel yields 83% accuracy and outperforms statistical model by 42%. They used a Hidden Markov Chain for implementation. The Dmodel- based dispatching outperforms basic and SDD based by 11% on an average. This is due to the accurate inference by Dmodel.
© 2019, IRJET | Impact Factor value: 7.211 | ISO 9001:2008 Certified Journal | Page 6964 incentives for each ride and also allowed the users
also to use their application by giving frequent discounts and offers and also promoted payment through the mobile phone. In this paper, they collected a 37-day trip data and use 9000 entries in Beijing. For the first 18 days there was no battle and for the next 19 days, the battle was competitive. The spatial-temporal data are studied and based on the comprehensive analysis, benefits and drawbacks are discussed. Taxi drivers welcomed this battle and started to accept every passenger they can so that they can achieve maximum benefits from incentives. Customers started to complain that they cannot find any taxis without using these apps. So, offline taxi services may get affected. So, this paper addresses that offline cab services may get affected. These companies wanted to increase the usage of mobile payments and hence used money promotion. Indirectly, money promotion increased cab service indirectly. Our paper helps both online and offline cab services, as it is purely dependent on historical data based on the Global Positioning System.
Nicholas Jing Yuan et al [6] proposed a recommender system for both cab drivers and people expecting to take a cab, using the knowledge of 1) passengers’ mobility patterns and 2) taxi drivers’ picking-up/dropping-off behavioural patterns learned from the GPS trajectories of taxicabs. In their method, they learn the above-mentioned knowledge (probability representation) from GPS trajectories of taxis. Then, they feed knowledge into a probabilistic model that calculate the profit of the candidate locations for a particular cab driver based on where and when the driver requests the recommendation. They proposed a defined approach to detect parking places based on a large number of GPS trajectories generated by taxis, where the parking places stand for the locations where cab drivers usually wait for passengers with their cars parked. They invented a probabilistic model to formulate the time-dependent taxi behaviors (picking-up/dropping-off/cruising/parking) and enable a city recommendation system for both passengers and taxi drivers. They also improve the taxi recommender by considering the time-varying queue length at the parking places. For both of the taxi recommender and the passenger recommender, they constructed a model consolidating day of the week and historical weather conditions to the varying pick-up/drop-off behaviors. They also perform large-scale evaluations including in-the-field user studies to
validate their system. They also built the recommender system with a data set generated by 12,000 taxicabs in a period of 110 days and evaluated the system by large-scale experiments including a series of in-the-field studies. As a result, the taxi recommender predicts accurately the time-varying queue in parking lots and the recommender successfully suggests the segment of the road where users can easily find vacant taxis. In the future, they also plan to deploy our recommender in the real world so as to further validate and increase the effectiveness and robustness of this system.
Jun Xu et al [7] proposed a system in which they used recurrent neural networks to predict the cab demand for the future based on the historical data which has GPS. They used Long Short Term Memory (LSTM) to predict the future demand. They used the LSTM in order to store the sequential data and predict the cab demand for future. LSTMs are used in handwriting recognition, Natural language Processing etc. LSTM used in this model uses some gating mechanism to store the previous value. In this model, they have used a Mixed Density Network (MDN) along with Long Short Term Memory (LSTM). This paper can achieve 83% accuracy in predicting the future cab demand and it contains 17% prediction error.
© 2019, IRJET | Impact Factor value: 7.211 | ISO 9001:2008 Certified Journal | Page 6965 ratio error across the city during one experimental
time slot by 45.02%.
3. SYSTEM ARCHITECTURE
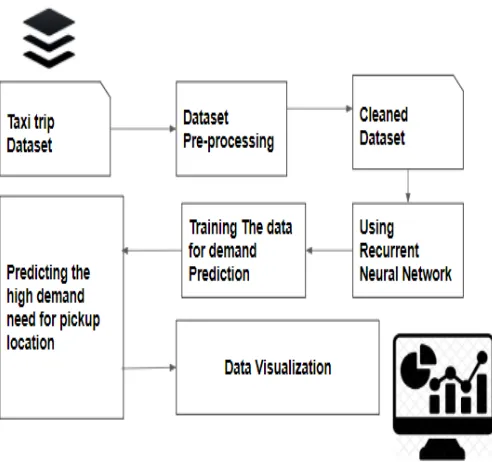
[image:5.595.50.296.432.663.2]The real word taxi-trip data set is collected. The collected data is pre-processed and the data preprocessing is a data mining technique that involves transforming raw data into an understandable format. Real-world data is often incomplete, inconsistent, and/or lacking in certain behaviors or trends, and is likely to contain many errors. The major tasks of the data preprocessing involves data cleaning, data integration, data transformation, data reduction etc. The missing values are identified and it is replaced with mean values. The cleaned dataset is fed to the recurrent neural network model and is it trained using historical data which consists of date, time, pickup location, weather etc. and the future demand for the taxi is predicted. Recurrent Neural Networks (RNN) are a powerful and robust type of neural networks and belong to the most promising algorithms out there at the moment because they are the only ones with an internal memory. The predicted demand for the cab is visualized using a graph.
Fig. 3.1 System Architecture
4. SYSTEM IMPLEMENTATION
The dataset consists of three columns and 30,426 entries. The minimum index value and
maximum index values are found. The maximum and minimum indices are used to format the dataset. The output consists of a graph consisting of missing values in the dataset corresponding to the given data with time in a one-hour interval in x-axis and number of pickups in the y-axis. It also consists of a graph consisting of bookings with time in a one-hour interval in x-axis and number of pickups in the y-axis. Once, missing values are found, the mean value for the columns is found and this value is replaced in the place of missing entries. There are a lot of options for replacing missing values but the simplest and the most common one is replacing them with the mean of all the entries under the respective column. At the end of the data preprocessing, a cleaned data set with no missing values is found and all the missing values in the data set were replaced by the mean of the respective columns. The cleaned dataset is important because there may be some irrelevant data in the dataset that may cause prediction error and causes inaccurate results. The Comma Separated file (CSV) is collected from the usage of the user and perform cleaning and processing, as a result of a cleaned data set is achieved. The cleaned data set is used for the next stage in predicting the taxi demand the recurrent neural network is applied to predict the future cab demand.
[image:5.595.342.559.456.635.2].
Fig. 4.1 Bookings graph
The figure 4.1 shows the plotted graph using matplotlib. pyplot, where it is plotted as a ratio of time in hours and number of pickups. The graph shows the number of pickups, at a particular date.
© 2019, IRJET | Impact Factor value: 7.211 | ISO 9001:2008 Certified Journal | Page 6966 of inputs and sequence of outputs. Recurrent Neural
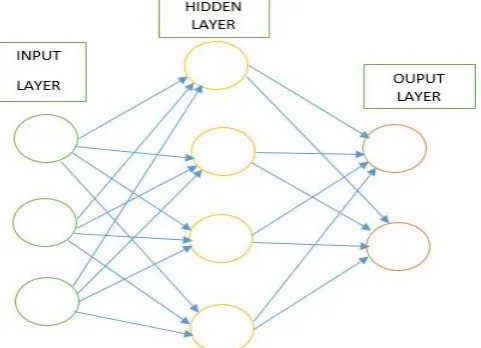
[image:6.595.40.281.284.458.2]Network is a class of Artificial Neural Network (ANN). The network input is the current taxi demand and other relevant information while the output is the demand in the next time-step. The reason a recurrent neural network is used is that it can be trained to store all the relevant information in a sequence to predict particular outcomes in the future. In addition, taxi demand prediction is a time series forecasting problem in which an intelligent sequence analysis model is required. It is desired to predict taxi demand in small areas so that the drivers know exactly where to go. The system is trained with the dataset and the model is used for future demand prediction.
Fig. 4.2 Artificial Neural Networks
Recurrent Neural Network considers previous input and the current input to compute the future output. For taxi demand, we use the RNN model because taxi data is a sequential data and it is a time series forecasting problem. Unlike, traditional neural network RNN has memory for storing relevant parts of the input and use it for prediction of the future demand. Recurrent Neural Networks take the previous node output or hidden states as inputs. RNNs are useful as their intermediate values (state) can store information about previous inputs for a time interval. The main feature of a Recurrent Neural Network (RNN) is that the network possesses at least one feedback connection, so the activations can flow round in a loop-wise manner. That enables the networks to learn sequences and to do temporal processing, e.g., perform sequence recognition/reproduction or temporal association/prediction. Recurrent neural network architectures can have many variated forms. One common type that consists of a standard Multi-Layer
[image:6.595.313.552.455.582.2]Perceptron (MLP) plus added curves. These can escapade the powerful non-linear mapping capabilities of the MLP, and also have some form of memory. Since one can think about recurrent networks in terms of their properties as dynamical systems, it is needed to ask about their stability, observability and controllability. Stability enterprises the boundedness over time of the network outputs and the response of the network output to minute changes to the weights or network inputs. Controllability is concerned with whether it is possible to control the dynamic behaviour patterns. An RNN is said to be controllable if an original state is steerable to a desired state within a finite number of sequential time steps. Observability is concerned with whether it is possible to observe the results of the control that is applied. A recurrent network is observable if the state of the network can be dogged from a fixed set of i/p and o/p measurements. For predicting the future taxi demand, a dataset which consists of date and time, number of pickups, number of passengers, maximum temperature, minimum temperature, humidity and ,wind speed is used. RNN is called recurrent because it performs the same computation for every input element and each output is conditioned on previous input element.
Fig. 4.3 Recurrent Neural Network
© 2019, IRJET | Impact Factor value: 7.211 | ISO 9001:2008 Certified Journal | Page 6967 Fig. 4.4 Repeating Modules in standard RNN
Fig. 4.5 Repeating Modules in LSTM
LSTMs also have this chain like structure, but the repeating module has a different structure. Instead of having a single neural network layer, there are four, interacting in a very special way.
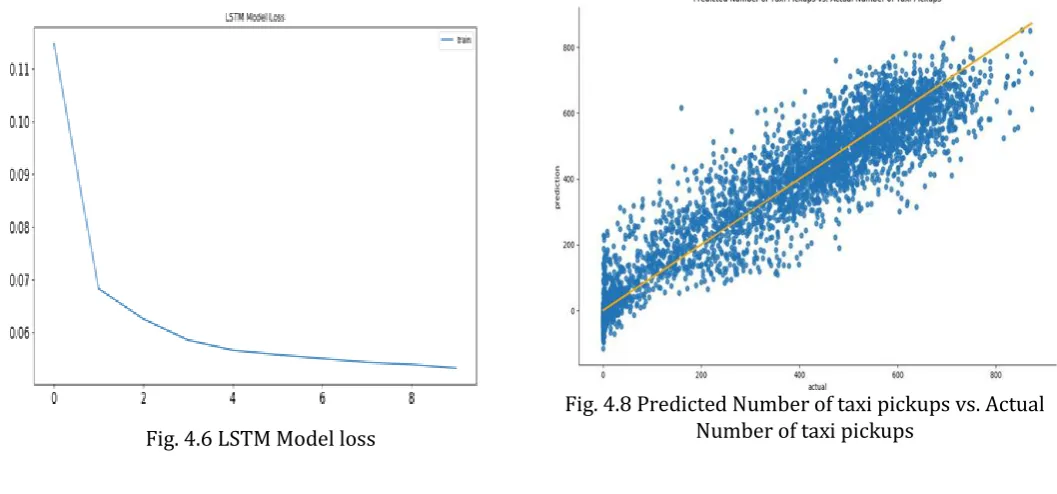
Fig. 4.6 LSTM Model loss
The figure 4.6 shows the model shows the Long Short-Term Memory (LSTM) model loss graph, whose accuracy can be increased in each iteration. In the neural network, when each data passes from the input layer to the output layer, through the hidden layer the accuracy of the model increases and each time the data passes the accuracy increases.
Figure 4.7 shows the number of days with greater than 800 pickups, which indicate peak hours. Peak hours indicate the time in which the demand for the taxi is high.
[image:7.595.37.291.298.422.2]Fig. 4.7 Predicted Number of taxi pickups vs. Actual Number of taxi pickups
[image:7.595.31.560.518.765.2]International Research Journal of Engineering and Technology (IRJET)
e-ISSN: 2395-0056Volume: 06 Issue: 03 | Mar 2019 www.irjet.net p-ISSN: 2395-0072
© 2019, IRJET | Impact Factor value: 7.211 | ISO 9001:2008 Certified Journal | Page 6968 Figure 4.8 shows the graph plotted between predicted
number of taxi pickups and actual number of taxi pickups from the historical data.
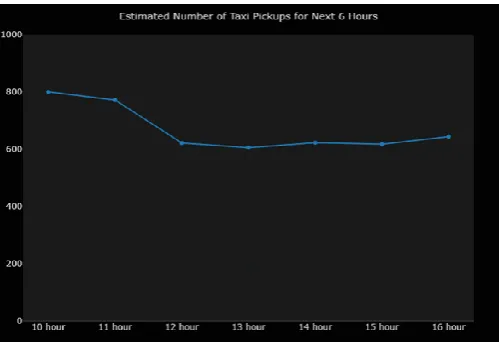
Fig 4.9 Estimated Number of Taxi Pickups
Fig 4.9 shows the estimated number of taxi pickups for the next six hours.
5. CONCLUSION
The proposed system is a sequential learning model with recurrent neural network for predicting the taxi demand in different areas in the city. Learning from the past historical data, the demand prediction is done for the location. Three Years data of the Airport is used to train our model. This model gives the prediction of taxi demand for hourly basis and a particular time.
This work can be extended in the future by adding more input such as holidays, festivals etc. Taxis can be organized and send based on the prediction of the model. In addition, it can save so much gas that is currently being spent by taxis to find passengers.
REFERENCES
[1] Jun Xu , Rouhollah Rahmatizadeh, Ladislau Bölöni,
and Damla Turgut, “Real-Time Prediction of Taxi Demand Using Recurrent Neural Networks”, IEEE Transaction on Intelligent transport system, vol. 19, no. 8, pp. 2572-2581,Aug.2018.
[2] Fei Miao, Shuo Han, Shan Lin, Qian Wang, John A.
Stankovic, Abdeltawab Hendawi, Desheng Zhang, Tain he and George J. Pappas, "Data-Driven Robust Taxi Dispatch Under Demand Uncertainties", IEEE Transactions on Control Systems Technology, vol. 27,
no. 1, pp. 175 - 191, Jan.2019.
[3] Mohammad Saiedur Rahaman, Yongli Ren, Margaret
Hamilton and Flora D. Salim, "Wait Time Prediction for Airport Taxis Using Weighted Nearest Neighbor Regression", IEEE Access, vol. 6, pp. 74660 - 74672, Nov.2018.
[4] Desheng Zhang, Tian He, Shan Lin, Sirajum Munir and
John A. Stankovic, "Taxi-Passenger-Demand Modeling Based on Big Data from a Roving Sensor Network", IEEE Transactions on Big Data, vol. 3, no. 3, pp. 362 - 374, Sept.2017.
[5] Luis Moreira-Matias, João Gama, Michel Ferreira, João
Mendes-Moreira, and Luis Damas, "Predicting Taxi– Passenger Demand Using Streaming Data", IEEE Transactions on Intelligent Transportation Systems, vol. 14, no. 3, pp. 1393 - 1402, sept.2013.
[6] Biao Leng, Heng Du, Jianyuan Wang, Li Li and Zhang
Xiong, "Analysis of Taxi Drivers’ Behaviors Within a Battle Between Two Taxi Apps", IEEE Transactions on Intelligent Transportation Systems, vol. 17, no. 1, pp. 296 - 300, jan.2016.
[7] Nicholas Jing Yuan, Yu Zheng, Liuhang Zhang and Xing
Xie, "T-Finder: A Recommender System for Finding Passengers and Vacant Taxis", IEEE Transactions on Knowledge and Data Engineering, vol. 25, no. 10, pp. 2390 - 2403, Oct.2013.
[8] Fei Miao, Student Member, Shuo Han, Member, Shan
Lin, John A. Stankovic, Desheng Zhang, Sirajum Munir, Hua Huang, Tian He, and George J. Pappas, "Taxi Dispatch With Real-Time Sensing Data in Metropolitan Areas: A Receding Horizon Control Approach", IEEE Transactions on Automation Science and Engineering, vol. 13, no. 2, pp. 463 - 478, Mar.2016.
[9] P. Santi, G. Resta, M. Szell, S. Sobolevsky, S. H. Strogatz,
and C. Ratti, “Quantifying the benefits of vehicle
pooling with shareability networks,” Proc. Nat. Acad.
[image:8.595.37.287.149.320.2]