Minimizing the Cost of Iterative
Compilation with Active Learning
William F. Ogilvie
University of Edinburgh, UKPavlos Petoumenos
University of Edinburgh, UKZheng Wang
Lancaster University, UKHugh Leather
University of Edinburgh, UKAbstract
Since performance is not portable between platforms, en-gineers must fine-tune heuristics for each processor in turn. This is such a laborious task that high-profile compilers, sup-porting many architectures, cannot keep up with hardware innovation and are actually out-of-date. Iterative compilation driven by machine learning has been shown to be efficient at generating portable optimization models automatically. However, good quality models require costly, repetitive, and extensive training which greatly hinders the wide adoption of this powerful technique.
In this work, we show that much of this cost is spent collecting training data, runtime measurements for differ-ent optimization decisions, which contribute little to the fi-nal heuristic. Current implementations evaluate randomly chosen, often redundant, training examples a pre-configured, almost always excessive, number of times – a large source of wasted effort. Our approach optimizes not only the selec-tion of training examples but also the number of samples per example, independently. To evaluate, we construct 11 high-quality models which use a combination of optimization settings to predict the runtime of benchmarks from the SPAPT suite. Our novel, broadly applicable, methodology is able to reduce the training overhead by up to 26x compared to an approach with a fixed number of sample runs, transforming what is potentially months of work into days.
Categories and Subject Descriptors D.3.4 [Programming Languages]: Processors—compilers, optimization
Keywords Active Learning; Compilers; Iterative Compila-tion; Machine Learning; Sequential Analysis;
1.
Introduction
With Dennard scaling long dead and technology scaling stop-ping within the next five years [1], performance improve-ments rely increasingly on software improveimprove-ments, especially
compiler and runtime optimizations. Accurate heuristics for deciding the best way to optimize a program are hard to con-struct. The space of possible decisions is vast, while their effect on performance is complex and depends on both the application and the targeted hardware. Manually develop-ing such heuristics takes months or years, even for a sdevelop-ingle target, meaning that tuning the compiler and runtime heur-istics for each new released processor is unrealistic. Even high-quality production compilers are out-of-date [31] and cannot extract the full performance potential of the hardware. The industry-wide trend towards heterogeneity only serves to make the optimization decision space even more complex, making effective heuristics near impossible to construct [44]. To overcome this problem, iterative compilation [30] was proposed as a means by which heuristics can be automatically produced, without the need for expert involvement. Different optimization strategies are applied and the effect on speed, size, or energy is measured. Augmented with machine learn-ing [2], these data are used to train a predictor which selects the best optimizations for a particular code and platform. This approach not only produces heuristics much faster, but it also outperforms heuristics crafted by human experts [31, 57]. The same methodology can be applied to radically differ-ent problem domains: compilation [33, 55, 56], parallelism mapping [22], runtime tuning [15], and hardware-software co-design [60].
space where as much information as possible can be gained and directs the search towards them.
These works represent a substantial leap forward towards making iterative compilation quick and easy. However, size-able inefficiencies still exist. Previous work on iterative compilation used a fixed sampling plan: each unique train-ing instance is repeatedly profiled a set number of times, chosena priori. Repeated measurements are necessary be-cause runtime measurements are inherently noisy.
There are many sources of noise encountered for runtime measurements. The most egregious of which is caused by other user or system processes. Such processes compete for resources with our application, especially cores, caches [41], and memory [59], and they do so in non-deterministic ways. In recent systems, the power and thermal walls lead to more complex interference patterns. Intel’s Turbo Boost, for example, might lower the frequency and the power consumption of a process running on a core, when other cores wake up [9].
Even ignoring interference from other applications, there are still more sources of noise. Memory management mech-anisms, such as dynamic memory allocators [26] and garbage collectors [48], can introduce additional unpredictable over-heads. On top of this, address space layout randomization and the physical page allocation mechanism change the logical and physical memory layout of the application every time it is executed, potentially affecting the number of conflict misses in the CPU caches and branch mispredictions [17, 38]. Multi-threaded applications can even force non-deterministic beha-vior on themselves, if the scheduler is not set to be perfectly repeatable, or if small timing changes alter the communica-tion patterns [45]. Any I/O can have non-repeatable timings, and even changes to the environment variables between runs can shift memory and alter runtimes [38].
Past research has investigated ways to reduce experimental noise. Typical approaches include overriding the default scheduling policy [43, 45], using more deterministic memory management mechanisms [26, 43, 45], avoiding I/O, or just minimizing the number of active processes, including services and daemons. Doing so is not always enough or desirable because of the following reasons. First, while they do reduce noise, they do not eliminate it. Multiple profiling runs are still needed to determine whether noise affects the measurement significantly. Even then the amount of variation might be too high for optimization heuristics dependent on accurate measurements [32]. Secondly, modifications to reduce noise may do so at the expense of altering the runtime behaviour that is meant to be measured or of risking the wrong heuristic being learned. Heuristics targeting very specific, low-noise runtime environments may not match well when used in practice. For example, [16] showed that the runtime variation caused by memory layout changes, such as address space randomization, can dwarf the differences between optimizations. If address space randomization is
disabled during training or only a single run is taken, then an optimization could be selected which is not optimal on average in deployment. Instead, multiple runs must be used to smooth out the effects of random layout changes. Finally, even when a low-noise environment would not actually alter the heuristic, we have found it difficult to convince companies that tuning heuristics to an environment different than their production one is acceptable. In short, what is needed are techniques which perform well in realistic, noisy environments.
Our work aims exactly at handling noise without having to reduce it and without wasting time on large numbers of re-peated performance measurements. Our insight was that each additional observation, that is, each additional performance measurement for the same optimization strategy, provides diminishing amounts of information. Indeed, that extra in-formation quickly reaches zero if there is little experimental noise or if the observation fits well with what we already know about the decision space. In other words, extra profiling runs for a decision are useful only if they are likely to con-tradict what we predict about that decision. Our experiments confirm that iterative compilation can be slowed down by using a fixed sampling plan, spending most of its time getting observations which provide no additional information.
In this paper, we introduce a novel active learning tech-nique for iterative compilation which combines sequential analysis, an approach where the number of samples are not fixed. By profiling the application under the same optimiz-ation decision only as long as this improves our knowledge of the decision space, we produce models quickly without sacrificing the heuristic’s quality. Specifically, our technique begins by taking a single sample runtime for optimizations that are deemed to be most profitable to learn from, as defined by an active learner. As knowledge is built up, the algorithm is able to revisit these examples instead of getting new ones. This happens if it determines that they are of continued in-terest, that is if it appears that measurement noise has affected the data we previously collected on that configuration.
To evaluate our approach we create predictors for 11 programs from the SPAPT suite [3]. These models can predict, with low error, the runtime of a particular code given a number of optimization options that we may want to apply, and in this way can find an optimal combination. Our results show that we can create a high-quality heuristic on average 4x, and up to 26x, faster than a baseline approach which uses 35 samples per run.
2.
Motivation
0 10 20 30
0 10 20 30
Loop i1 Unroll Factor
Loop i2 Unroll F
actor
1 2 3 4 MAE (ms) mm compiled with −O2
1 sample per point
(a) mean absolute error for sample size of one 0 10 20 30
0 10 20 30
Loop i1 Unroll Factor
Loop i2 Unroll F
actor
1 2 3 4 MAE (ms) mm compiled with −O2
optimum samples per point
(b) mean absoulute error for optimal sample size 0 10 20 30
0 10 20 30
Loop i1 Unroll Factor
Loop i2 Unroll F
actor
0 10 20 30 # Samples
mm compiled with −O2 optimum samples per point
[image:3.612.61.545.88.238.2](c) optimal number of samples across the space
Figure 1. Error and sample size for each point in the decision space when using a sample size of one or the optimal sample size.
The decision is the unroll factor for two loops of themmkernel of SPAPT. For most but not all points, a single sample is enough.
active, iterative learning this need not be the case and we can leverage the knowledge built up by the algorithm over time to adaptively select a more appropriate sample size per example, significantly speeding-up training overall.
To motivate our work, we examined the way iterative compilation works on the problem of tuning the unroll factor for two loops,i1andi2, of the matrix multiplication kernel in the SPAPT suite on the system we describe in Section 4. Using the-O2optimization level as a baseline, we compiled the kernel multiple times, each one with a different combination of unroll factors for the two loops. Each binary was then executed 35 times and its runtime measurements recorded.
In Figure 1a, we present the Mean Absolute Error (MAE) we would have incurred had we only taken a single observa-tion. This gives us an estimated baseline for the worst error we could pay in this space, as high as 4ms (5% of the mean) for some binaries but practically zero for many. For the latter getting even a second sample is a waste of effort. To estim-ate the potential speed-up we could obtain if we knew how many samples we should actually take for each optimization setting we iterate through the space again, but at each point we remove samples randomly from the group of 35 samples we collected initially. We continue reducing the number of samples as long as our calculated MAE is below 0.1ms.
Figures 1b and 1c show the error of this adaptive ap-proach across the space and the number of samples needed per configuration to maintain such a small error, respectively. These figures demonstrate that there is quite considerable stochastic noise in measurements across the space and, there-fore, that the number of samples needed for a low MAE varies. If we take the naïve, fixed sampling plan of 35, we need35×30×30 = 31,500individual executions, whereas
with ‘perfect knowledge’ we can incur an error of only 0.1ms at the cost of15,131program runs –nearly half.
● ●
● ●
● ●
● ● ●
● ● ● ●
0 5 10 15 20 25 30
1.5
2.0
2.5
3.0
adi compiled with −O2
Loop i1 Unroll Factor
Runtime (s)
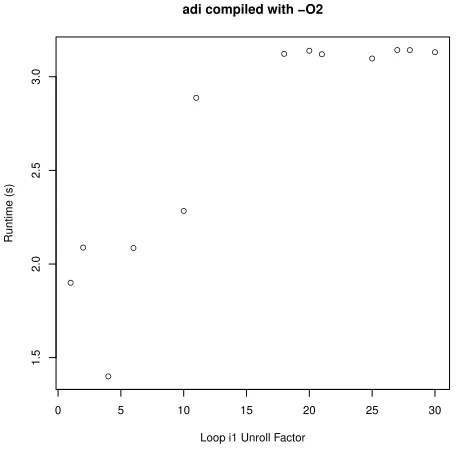
Figure 2. Runtime versus unroll factor for a loop of adi,
when using a sample size of one. A relationship between unroll factor and runtime is relatively clear despite the noise – i.e. stable around 2.1s until 10 where it climbs steadily and plateaus at 3.1s for high levels of loop unrolling.
[image:3.612.317.548.312.542.2]number of samples, but we can approximate it by looking at what the rest of the space tells us.
Consider Figure 2, where we unroll thei1loop in the adibenchmark a random number of times and take a single sample each time. Despite the noise, we see that there is a pattern easily identifiable to the human eye: a plateau starting at 2.1s then climbs and levels off at 3.1s, around a loop unroll factor of 10. We postulate, and it can be shown that, points in areas where the pattern is clear and which fit well in that pattern are likely to be already close to their respective population means. The points where we need more samples are the rest.
Our active learning approach for iterative compilation already uses Machine Learning to discover patterns in the decision space during the training process. We can use that same knowledge to determine whether a set of runtime measurements for a point in the space fits the local pattern or not, that is whether it is likely to be affected by noise or not given what is known about its neighbours.
3.
Active Learning with Sequential Analysis
Previous research [18, 31] has shown that machine learning can be used to generate compiler heuristics more accurately than human experts. However, current implementations use randomly collected examples for training and this is problem-atic since randomness often leads to redundancy. In contexts where obtaining data is cheap this is perfectly acceptable; but for us, since each example requires compilation and multiple runs to record average performance, a lot of effort can be wasted.
Active learning [39] is specifically aimed at reducing the occurrence of these unprofitable evaluations. Instead of blindly selecting training examples, in our case binaries com-piled with certain optimizations, it generates an intermedi-ate model based on the examples already evaluintermedi-ated. The algorithm considers a number of potential candidates (optim-ization settings) that it could learn from next and assigns each a score. This score represents the predicted extra information that the example will provide. It is usually a function of the uncertainty the model has with regards to the predicted value – runtime. The example with the highest score is ‘labelled’ – compiled and profiled – and the information used to up-date the intermediate model. This loop continues until some completion criterion has been reached.
Our work in this paper introduces a novel approach to active learning which is broadly applicable. The only as-sumptions we make are that neighbouring examples in the optimization design space do not significantly differ in res-ult from one another the majority of the time, and that the signal-to-noise ratio of measurements are such that an ap-proximately accurate model can be fit to the data, where this is in essence no different than techniques which attempt to avoid over-fitting. While traditional active learning is used to reduce only the number of training examples,we wish
to reduce the number of samples needed per example. To the best of our knowledge, we are the first to propose com-bining active learning and sequential analysis in this way. Previous research in this area has ignored sequential analysis. The reason for this is that many implementations of active learning are greedy [6, 47], so learning noisy data on pur-pose will lead to incorrect conclusions being drawn from the intermediate models. In particular, this will steer the search towards the wrong areas of the decision space, significantly reducing further the quality of the final model. In Section 3.3 we explain how we overcome this problem.
3.1 Sequential Analysis
Traditionally in active learning the training set (the set of examples already seen) and the candidate set, a random subset of all examples that could be learnt from next, are kept disjoint. This makes sense because the information contained in the training set is assumed to be of good quality; each example will have been evaluated some fixed number of times to ameliorate the effect of noise, hence, there is little to be gained from revisiting those examples. However, as we have demonstrated, a fixed sample count is often overly conservative and wasteful, slowing down the training process substantially.
In order to modify active learning to incorporate sequential analysis we change the algorithm such that the initial sample size is set to one. In case of noisy data, we need to be able to revisit previously compiled programs so we keep them in the candidate set – see Figure 3. That is to say, at each iteration of the learning loop the algorithm will consider not only getting a new example but also whether it is more profitable to try an old one again, similar to the multi-armed bandit problem [29]. We are able to do this because the particular model we use provides a scoring function which quantifies the uncertainty the model has about a particular point in the space, given what it knows. As knowledge is gained, given the shape of the intermediate model, noisy examples or examples in complex areas of the decision space will begin to ‘stick out’, and will be more likely to be visited. In both cases, with each iteration of the training loop, we select the example where the highest amount of information can be extracted.
We outline our algorithm in more detail in Alg. 1. The algorithm begins by constructing a model M with ninit
training examples which have been randomly chosen from all potential examplesF as a seed. To generate this initial
model we obtain some fixed number of observationsnobs
for each training example to give the active learner a quick and accurate look at the search space. The learning loop then proceeds whilst the completion criterion has not been satisfied. In Alg. 1 this criterion is set to a fixed number of training instances but could have been based on, for example, wall-clock time or some estimate of error in the final model established through cross-validation [25]. At each iteration of the loop the candidate setCcombinesncrandom points
Learning
Algorithms New
Observation
Initial Training
Points
Active Learner
Intermediate
Model CandidatesEvaluate ModelFinal
Random Unseen
[image:5.612.137.492.75.164.2]Previously Seen
Figure 3. An overview of our active learning approach. To seed an initial model, we give the learner some good quality data.
We then choose a single training example from a set of candidate examples. We collect data for the chosen example and feed that back into the algorithm. The process repeats until we reach some completion criterion. Contrary to existing active learning approaches, we collect our (potentially noisy) training data one observation at a time. Visited training examples remain in the candidate set and can be revisited if getting more observations for them is more profitable than trying a new training example.
which have been seen previously but less thannobstimes. We
choose the next training examplexbased upon its predicted
usefulness (see Section 3.3) and we measure its runtimeyone
more time. We then update the model as well as the required data structures. It should be noted that this algorithm is easily parallelized by selecting multiple training examples per loop iteration instead of just one [4].
Tt
Tt+1
Stay
Prune
Grow
Xt+1
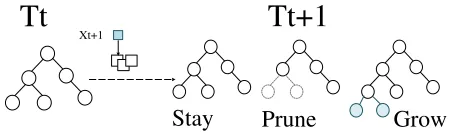
Figure 4. This diagram shows the three potential updates
that are stochastically applied to the Dynamic Tree upon receiving a new training example xt+1. The tree either
remains unchanged, a leaf node is pruned back so that the parent of the leaf becomes a leaf itself, or grown such that two new children divide the relevant subspace.
3.2 Dynamic Trees
In regression problems where we wish to estimate the uncer-tainty of a prediction the collective wisdom would be to use a Gaussian Process (GP) [46]. However, GP inference is slow withO(n3)efficiency fornexamples. This is problematic,
particularly in active learning, since each time something new is learned a model needs to be constructed and evaluated. A more efficient model which we leverage in this work is the relatively new dynamic tree, which is based on the clas-sical decision tree model [8] with modifications to include Bayesian inference [10, 11]. The advantages of the dynamic tree for our purposes are
•its ability to evolve over time as new data come in, without
reconstructing the model from the ground up with each iteration;
•its estimation of uncertainty at any given point in the
space, like a GP but without the overhead;
•its avoidance of over-fitting to the training data, which is
vital since we are learning potentially noisy information. Full details on the model can be obtained from the article by Taddyet al.[51]. The brief overview of how it works is as follows. The static model used within the dynamic tree framework is a traditional decision tree for regression applic-ations. A set of rules recursively partitions the search space into a set of hyper-rectangles such that training examples with the same or similar output value are contained within the same leaf node. The dynamic tree changes over time, when new information is introduced, by a stochastic process thereby avoiding the need to prune at the end. At timet, a tree Ttis derived from the training data(x, y)t. When new data
(xt+1, yt+1)arrives, an updated treeTt+1is created, identical
toTtexcept that some mechanism has been randomly chosen
from three possibilities – see Figure 4. The leaf nodeη(xt+1)
containingxt+1either (1) remains completely unchanged; (2)
is pruned, so that the parent ofη(xt+1)becomes a leaf node;
(3) is grown, such thatη(xt+1)becomes an internal node to
two new children. The choice of transformation is influenced byyt+1in a posterior distribution. This posterior distribution
depends upon the probability ofyt+1 given xt+1, Tt,and
[x, y]t; hence, the dynamic tree is more resilient to noisy data
than other techniques.
3.3 Quantifying Usefulness
The most crucial part of the active learning loop is estimating which training example from within the pool of potential candidatesCwould be most profitable to learn from next. The
[image:5.612.58.288.335.402.2]Algorithm 1 An active learning algorithm modified to
re-duce the number of samples, whereF contains all training
examples that could be chosen,ninit andnmaxspecify the
initial and total number of training examples to record,ncthe
number of candidates per iteration, andnobsthe number of
samples thought to be needed to reduce the affects of noise in the output/performance values.
1: procedureACTIVELEARN(F, ninit, nmax, nc, nobs)
2: X←sample(F, ninit)
3: Y ←getObservations(X, nobs)
4: M←dynaTree(X, Y)
5: D← ∅
6: fori=ninit, nmaxdo
7: C←sample(F−X, nc)
8: for allk∈keys(D)do
9: ifD[k]< nobsthenC←C∪k
10: end if
11: end for
12: x← ∅
13: vmin←MAX_DOUBLE
14: for allc∈Cdo
15: v←predictAvgModelVariance(M, c)
16: ifv < vminthen
17: vmin←v
18: x←c
19: end if
20: end for
21: y←getObservations(x,1)
22: M←updateModel(M, x, y)
23: X←X∪x
24: ifk∈keys(D)then
25: D[k]←D[k] + 1
26: else
27: D[k]←1
28: end if
29: end for
30: returnM
31: end procedure
the greedy search problem discussed previously, although the latter is more computationally intensive than the former –
O(|C|2)versusO(|C|). Despite this, we use the latter as our
scoring function, since it handles heteroskedasticity, non-uniform variance across the space which we assume for increased robustness, more effectively.
4.
Experimental Setup
4.1 Optimization Problem
We evaluate our approach by examining how efficiently we can construct models to solve a classical but complex compilation problem. In particular, the problem we consider in this work involves finding the optimal set of compilation parameters for a program. The set of parameters includes loop unrolling, cache tiling, and register tiling factors, where each parameter has a range of possible values unique to each loop.
The combination of these parameters results in a massive search space where we will need to find a configuration that leads to a short program runtime. Our goal is to build a program-specific model that can predict the runtime from the given set of optimizations. This allows us to quickly search over a large number of configurations to find out the best performing one without compiling and profiling the program with every single option.
4.2 Platform and Benchmarks
Platform We evaluated our method on a server running OpenSuse v12.3 with an Intel Core i7-4770K 4-core CPU at 3.4GHz. The machine contains 16GB of RAM and the compiler used was gcc v4.7.2.
Environment We measured time using the C library func-tionclock_gettime(). As in previous iterative compilation literature, our machine was restricted to a single user and did not have any processes running other than those enabled by default under a standard OS installation. We took no further steps to reduce experimental noise, such as pinning threads or using a non-standard memory allocator; we decided against this to avoid creating an artificial environment which could alter our findings, as discussed previously in Section 1.
Benchmarks We used 11 applications taken from the SPAPT suite [3], a collection of search problems (programs) for automatic performance tuning. These benchmarks are based on high-performance computing problems such as stencil codes and dense linear algebra. These particular 11 were chosen based on an initial prototyping of our algorithm using data kindly provided by the authors of [4], where only these 11 were contained within that initial dataset. These programs are sequential implementations, where dynamic memory is allocated it is through the standardmalloc() library function; again, we decided against using a low noise allocator for reasons previously discussed.
Each problem of the SPAPT suite is defined by three primary variables – kernel, input size, and tunable config-uration. The tunable parameters are further broken down into a number of integer and binary values, with the values giv-ing optimizgiv-ing code transformations to apply, as specified above. In our experiments binary flags and input size were not considered so that a fair comparison could be made with the related work [4]. The precise size of each search space is given in Table 1.
4.3 Evaluation Methodology
be performed, for example by calculating the ratio of the Confidence Interval (CI) to the mean and rejecting if that breaches some threshold. Typically, this validation is not presented in papers, if it is done at all. When it is done, standard values are to use the 95% confidence and a 1% CI/mean threshold. In this paper, we compare against a constant sampling plan of 35 observations, as that is what is used in our comparison work [4]. We note that even 35 observations is not always enough. Across our benchmarks we found that even though on the majority of examples there was often very little noise, many did not fall into this pattern. Fully 5% of examples broke the threshold. Even at a more generous 5% threshold, we found that with 35 observations, 0.5% failed. With fewer observations the problem is worse. At 5 observations, 3.3% fail that more generous threshold, and at 2 observations (the minimum to have any statistical certainty), 5% fail. This finding is corroborated by [32] which samples until the threshold is met, and discovers that for timing small code sequences it is sometimes necessary to take hundreds of observations. Since active learning is susceptible to bad data, these erroneous training examples can have a detrimental affect on the quality of the learned heuristic and its convergence.
Our technique, by avoiding a constant sampling plan, is able to achieve far better results. Indeed, it is even able to perform adequately with only one observation per example in low noise parts of the space, and will spend effort with multiple observations only on those parts of the space that require it.
Based on classical methodologies, we consider two tech-niques to be in competition with our own. For both, we get a fixed number of observations for each training example and the candidate set is kept disjoint from past training examples. The first technique uses the average of the runtimes recorded over 35 observations per single training example, as in [4]. The second technique records a single execution per example. In this way we can compare how our approach fairs in rela-tion to both very low and relatively high accuracy per training point, in terms of estimating mean runtime.
In order to provide the best evaluation possible we com-pare our methodology to the active learning approach by Balaprakashet al.[4]; in particular, we use the same bench-mark suite, model, parameters, and accuracy metric they do.
Evaluation Metrics Our evaluation examines the efficiency of model construction and, more specifically, the evolution of themodel errorovertraining timefor each one of the 11 benchmarks and the three different active learning approaches. We quantify the accuracy of the models produced by each approach using the Root Mean Squared Error of the predicted runtimes (1). For each data point in a test set ofninstances
the runtime predicted by the current modelyˆtis compared to
the observed mean runtimeytas follows:
RM SE=
√
∑n
i=1(ˆyi−yi)
2
n (1)
We measure the training time in each experiment as the cumulative compilation and runtimes of any executables used in training. The overhead of updating the Dynamic Trees is not measured as it is a small part of the overall training overhead and is near constant for all evaluated approaches.
4.4 Algorithm and Model Parameters
For each kernel the goal is to produce a model capable of estimating mean serial code runtime for any set of optimiza-tion settings. To this end, we used the following parameters in constructing our model and overall learning algorithm.
With respect to Alg. 1, we start by seeding the algorithm with just 5 random examples ninit. For each of these we
record 35 observationsnobs to calculate a mean runtime.
For the Dynamic Tree model we employ the RdynaTree package. We use an entirely default configuration except the number of particlesN is set to 5,000. In each iteration of
the loop we consider500random and new candidate training
instancesnc.
The completion criterion for the experiments was set such that the maximum size of the training setnmax does not
exceed 2,500. All experiments were repeated ten times with new random seeds. The results reported in Section 5 are all averaged over ten experimental runs.
4.5 Description of the Datasets
To collect the data for our experiments we profile each pro-gram with 10,000 distinct, randomly selected configurations. For each one, we record its mean runtime, determined by averaging 35 separate executions per example, and its com-pilation time. Per experiment, we randomly mark 7,500 of them as available for use in training, while we test the model on the remaining 2,500 examples.
The feature values of each data point, which is to say the values which make each example distinct from one another, were all normalized through scaling and centring to transform them into something similar to the Standard Normal Distribution: a common practice in machine learning work, where features are not all on comparative scales.
5.
Experimental Results
In this Section we first show that our approach can greatly speed-up the learning process by reducing the cost of profiling by up to 26x, as compared to a baseline approach that uses 35 observations for each data point. We then provide a detailed analysis of our results for each program in turn.
5.1 Overall Analysis
Table 1. Lowest common RMS error achieved by both approaches, profiling time needed to reach this error level, and speed-up
for all 11 benchmarks
benchmark search space lowest common RMSE cost of the baseline cost of our approach speed-up
(sec) (sec)
adi 3.78×10¹⁴ 0.087 2.62×10⁴ 9.08×10⁴ 0.29
atax 2.57×1012 0.097 3.33×10³ 2.39×10² 13.93
bicgkernel 5.83×10⁸ 0.065 1.35×10⁴ 3.76×10³ 3.59
correlation 3.78×10¹⁴ 0.589 57.46 8.13 7.07
dgemv3 1.33×1027 0.067 1.75×10² 7.44 23.52
gemver 1.14×10¹⁶ 0.342 2.99×10³ 1.15×10² 26.00
hessian 1.95×10⁷ 0.006 5.76×10³ 1.56×10³ 3.69
jacobi 1.95×10⁷ 0.076 3.04×10³ 8.57×10² 3.55
lu 5.83×10⁸ 0.013 2.57×10³ 7.09×10² 3.62
mm 3.18×10⁹ 0.042 9.87×10⁴ 8.89×10⁴ 1.11
mvt 1.95×10⁷ 0.002 2.59×10³ 2.20×10³ 1.18
[image:8.612.64.556.283.414.2]geometric mean 3.97
Table 2. This table gives an indication of the spread of the variance and 95% confidence interval relative to the mean for all
benchmarks tested; the latter is given for two sample sizes, 5 and 35 observations. The values shown illustrate that although noise can be low for many benchmarks, it is high for others.
benchmark variance 35-sample 95% C.I. / mean 5-sample 95% C.I. / mean
min mean max min mean max min mean max
adi 8.44×10⁻¹⁰ 2.34×10⁻³ 0.14 4.10×10⁻⁶ 2.25×10⁻³ 0.05 2.77×10⁻⁶ 0.01 0.16
atax 7.54×10−10 9.72×10⁻⁵ 0.03 2.22×10⁻⁵ 2.31×10⁻³ 0.06 1.79×10⁻⁵ 0.01 0.25
bicgkernel 2.06×10⁻¹⁰ 1.06×10⁻⁴ 0.05 1.17×10⁻⁵ 1.52×10⁻³ 0.07 1.02×10⁻⁵ 4.64×10⁻³ 0.29
correlation 2.27×10⁻¹⁰ 0.42 8.02 2.13×10⁻⁵ 0.03 0.34 4.42×10⁻⁶ 0.13 2.41
dgemv3 1.15×10⁻⁹ 5.60×10⁻⁵ 0.03 3.31×10⁻⁵ 2.25×10⁻³ 0.08 2.24×10⁻⁵ 0.01 0.28
gemver 1.19×10⁻⁹ 5.91×10⁻³ 0.47 1.18×10⁻⁵ 4.81×10⁻³ 0.10 9.34×10⁻⁶ 0.02 0.42
hessian 2.35×10⁻¹¹ 1.03×10⁻⁶ 1.99×10⁻⁴ 3.89×10⁻⁵ 1.33×10⁻³ 0.06 1.63×10⁻⁵ 4.15×10⁻³ 0.24
jacobi 2.54×10⁻¹⁰ 1.20×10⁻⁴ 0.09 1.32×10⁻⁵ 1.29×10⁻³ 0.09 4.12×10⁻⁶ 3.83×10⁻³ 0.39
lu 1.84×10⁻¹¹ 8.45×10⁻⁷ 1.09×10⁻⁴ 2.03×10⁻⁵ 6.89×10⁻⁴ 0.02 5.76×10⁻⁶ 2.10×10⁻³ 0.11
mm 2.76×10⁻¹⁰ 4.87×10⁻⁶ 1.31×10⁻³ 2.26×10⁻⁵ 7.44×10⁻⁴ 0.02 1.36×10⁻⁵ 2.37×10⁻³ 0.09
mvt 9.97×10⁻¹² 1.07×10⁻⁸ 7.87×10⁻⁶ 6.29×10⁻⁵ 8.28×10⁻⁴ 0.03 3.98×10⁻⁵ 2.44×10⁻³ 0.11
adi mm mvt
jaco
bi
bigc
kern
el lu
hess
ian
corre
latio
n
atax
dgemv
3
gemv
er
Geo
-me an 0
1 2 3 4 5 6 7 8 9 10 11 12 13 14
15 26x
Reducti
on of pr
o
fi
ling cost
[image:8.612.58.309.288.564.2]23.5x
Figure 5. Reduction of profiling overhead compared to a
baseline approach
measured the time needed for both techniques to first reach a common lowest average error.
In particular, Table 1 shows for each benchmark what this lowest common average error is and how many seconds it took to collect the profiling data needed to reach this level for the competing methods. Figure 5 presents graphically the acceleration achieved by our approach. In all but one benchmark our algorithm is faster at reaching the lowest average error. Specifically, our methodology is able to reduce
the overhead for 10 benchmarks by up to 26x. The only benchmark in which our approach fails to reduce the overhead isadi. However, the difference in errors between the two techniques is comparable, within a few thousandths of a second on average. Summarizing, our approach outperforms the baseline by achieving on average a 4x reduction of the profiling overhead, which translates to saving weeks of compute time in practice for many compilation problems.
5.2 Detailed Analysis
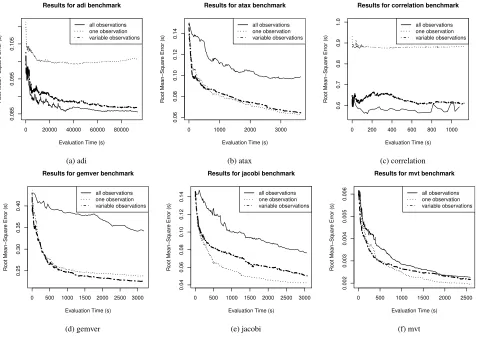
In this Section we present our findings in more detail. Fig-ures 6a–6f show the Root Mean Squared Error (1) against evaluation time (cumulative profiling and compilation cost in seconds) averaged over 10 runs for several representative results. To make a fair comparison each graph shows the range of time over which all three sampling plans are simul-taneously active in processing up to 2,500 training instances. What follows is a qualitative summary of those results.
adi: Figure 6a gives error against time for the three different
variable observation approach is also unable to keep up with a high fixed number of observations per example it does achieve comparably low error throughout.
atax, bicgkernel: The data of benchmark atax in Figure
6b is quite different to that in Figure 6a and appears to represent a case where the underlying noise in performance measurements is comparatively low. This is exemplified by the fact that one sample per unique instance is enough to do well, and indeed our technique appears to detect this; compare these plot-lines to the 35 observations approach and we see a good example of how much time can potentially be saved by our technique over this baseline. Thebicgkernel experiments follow the same sort of pattern.
correlation: Figure 6c, showing the results of the benchmark
correlation, is interesting since the error remains high regardless of sampling technique. Data from Table 2 points at a potential reason for this, that we outline below. As in Figure 6a, we see that there must be noise present since one observation does even worse. Our approach is not quite as good as using a large number of observations per data point but is competitive and within a few hundredths of a second in terms of average error by the end of the displayed time.
dgemv3, gemver, hessian: In Figure 6d our variable
ap-proach is much faster than the classical method and the simple but potentially noisy variant, similarly for the results ofdgemv3andhessian.
jacobi, lu, mm, mvt: The data for the jacobibenchmark
(Figure 6e), which is also generally representative oflu, are interesting since they show our algorithm to be slightly too cautious but still much more efficient than a fixed sampling plan. Themmbenchmark gives a graph akin to that ofmvt, showing our approach as giving slight speed-ups over the classical methodology.
Table 2 details the distributions of the runtimes measured during our experiments, and in particular the spread of the variance and confidence intervals relative to the means. The level of noise across this set of benchmarks varies across applications. Moreover, the variance is not constant across all parts of the space for even a single benchmark in isolation; some parts of the space suffer from extreme noise. An adaptive algorithm, such as ours, is necessary to make the best of these conditions.
Correlationshows very high noise and achieves a 7x learning speed-up whereasgemverhas lower noise but gave us the highest learning speed-up – 26x. We think this is because our experiments capped the number of executions at 35, but many points incorrelation’sspace need more data. This limits the maximum speed-up that can be attained. Gemver, in contrast tocorrelationhas fewer points for which 35 observations are inadequate. Foradi, where the speed-up runs counter to our expectations, we ran longer experiments but the outcome did not change. We believe that this is due to the shape of the noisy regions in the space. We will investigate these in future work.
6.
Related Work
Our work lies at the intersection of optimization modeling and active learning. No existing work has used sequential analysis and active learning to reduce the overhead of iterative compilation.
Analytic Modeling Analytic models have been widely used to tackle complex optimization problems, such as auto-parallelization [7, 40], runtime estimation [12, 27, 58], and task mappings [28]. A particular problem with them, however, is that the model has to be re-tuned for each new targeted hardware [50].
Predictive Modeling Predictive modeling has been shown to be useful in the optimization of both sequential and par-allel programs [14, 23, 52, 53]. Its great advantage is that it can adapt to changing platforms as it has noa priori as-sumptions about their behavior, but it is expensive to train. There are many studies showing it outperforms human based approaches [19, 24, 31, 54, 61]. Prior work for machine learn-ing in iterative compilation [20] often uses random sampllearn-ing or exhaustive search to collect training examples. The process of collecting these examples can be expensive, taking several months in practice. With active learning, our approach can significantly reduce the overhead of collecting these training data, accelerating the process of tuning optimization heurist-ics using machine learning.
Active Learning for Systems Optimization Active learn-ing has recently emerged as a viable means for constructlearn-ing heuristics for systems optimization. Zuluagaet al.[60] pro-posed an active learning algorithm to select parameters in a multi-objective problem; Balaprakashet al.[4, 5] used act-ive learning to find optimizations for both CPU and GPU scientific codes; and Ogilvieet al.[39] proposed its use to construct models to map programs in a CPU–GPU mixed platform. In all these works, however, each training example was profiled a fixed number of times in order to compute an average performance. Our work advances this prior work by dynamically adjusting the number of profiling runs as needed, which significantly reduces the training overhead.
0 20000 40000 60000 80000
0.085
0.095
0.105
Results for adi benchmark
Evaluation Time (s)
Root Mean−Square Error (s)
all observations one observation variable observations
(a) adi
0 1000 2000 3000
0.06
0.08
0.10
0.12
0.14
Results for atax benchmark
Evaluation Time (s)
Root Mean−Square Error (s)
all observations one observation variable observations
(b) atax
0 200 400 600 800 1000
0.6
0.7
0.8
0.9
1.0
Results for correlation benchmark
Evaluation Time (s)
Root Mean−Square Error (s)
all observations one observation variable observations
(c) correlation
0 500 1000 1500 2000 2500 3000
0.25
0.30
0.35
0.40
Results for gemver benchmark
Evaluation Time (s)
Root Mean−Square Error (s)
all observations one observation variable observations
(d) gemver
0 500 1000 1500 2000 2500 3000
0.04
0.06
0.08
0.10
0.12
0.14
Results for jacobi benchmark
Evaluation Time (s)
Root Mean−Square Error (s)
all observations one observation variable observations
(e) jacobi
0 500 1000 1500 2000 2500
0.002
0.003
0.004
0.005
0.006
Results for mvt benchmark
Evaluation Time (s)
Root Mean−Square Error (s)
all observations one observation variable observations
[image:10.612.59.540.90.427.2](f) mvt
Figure 6. RMS error over time for six of our benchmarks for three different approaches: one observation, 35 observations, and
variable observations per training point
7.
Conclusions and Future Work
While we need good software optimization heuristics to fully exploit the performance potential of our hardware, it is be-coming increasingly unrealistic to hand-tune them with expert knowledge for every hardware architecture they have to target. The result is that current compilers use out-of-date optimiza-tion strategies, ultimately leading to sub-optimal binaries. To alleviate this problem, previous research has proposed ma-chine learning to automate the heuristic generation process. Existing implementations are unnecessarily slow. They select their training data randomly, much of which carry little useful information despite being time consuming to acquire. Active learning approaches have tackled this inefficiency, but their inflexible sampling plan still causes them to collect training data with little useful information.
In this paper, we present a unique approach, broadly applic-able to heuristic generation. It combines sequential analysis, which reduces the observations per training example, together with active learning, which reduces training examples overall, to greatly accelerate learning. We demonstrate our approach
by comparing it with a baseline 35-sample technique which creates software optimization models derived through active learning alone. Our approach achieves an average speed-up of 4x, and up to 26x, without significant penalties to the final heuristic quality.
We intend to test the bounds of our technique by artificially introducing noise into the system to see how robustly it performs in extreme cases. Success would allow our strategies to be used in heavily loaded multi-user environments. This would have been interesting in this paper, and is something of an omission that was pointed out to us in a review. As such we leave it to future work.
Acknowledgments
References
[1] 2015 international technology roadmap for
semicon-ductors. http://www.semiconductors.org/main/
2015_international_technology_roadmap_for_ semiconductors_itrs/. Retrieved 08/09/16.
[2] F. Agakov, E. Bonilla, J. Cavazos, B. Franke, G. Fursin, M. F. P. O’Boyle, J. Thomson, M. Toussaint, and C. K. I. Williams. Using Machine Learning to Focus Iterative Optimization. In CGO, 2006.
[3] P. Balaprakash, S. M. Wild, and B. Norris. SPAPT: Search Problems in Automatic Performance Tuning. InICCS, 2012. [4] P. Balaprakash, R. B. Gramacy, and S. M. Wild.
Active-Learning-Based Surrogate Models for Empirical Performance Tuning. InCLUSTER, 2013.
[5] P. Balaprakash, K. Rupp, A. Mametjanov, R. B. Gramacy, P. D. Hovland, and S. M. Wild. Empirical Performance Modeling of GPU Kernels Using Active Learning. InParCo, 2013. [6] M.-F. Balcan, A. Beygelzimer, and J. Langford. Agnostic
Active Learning. InICML, 2006.
[7] U. Bondhugula, A. Hartono, J. Ramanujam, and P. Sadayappan. A Practical Automatic Polyhedral Parallelizer and Locality Optimizer. InPLDI, 2008.
[8] L. Breiman, J. H. Friedman, R. A. Olshen, and C. J. Stone.
Classification and regression trees. Wadsworth and Brooks,
1984.
[9] J. Charles, P. Jassi, N. S. Ananth, A. Sadat, and A. Fedorova. Evaluation of the Intel Core i7 Turbo Boost feature. InIISWC, 2009.
[10] H. A. Chipman, E. I. George, and R. E. McCulloch. Bayesian CART Model Search. Journal of the American Statistical
Association, 93, 1998.
[11] H. A. Chipman, E. I. George, and R. E. McCulloch. Bayesian Treed Models.Machine Learning, 48, 2002.
[12] M. Clement and M. Quinn. Analytical Performance Prediction on Multicomputers. InSC, 1993.
[13] D. A. Cohn. Neural Network Exploration Using Optimal Experiment Design.Neural Networks, 9(6), 1996.
[14] K. D. Cooper, P. J. Schielke, and D. Subramanian. Optimizing for Reduced Code Space using Genetic Algorithms. InLCTES, 1999.
[15] C. Cummins, P. Petoumenos, M. Steuwer, and H. Leather. Autotuning OpenCL Workgroup Size for Stencil Patterns.
arXiv preprint arXiv:1511.02490, 2015.
[16] C. Curtsinger and E. D. Berger. STABILIZER: Statistically Sound Performance Evaluation. InASPLOS, 2013.
[17] A. B. de Oliveira, J.-C. Petkovich, and S. Fischmeister. How much does memory layout impact performance? A wide study.
InREPRODUCE 2014, 2014.
[18] C. Dubach, T. Jones, E. Bonilla, G. Fursin, and M. F. P. O’Boyle. Portable Compiler Optimisation Across Embedded Programs and Microarchitectures using Machine Learning. In
MICRO, 2009.
[19] M. K. Emani et al. Smart, Adaptive Mapping of Parallelism in the Presence of External Workload. InCGO, 2013.
[20] G. Fursin et al. Milepost GCC: Machine Learning Enabled Self-tuning Compiler.International Journal of Parallel
Pro-gramming, 39(3), 2011.
[21] R. B. Gramacy and M. A. Taddy. dynaTree: Dynamic Trees
for Learning and Design.http://faculty.chicagobooth.
edu/robert.gramacy/dynaTree.html, 2011. R package.
Retrieved 02/29/16.
[22] D. Grewe, Z. Wang, and M. F. O’Boyle. Portable Mapping of Data Parallel Programs to OpenCL for Heterogeneous Systems. InCGO, 2013.
[23] D. Grewe, Z. Wang, and M. F. P. O’Boyle. OpenCL Task Partitioning in the Presence of GPU Contention. InLCPC, 2013.
[24] D. Grewe et al. A Workload-Aware Mapping Approach For Data-Parallel Programs. InHiPEAC, 2011.
[25] T. Hastie, R. Tibshirani, and J. Friendman. The Elements of
Statistical Learning: Data Mining, Inference, and Prediction,
chapter 7. Springer, 2 edition, 2009.
[26] J. Herter, P. Backes, F. Haupenthal, and J. Reineke. CAMA: A predictable cache-aware memory allocator. InEuromicro, 2011.
[27] S. Hong and H. Kim. An Analytical Model for a GPU Architecture with Memory-level and Thread–level Parallelism Awareness. InISCA, 2009.
[28] A. H. Hormati, Y. Choi, M. Kudlur, R. Rabbah, T. Mudge, and S. Mahlke. Flextream: Adaptive Compilation of Streaming Applications for Heterogeneous Architectures. InPACT, 2009. [29] M. N. Katehakis and J. Arthur F. Veinott. The multi-armed bandit problem: Decomposition and computation.Mathematics
of Operations Research, 12(2), 1987.
[30] P. M. W. Knijnenburg, T. Kisuki, and M. F. P. O’Boyle.
Iterative Compilation. 2002.
[31] S. Kulkarni and J. Cavazos. Mitigating the Compiler Optim-ization Phase-Ordering Problem using Machine Learning. In
OOPSLA, 2012.
[32] H. Leather, M. F. P. O’Boyle, and B. Worton. Raced profiles: efficient selection of competing compiler optimizations. In
LCTES, 2009.
[33] H. Leather, E. Bonilla, and M. O’Boyle. Automatic Feature Generation for Machine Learning–based Optimising Compila-tion.ACM TACO, 2014.
[34] D. J. C. MacKay. Information-Based Objective Functions for Active Data Selection.Neural Computation, 4, 1992. [35] A. Mazouz, S. A. A. Touati, and D. Barthou. Study of
Variations of Native Program Execution Times on Multi-Core Architectures. InCISIS, 2010.
[36] A. Monsifrot, F. Bodin, and R. Quiniou. A Machine Learning Approach to Automatic Production of Compiler Heuristics. In
AIMSA, 2002.
[38] T. Mytkowicz, A. Diwan, M. Hauswirth, and P. F. Sweeney. Producing Wrong Data Without Doing Anything Obviously Wrong! InASPLOS XIV, 2009.
[39] W. F. Ogilvie et al. Fast Automatic Heuristic Construction Using Active Learning. InLCPC. 2014.
[40] E. Park, J. Cavazos, L.-N. Pouchet, C. Bastoul, A. Cohen, and P. Sadayappan. Predictive Modeling in a Polyhedral Optimiza-tion Space.International Journal of Parallel Programming, 41 (5), 2013.
[41] P. Petoumenos, G. Keramidas, H. Zeffer, S. Kaxiras, and E. Hagersten. STATSHARE: A Statistical Model for Managing Cache Sharing via Decay. InMoBS, 2006.
[42] P. Petoumenos, L. Mukhanov, Z. Wang, H. Leather, and D. S. Nikolopoulos. Power Capping: What Works, What Does Not.
InICPADS, 2015.
[43] L.-N. Pouchet. Polybench: The polyhedral benchmark suite.
URL: http://polybench. sourceforge. net, 2012.
[44] J. Power, A. Basu, J. Gu, S. Puthoor, B. M. Beckmann, M. D. Hill, S. K. Reinhardt, and D. A. Wood. Heterogeneous System
Coherence for Integrated CPU–GPU Systems. InMICRO,
2013.
[45] K. K. Pusukuri, R. Gupta, and L. N. Bhuyan. Thread Tran-quilizer: Dynamically reducing performance variation.ACM TACO, 2012.
[46] C. E. Rasmussen and C. K. I. Williams.Gaussian Processes
for Machine Learning. The MIT Press, 2006.
[47] B. Settles.Active Learning. Morgan and Claypool, 2012. [48] F. Siebert. Constant-Time Root Scanning for Deterministic
Garbage Collection. InCC, 2001.
[49] M. Stephenson, S. Amarasinghe, M. Martin, and U.-M. O’Reilly. Meta Optimization: Improving Compiler Heuristics with Machine Learning. InPLDI, 2003.
[50] M. Stephenson, S. Amarasinghe, M. Martin, and U.-M. O’Reilly. Meta Optimization: Improving Compiler Heuristics with Machine Learning. InPLDI, 2003.
[51] M. A. Taddy, R. B. Gramacy, and N. G. Polson. Dynamic Trees for Learning and Design. Journal of the American Statistics
Association, 106(493), 2009.
[52] Z. Wang and M. F. O’Boyle. Mapping Parallelism to Multi-cores: A Machine Learning Based Approach. InPPoPP, 2009. [53] Z. Wang and M. F. O’Boyle. Partitioning Streaming Parallelism for Multi-cores: A Machine Learning Based Approach. In PACT, 2010.
[54] Z. Wang and M. F. P. O’Boyle. Using Machine Learning to Partition Streaming Programs.ACM TACO, 2013.
[55] Z. Wang, D. Powel, B. Franke, and M. F. O’Boyle. Exploitation of GPUs for the Parallelisation of Probably Parallel Legacy Code. InCC, 2014.
[56] Z. Wang, G. Tournavitis, B. Franke, and M. F. P. O’boyle. Integrating Profile-driven Parallelism Detection and Machine-learning-based Mapping.ACM TACO, 2014.
[57] Y. Wen, Z. Wang, and M. O’Boyle. Smart multi-task schedul-ing for OpenCL programs on CPU/GPU heterogeneous plat-forms. InIEEE HiPC, 2014.
[58] R. Wilhelm et al. The Worst-Case Execution-Time Problem – Overview of Methods and Survey of Tools.ACM TECS, 2008. [59] S. Zhuravlev, S. Blagodurov, and A. Fedorova. Address-ing Shared Resource Contention in Multicore Processors via Scheduling. InASPLOS XV, 2010.
[60] M. Zuluaga, A. Krause, G. Sergent, and M. Püschel. Active Learning for Multi–Objective Optimization. InICML, 2013. [61] M. Zuluaga et al. “Smart” Design Space Sampling to Predict