Munich Personal RePEc Archive
The Factors Influence Credit Risk in
Japan Banking Sector Specific for Kyoto
Bank
Mohammad Azmi, Nur Syafikah Atirah
universiti utara malaysia
16 December 2018
The Factors Influence Credit Risk in Japan Banking Sector Specific for Kyoto Bank
Nur Syafikah Atirah Binti Mohammad Azmi
Universiti Utara Malaysia
nur_syafikah_atirah@sefb.uum.edu.my
Abstract
This research paper is to the performance of credit risk in japan bank specific for Bank of Kyoto.
The measurement is based on bank specific factor and macroeconomics factor. However, the
finding result would determine whether both of factors is correlated significant or uninfluenced.
Keywords: bank specific factor, macroeconomic factor, credit risk.
OBJECTIVE
1) To study the factor influence Credit Risk performance.
2) To determine relationship between bank specific factor and macroeconomic.
3) To find out the most significant correlated the Credit Risk performance.
1.0 INTRODUCTION
Credit risk is very important to financial institutions. Especially in the present time where cash is
not only limited to paper but the value of currencies and commodities is of invisibility like crypto
currencies. Furthermore, it can be understood that credit risk is a potential opportunity for the
borrower to fail to pay the loan to the financial institution at a predetermined timeframe. The study
will be specific to Japan's bank yards on the financial performance of financial institutions and
how to manage credit risk. Bank of Kyoto, Ltd. is a Japanese bank based in Kyoto. The Bank
operates primarily in the Kansai region with over 165 branches in Kyoto, Osaka, Shiga, and Nara,
Hyogo, Aichi and Tokyo regions. Business transactions are based on banking services such as
deposits, loans, commodities trading, securities investments, and foreign and domestic exchange
1 commercial support services, manpower transmissions, credit guarantee services, credit card
services, economic outlook and consulting services. The bank was established on October 1, 1941,
so it has been noted that the bank has a total of 3,428 employees. Kyoto Bank has been listed on
the Tokyo Stock Exchange and market capitalization.
2.0 LITERATURE REVIEW
The aim of this paper are based on the past research like articles, journal and etc. that related to
the factor that influence credit risk. Selection of individual loans, or borrowers, risk assessment
techniques play a key role in managing and minimizing credit risk. It only occurs after the
determination of the risks represented by each individual borrower and by individual credit
services that can begin managing the loan portfolio as overall. Assessment of the credit risk of the
borrower based on the study and qualitative and quantitative indicators of economic conditions
borrower (Korobova, 2010). According to Kurawa & Garba (2014), credit risk is a chance of a loss
on loan that effect from borrower that not payback the loans. Heffernan (2015) says there are many
bank occur a bankruptcy that causes by a big ratio of credit risk. So, credit risk analysis is very
significant. In past studies, Castro (2012) say that there are many external and internal factors that
affect credit risk in banking sector. Example for external factor are changes in exchange rate,
increasing in Gross Domestic Product, rate of employment, inflation rate, and change in economic
regulation as well the changes in political structure. The internal factor that influence credit risk
are character of a borrower, bank’s financial position and etc. Based on Goyal (2010) credit risk,
market risk, operational risk, interest rate risk, liquidity risk and exchange risk are the types of
risks that the banking sector will face. (Heffernan, 1996) Liquidity risk is the inability to finance
the day-to-day operations of the bank. Based on the statement Demerjian, P. R. (2007). The five
types commonly used financial ratio covenants is Minimum Coverage, Maximum Debt to Cash
Flow, Minimum Net Worth, Maximum Leverage, and Minimum Current. Each one has a
relationship with the credit risk of the borrower. Of the three using one step of operation
performance. Coverage and debts to their respective cash flows are calculated based on income
from earnings statement, while net value captures equity holders. Operation presentations are
2 that Earnings are a good forecast for future cash flows. According to Tam, K. Y. (1992). The high
percentage of commercial bank failures, has led to the economic crisis in recent years. As such, it
is advisable that financial institutions be desirable to explore new predictive techniques to ensure
that early warnings are taken to avoid harmful consequences.
3.0 METHODOLOGY
3.1 Introduction
Methodology is a analytically techniques to solve the research objective or research problem
(Kohtari, 2004). The methodology has included several contents such as historical data,
publication research, surveys and interviews. Research methodology is broader that has sub of
research methods. In this paper, the study of a relationship between the banking credit risk and its
determinants Kyoto Bank in Japan is a main idea by using few method.
3.2 Population / sampling technique
The population that has chosen in this study is banking sector in Japan and the sample that selected
from the population is a Kyoto Bank. The historical data that used in this study is from the annual
report that available in bank’s which are from year 2013- 2017. The independent variable which comprise firm specific factors and dependent variable comprise the macroeconomic factors was
determine by the collected data.
3.3 Statistical technique
This study is selected banking industry which is Kyoto Bank in Japan. It will used collected
historical data from Mizuho Financial Group website in the annual report from the years
2013-2017. The bank specific factors which are liquidity, profitability, operational and credit risk in this
study is determine from Mizuho Bank balance sheet and also income statement. While Gross
Domestic Product (GDP), economic growth, domestic demand, investment, inflation rate, money,
unemployment rate and exchange rate are the macroeconomics determinants that collected from
3 The Ordinary Least Square (OLS) method were used to estimate the statistical finding of linear
such as descriptive statistics, correlation and regression. Correlation analysis is used to see the
percentage of relationship that influence credit risk by the internal and external factor. While
regression analysis is used to see the suitable independent variable that indicate to dependent
variable. The data analyze using Statistical Package for Social Sciences (SPSS) based on the
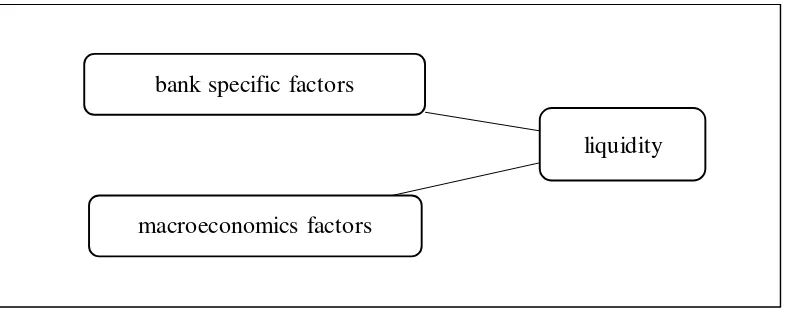
[image:5.612.75.468.215.370.2]collected data. There are two independent variable and one dependent variable in this study.
Figure 1 Research Framework of independent and dependent variables.
Multivariate regression analysis was used in this study to find out the determinant of dependent
independent variable. It will show the impact of those variable. The multivariate regressions
formula are explained by the regression equation as follow of each model:
LR = β0 + β1DR + β2ROA + β3ORA + ε ……….. Equation 1
LR = β0 + β1INFLA + β2UNEMP + β3ER + β4GDP+ ε ………. Equation 2
LR = β0 + β1DR + β2ROA + β3ORA + β4INFLA + β5UNEMP + β6ER + β7GDP + ε
……… Equation 3
liquidity bank specific factors
4 Table 1
Measurement of variables
No. Variables Notation Measurement
1 Debt Ratio DR total liability / total asset
2 Asset Turnover ratio ATO Total loan / total assets
3 debt equity ratio DER Total liability /
4 Return on equity ROE Net income / shareholder
equity
5 Liquidity ratio LR Total asset / total liability
6 Net profit margin NP Net income / loan
7 Operating Return on Asset ORA Operating income / total asset
8 Return on Asset ROA Net income / total asset
9 Operating ratio OMR Operating income / total loan
10 Net interest margin NIM Net interest income / average
earning assets
5
Measurement of variables
Variables Notation Measurement
Liquidity ratio LR Total asset / Total liability
Debt Ratio
Asset Turnover ratio
debt equity ratio
Return on equity
Liquidity ratio
Net profit margin
Operating Return on Asset
Return on Asset
Operating ratio
Net interest margin
DR ATO DER ROE LR NP ORA ROA OMR NIM
total liability / total asset
Total loan / total assets
Total liability /
Net income / shareholder equity
Total asset / total liability
Net income / loan
Operating income / total asset
Net income / total asset
Operating income / total loan
Net interest income / average
earning assets
Non-performing loan ratio
Population
NPFR
PA
Non-performing loan / Total loan
5 years Population
Gross Domestic Product GDP 5 years GDP
Economic Growth EG 5 years Economic growth
Investment INVES 5 years Investment
Inflation rate IR 5 years Inflation rate
Exchange rate EXCHA 5 years Exchange rate
Unemployment rate UR 5 years Unemployment rate
Money
Domestic Demand
M
DD
6
4.0 FINDINGS RESULTS
4.1 Trend analysis
4.1.1 Liquidity ratio
Graph 1 Trend of liquidity ratio.
The graph 1 is show the liquidity ratio performance by Kyoto bank from 2013 to 2017. From 2013
to 2015 is rose but decline at 2016 and rise again in 2017. . Liquidity is the company capability to
settle the short term obligation. The more liquidity is better for company. The above graph show
that 2015 has the best liquidity than others year. And the lowest liquidity is in 2013. Kyoto liquidity
ratio show a better trend over a year. The more liquid asset Kyoto have, the better for the company
meet their short term obligation.
4.1.2 Leverage risk
7 Based on graph 3, it shows that the trend of debt ratio. Debt ratio is measure the amount of debt
that company obligates. Financial leverage is important to sustain the company. The higher the
leverage, the more probability of financial risk. The ratio for 2013 is 0.9393 and it continuous
decrease to 0.9139 for 2017 but increase again in 2016. However, the debt ratio of Kyoto getting
lower from year to year
4.1.4 Debt Equity Ratio
Graph 2 Trend of debt ratio
According to graph 2, Debt equity ratio from 2013 to 2017 is declined. It means Bank of Kyoto
8
[image:10.612.74.529.167.666.2]4.2 Descriptive analysis
Table 2
Descriptive statistics
Variable Mean Std. Deviation Mean Std. Deviation Std. Deviati
Model 1
Model 2
LR 1.081 .013598
DR .9239 .010833
ATO .54486 .016146
DER 13.00350 2.947623
ROE .03208 .004688
ROA .19502 .093130
OJ 19443.80000 2300.872378
ORA .13954 .029516
OMR 1.23056 1.291499
NIM .47702 .076034
NPFR P GDP EG DD INVES IR M UR
2.37800 .758597
9
4.3 Correlation
[image:11.612.42.562.165.546.2]4.3.1 Correlation of Model 1
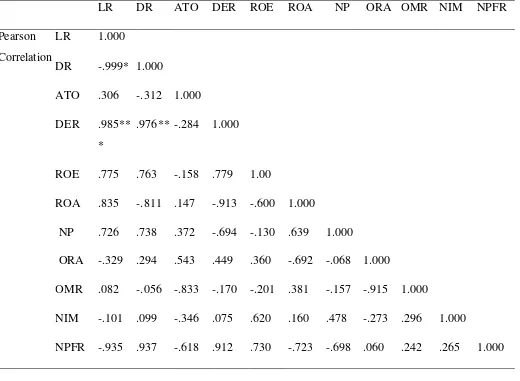
Table 3
Correlation of Model 1(bank specific factors)
LR DR ATO DER ROE ROA NP ORA OMR NIM NPFR
Pearson
Correlation
LR 1.000
DR -.999* 1.000
ATO .306 -.312 1.000
DER .985**
*
.976** -.284 1.000
ROE .775 .763 -.158 .779 1.00
ROA NP ORA OMR NIM NPFR .835 .726 -.329 .082 -.101 -.935 -.811 .738 .294 -.056 .099 .937 .147 .372 .543 -.833 -.346 -.618 -.913 -.694 .449 -.170 .075 .912 -.600 -.130 .360 -.201 .620 .730 1.000 .639 -.692 .381 .160 -.723 1.000 -.068 -.157 .478 -.698 1.000 -.915 -.273 .060 1.000 .296 .242 1.000
.265 1.000
* Correlation is significant at 0.10
** Correlation significant at 0.05
*** Correlation significant at 0.001
Based on the table 3, debt ratio and debt equity ratio has most significant to the liquidity with p
value < 0.0001 in different movement. Debt equity ratio has positively correlated with r= 985.
While, the debt ratio has strong negatively correlated with r= -.999. Besides, the asset turnover,
10 performing financial ratio is not significant to liquidity. But, asset turnover, return on asset, Return
on Asset, net profit, and Operating ratio has positively correlated with r=.306, r=.835, r=.775,
r=.726, r=.082. While return on equity, net interest margin, and non-performing loan are negatively
correlated.
[image:12.612.34.579.264.558.2]4.3.2 Correlation of Model 2
Table 4
Correlation of Model 2 (macroeconomic factors)
* Correlation is significant at 0.10
** Correlation significant at 0.05
*** Correlation significant at 0.01
Table 4 shows that not have significant to the liquidity ratio with macroeconomic factor.
LR P GDP EG DD INVES IR M UR
Pearson
Correlation
L 1.000
P . 1.000
GDP -.624 . 1.000
EG -.079 . .097 1.000
DD -.537 . .280 .874 1.000
INVES -.847 . .506 .472 .814 1.000
IR M UR -.250 -.650 -.898 . . . -.115 .935 .230 -.737 .356 .078 -.440 .515 .534 .096 .566 .744 1.000 -.382 .282 1.000
11
[image:13.612.75.537.155.326.2]4.4 Model summary
Table 5
Model summary and of bank specific factors and macroeconomic factor
Model 1 Model 2 Model 3
Model R
Square
Adjusted R
Square
R
Square
Adjusted R
Square R Square
Adjusted R
Square
1 .998 .997
2 1.000 1.000
.806 .741
1 9.998 .997
2 1.000 1.000
Dependent Variable: LR
a. Predictors: (Model 1and 2), DR,
b. Predictors: (Model 1 and 3), DR, DER
c. Predictors(Model 2), UR
Based on the result in Model Summary, the adjusted R square for model 1 and model 2 are.997
and 1.000. This clarified that the 99.7 % variations of debt ratio explained by the variations in the
liquidity of Kyoto bank. The unemployment rate has the R square of -.898. This explained that
89.9 % variations of unemployment rate explained by the variation of liquidity and the 10.5 % was
12
[image:14.612.73.508.152.335.2]4.5 Anova
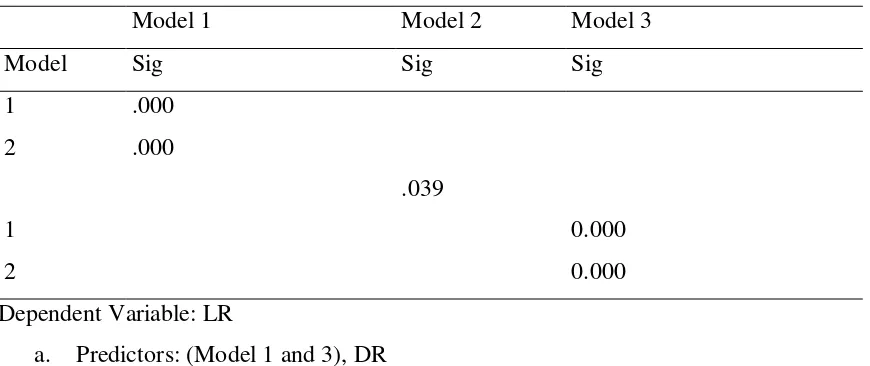
Table 7
Anova of Model 1, 2 and 3
Model 1 Model 2 Model 3
Model Sig Sig Sig
1 .000
2 .000
.039
1 0.000
2 0.000
Dependent Variable: LR
a. Predictors: (Model 1 and 3), DR
b. Predictors: (Model 1 and 3), DR, DER
c. Predictors: (Model 2), UR
Based on the result in Model Summary and Macroeconomic factors table, the UR has the R square
of -.898. This explained that 89.9% variations of unemployment explained by liquidity and the
10.5% was unexplained. The debt ratio and debt equity ratio has more significant to liquidity with
p=0.000 which is p <0.10. Moreover, UR has more significant to liquidity with p= 0.039 which is
13
[image:15.612.108.505.132.281.2]4.6 Coefficients
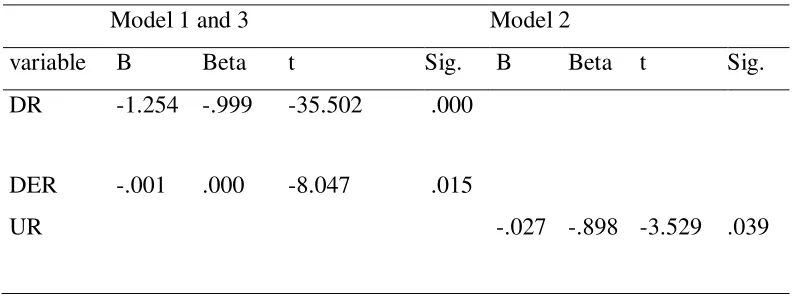
Table 9
Regression coefficient of Model 1,2 and 3
Model 1 and 3 Model 2
variable B Beta t Sig. B Beta t Sig.
DR -1.254 -.999 -35.502 .000
DER -.001 .000 -8.047 .015
UR -.027 -.898 -3.529 .039
Based on table 9, there is three variable that explained the coefficient of regression. Two variable
were explained Model 1 and one variable for Model 2. Debt ratio has more significant because the
p value =0.000 with p value <0.001. Besides, the beta for debt ratio is -.999 and t value=-35.502.
It show that the most negative influence between liquidity and debt ratio. Every 1%t increase in
liquidity will decrease in debt ratio for 99.9. %. A high debt will cause the cash flows having an
interruption and lead to increase in credit risk. However, debt equity ratio shows that it is
significant than debt ratio which p= -.001 is p <0.001 and the beta is 0.000 and has positive
influence to liquidity. It clarify that 1% increasing in Debt equity ratio will also rise the liquidity
by 1%. Based in Model 2, the unemployment rate is moderate significant to the liquidity with
p=0.039 which is p < 0.05 and it has negative influence to the liquidity. When economic increase
in unemployment rate, it consequence to decrease in cash and lead to decreased in liquidity.
5.0 DISCUSSION AND RECOMMENDATION
From the coefficient table, the factors influence Credit Risk performance is Debt Ratio, Debt
Equity Ratio and Unemployment rate is significant influence the liquidity ratio. Increased in
Liquidity ratio means during inflation, the money value received is losses, loss the change for
saving in taxes exclusion and increased in interest rate. However debt of ratio increase is showing
a good ways for company getting advantages for reduce the interest tax. But the Risk manager of
this bank should planning and make decision for the number of Debt ratio to accepted because it
14 Kyoto, as of May 2018 appears A for both of credit rating agency which is (S&P) and (R&I). This
sign is good for the investor who is interested to issuing the investment with Bank of Kyoto.
6.0CONCLUSION
In nutshell, that has relationship between debt ratio and equity ratio with liquidity ratio. Every
1%t increase in liquidity will decrease in debt ratio for 99.9. %. A high debt will cause the cash
flows having an interruption and lead to increase in credit risk. It clarify that 1% increasing in Debt
equity ratio will also rise the liquidity by 1% for Kyoto Bank performance.
7.0 REFERENCES
Goyal, K. A. “Risk Management in Indian Banks: Some Emerging Issues”, International Journal of Environment Research, 1(1), (2010): 102-109.
Heffernan, S. 1996, Modern Banking in Theory and Practice, John Wiley&Sons, U.S.A.
Barth, M., D. Cram, and K. Nelson. 2001. Accruals and the prediction of future cash flows. The
Accounting Review 76(1): 27-58.
Dechow, P., S. Kothari, and R. Watts. 1998. The relation between earnings and cash flows. Journal
of Accounting and Economics 25: 133-168.
Demerjian, P. R. (2007). Financial ratios and credit risk: The selection of financial ratio covenants
in debt contracts.
TAM, K. Y. (1992). Managerial applications of neural networks: the case of bank failure
predictions. Management Science, 38, 926-947.
"Bank of Kyoto Ltd/The". www.bloomberg.com. Bloomberg. Retrieved 10 November 2015.
"Bank of Kyoto". www.relbanks.com. Banks around the World. Retrieved 10 November 2015.
"Profile: Bank of Kyoto Ltd (8369.T)". www.reuters.com. Reuters. Retrieved 10 November 2015.
"Annual Report". www.kyotobank.co.jp. Bank of Kyoto. Retrieved 5 December 2017.