ISSN Online: 2153-1188 ISSN Print: 2153-117X
DOI: 10.4236/msa.2017.812063 Nov. 10, 2017 859 Materials Sciences and Applications
Effect of Additional Surfaces on Ordinary
Portland Cement Early-Age Hydration
Tapio Vehmas
1*, Anna Kronlöf
2, Andrzej Cwirzen
31VTT Technical Research Centre of Finland Ltd., Espoo, Finland 2VTT Expert Services Oy, Espoo, Finland
3Department of Civil, Environmental and Natural Resources Engineering, Luleå University of Technology, Luleå, Sweden
Abstract
Early-age hydration of Ordinary Portland Cement (OPC) was studied in the presence of two additional surfaces. Additional surfaces are known to accele-rate the early-age hydration of OPC. Autocatalytic reaction modelling was used to determine acceleration mechanism of additional surfaces. Heat de-velopment of the hydration was measured with semi-adiabatic calorimetry and the results were modelled with an autocatalytic reaction. Autocatalytic reaction modelling was able to determine number of initially active nucleation sites in early-age hydration. OPC hydration followed autocatalytic reaction principles throughout induction period and accelerating period. Both of the added surfaces, limestone filler and calcium-silicate-hydrate (C-S-H) coated limestone filler accelerated the early-age hydration. According to autocatalytic modelling, the C-S-H coated filler increased the number of initially active nucleation sites. Pristine limestone filler accelerated the early-age hydration by providing the additional nucleation sites throughout the early-age hydra-tion. The difference was explained with common theories of nucleation and crystal growth. Autocatalytic model and measured calorimeter curve started to significantly deviate at the inflection point, where the reaction mode changed. The reaction mode change depended on the average particle dis-tance. Early-age hydration, modelled as autocatalytic reaction was able to im-prove understanding of OPC early-age hydration and quantify the number of initially active nucleation sites. Understanding and quantifying the accelera-tion mechanisms in early-age hydraaccelera-tion will aid larger utilizaaccelera-tion of supple-mentary cementitious materials where understanding the early-age strength development is crucial.
Keywords
Ordinary Portland Cement, Hydration, Early-Age, Surfaces, How to cite this paper: Vehmas, T.,
Kronlöf, A. and Cwirzen, A. (2017) Effect of Additional Surfaces on Ordinary Port-land Cement Early-Age Hydration. Mate-rials Sciences and Applications, 8, 859-872. https://doi.org/10.4236/msa.2017.812063
Received: September 18, 2017 Accepted: November 7, 2017 Published: November 10, 2017
Copyright © 2017 by authors and Scientific Research Publishing Inc. This work is licensed under the Creative Commons Attribution International License (CC BY 4.0).
http://creativecommons.org/licenses/by/4.0/
DOI: 10.4236/msa.2017.812063 860 Materials Sciences and Applications Autocatalytic Reaction
1. Introduction
In recent decades, nucleation and crystal growth mechanisms has received an ever strengthening position as the explanation of hydration phenomena of
Or-dinary Portland Cement (OPC) [1]. It is largely recognized that cement
hydra-tion can be divided into various stages: initial dissoluhydra-tion, induchydra-tion period,
ac-celerating period and deceleration period [1][2]. Earlier, application of classical
crystal growth theories [3][4] failed to explain slow hydration during the
induc-tion period without addiinduc-tional hindering process. This hindering process has been explained with formation of membranes with meta-stable layers and their later rupture. During the past decade, the fundamental work of Nonat and
oth-ers [5]-[12] cast doubt on the existence of membranes. Recently, Thomas
adapted a modified Avrami crystal growth model [3] and successfully explained
the origin of the induction period as a part of a crystallization process, without a need for additional hindering mechanism. At present, a massive body of expe-rimental and modelling studies supports theory that a slow reaction stage, the induction period, is related to a small number of active growth sites of cal-cium-silicate-hydrate. Also formation of membranes is observed and modelled
[13][14]. Further evidence for nucleation models were gained from addition of
artificial growth sites of calcium-silicate-hydrate by Thomas et al., in the form of
a pre-precipitated calcium-silicate-hydrate (C-S-H) [15].
A number of authors indicated that the rate of OPC hydration depended on the amount of reaction products, which is analogous to the autocatalytic reaction
[16][17] [18]. It has been also observed that various fine materials accelerated
hydration processes [19][20][21][22][23]. According to the autocatalytic
reac-tion theory, the reacreac-tion product acts as catalysis for further reacreac-tion by accele-rating the reaction (Equation (1)). This type of reaction exhibits an S-shaped correlation between the amounts of reaction product and the time. In the pseu-do-first-order reaction, the reaction rate can be expressed as a sum of a two-stage reaction (Equation (2)):
[ ] [ ]
A + B →2[ ]
B (1)[ ]
[ ][ ]
1 2
k=k A +k A B (2)
where [A] represents a concentration of initial materials and [B] represents a
concentration of formed reaction products. k1 and k2 coefficients take into
ac-count the reaction rates. The autocatalytic reaction includes initiation of the
reaction (reaction rate coefficient k1) followed by the autocatalytic reaction
(reaction rate coefficient k2). These two reactions can be described as non-catalytic
DOI: 10.4236/msa.2017.812063 861 Materials Sciences and Applications
and precipitation stages of calcium-silicate-hydrates (C-S-H) [6][7]. Within the
first approximately 15 min, the process consists of the dissolution of calcium and silicate up to their maximum supersaturation level along with the primary preci-pitation of C-S-H nuclides. This can be considered as the non-catalytic stage of reaction which later initiates the second stage reaction, the crystal growth of C-S-H. As the duration of the period of the primary nucleation step is negligible compared to the reaction period examined here, the non-catalytic-reaction in Equation (1) can be replaced with the quantity of C-S-H formed initially during
the primary nucleation step [B0]. The quantity of formed reaction product [B] at
given time can be expressed as a simple mathematical equation for autocatalytic reaction (Equation (3)):
[ ]
[ ]
[ ] [ ]
[ ]
([ ] [ ])[ ]
0 0 2
0 0
0 0
0
1 e A B k t
B A
B B
A
B − − +
= −
+
(3)
where [A0] represents an overall initial material concentration, t is the time from
initial nucleation and k2 is the reaction rate coefficient of autocatalytic reaction.
The main objective of the present study was to analyze the effects of various sur-faces on early-age hydration of Portland cement using calorimetric data com-bined with the autocatalytic reaction model of the C-S-H phase.
2. Materials and Methods
The used cement was white Ordinary Portland Cement type CEM I 52,5 R, from Aalborg. The limestones fillers, type SB63, were produced by Nordkalk Oy. The provided fillers had different finesses and are commonly used in self-compacting concrete in Finland. Chemical compositions of used cement and limestone filler
are shown in Table 1. Particle distributions were measured with a Beckman
Coulter LS particle size analyzer. The specific surface areas (SSA) were calculated
from the particle size distributions (Figure 1).
Calcium-silicate-hydrate (C-S-H) coated limestone was produced by
vigo-rously mixing Na2(SiO2)3,3 and Ca(OH)2 respectively to water in the presence of
limestone filler. The used Ca(OH)2 was purchased from Fluka analytical and
Na2(SiO2)3,3 from Huber engineered materials (Zeopol 33). The amounts of
reactants in the solution were defined to produce a layer with the average
thick-ness of 8.4 nm. The density of the layer was expected to be 2.6 mg/m3 according
to the formula (CaO)1,7(SiO2)(H2O)1.8[24].
After precipitation of the C-S-H limestone fillers were immediately washed
three times with 5 mM Ca(OH)2 which was saturated in respect to silicon.
DOI: 10.4236/msa.2017.812063 862 Materials Sciences and Applications Figure 1. Grading curves for used materials. The specific surface areas calculated from the size distributions were OPC: 609 m2/kg; limestone filler 1: 376 m2/kg; limestone filler 2: 1648 m2/kg; and limestone filler 3: 2930 m2/kg.
Table 1.Compositions of used white ordinary Portland cement and limestone.
Elemental composition CEM I 52.5R Limestone
CaO 69% 48%
SiO2 25% 6%
Al2O3 2.1% 1.0%
Fe2O3 0.3% 0.6%
MgO 0.7% 3.6%
SO3 0.3% -
Ignition loss <1% 40%
(Figure 2). Pastes were prepared by mixing all dry materials for 1 min, followed by addition of the tempered water in the next 30 s. The total mixing time was 5 minutes. Samples were placed into a semi-adiabatic calorimeter 15 min after mixing. It was assumed that the initial heat of dissolution was lost and the
ob-served heat originated from silicate based reactions [25]. Heat capacities were
calculated and the experiments conducted according standard procedure [26]
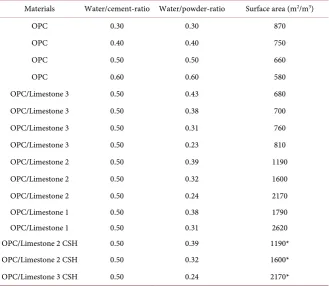
with two parallel samples. The experimental mixes are listed in Table 2.
The heat output rate at the increasing temperature of the semi-adiabatic con-ditions was normalized to constant temperature with Arrhenius equation using
the value of 33 kJ/mol for the apparent activation energy [26][27].
The autocatalytic reaction Equation (3) was fitted to the normalized calori-meter curves using the Excel solver function. Assuming that observed hydration
heat was proportional to the formation of C-S-H, [B] represented the formed
calcium-silicate-hydrate and [B0] the quantity of the initially formed C-S-H. [A0]
0
10
20
30
40
50
60
70
80
90
100
0.1
1
10
100
1000
C
um
ul
a
ti
v
e
pa
rt
ic
le
di
s
tr
ibut
ion /
%
Particle size /µm
OPC
Limestone filler 1
Limestone filler 2
[image:4.595.211.539.370.505.2]DOI: 10.4236/msa.2017.812063 863 Materials Sciences and Applications Figure 2. Scanning electron microscope images of uncoated calcite surface (left) and C-S-H coated calcite surface (right). The coating in the image was made on pure precipitated calcite in order to better illustrate the surface details produced by the C-S-H coating.
Table 2. Compositions of studied pastes.
Materials Water/cement-ratio Water/powder-ratio Surface area (m2/m3)
OPC 0.30 0.30 870
OPC 0.40 0.40 750
OPC 0.50 0.50 660
OPC 0.60 0.60 580
OPC/Limestone 3 0.50 0.43 680
OPC/Limestone 3 0.50 0.38 700
OPC/Limestone 3 0.50 0.31 760
OPC/Limestone 3 0.50 0.23 810
OPC/Limestone 2 0.50 0.39 1190
OPC/Limestone 2 0.50 0.32 1600
OPC/Limestone 2 0.50 0.24 2170
OPC/Limestone 1 0.50 0.38 1790
OPC/Limestone 1 0.50 0.31 2620
OPC/Limestone 2 CSH 0.50 0.39 1190*
OPC/Limestone 2 CSH 0.50 0.32 1600*
OPC/Limestone 3 CSH 0.50 0.24 2170*
*Surface area of limestone filler prior CSH coating.
was chosen the arbitrarily as a value of 400 kJ/kg based on manufacturers infor-mation. Fitting was done by enabling a free variation of constant representing a
number of initial C-S-H nuclei [B0] and reaction rate constant k2. The curves
ex-hibited a clear knee point limiting the extent of fitting. According to Equation
(3), [B0] is responsible for the early start-up of the reaction and k2 for its later
propagation. If the reaction would follow the autocatalytic mode precisely, the
value of the reaction rate coefficient (k2) would yield a constant value. Any
[image:5.595.209.539.293.580.2]DOI: 10.4236/msa.2017.812063 864 Materials Sciences and Applications according to the model alone. Example of calorimeter curves and autocatalytic
modelling are in Figure 3.
The end of the accelerating period was determined by maximum value of the heat rate, which denotes the end of accelerating period and beginning of decele-rating period. This point was named as the inflection point.
3. Results
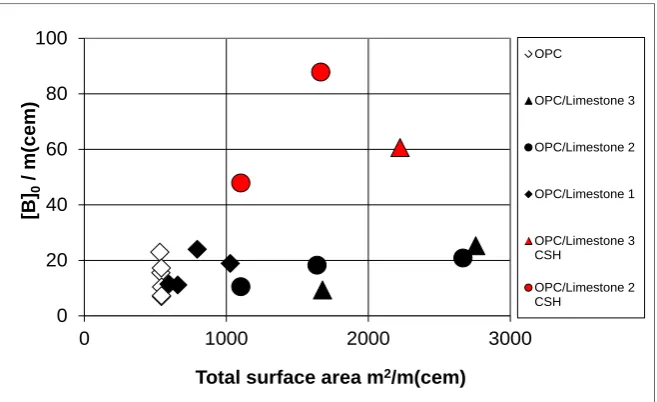
Addition of limestone fillers accelerated heat evolution in all studied samples. Even greater acceleration was observed when C-S-H coated limestone was used. The application of the autocatalytic model to the heat output revealed that the
quantity of the initial C-S-H, [B0] increased as the water/cement-ratio (w/c)
in-creased (Figure 4). Addition of limestone filler increased the total surface area to
[image:6.595.209.538.280.471.2] [image:6.595.210.539.501.702.2]the mix but did not affect the quantity of the formed C-S-H. On the contrary
Figure 3. Measured semi-adiabatic calorimetric curves and modelled autocatalytic curves.
Figure 4. Modelled number of active C-S-H growth sites and water/cement-ratio.
0 100 200 300 400
0 5 10 15
To
ta
l he
at
/[k
J]
Maturity /[h]
OPC/Limestone 2 CSH Autocatalytic model OPC/Limestone 2 CSH Measured
OPC/Limestone 2 Autocatalytic model OPC/Limestone 2 Measured OPC
Autocatalytic model OPC
measured
0 20 40 60 80 100
0.3 0.4 0.5 0.6
[B]
0
/ m(
c
e
m)
water/cement -ratio
OPC
OPC/Limestone 3
OPC/Limestone 2
OPC/Limestone 1
OPC/Limestone 3 CSH
DOI: 10.4236/msa.2017.812063 865 Materials Sciences and Applications addition of the C-S-H coated limestone filler increased the quantity of the C-S-H
significantly (Figure 5). This quantity increased up to 4.5 fold compared to the
uncoated limestone or pure cement pastes. The autocatalytic reaction rate
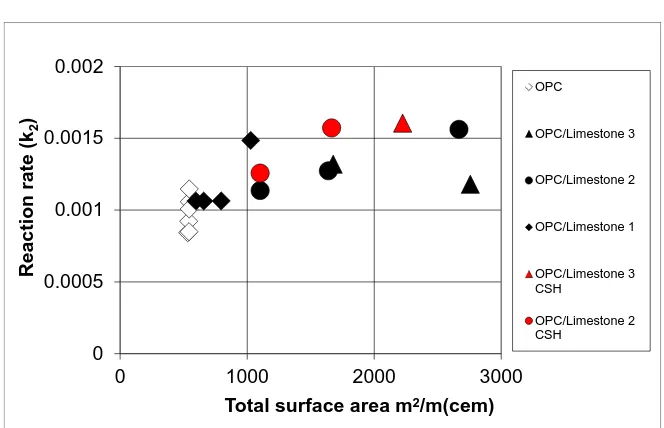
coef-ficient k2 decreased as w/c-ratio increased but increased in the presence of
li-mestone fillers and C-S-H coated lili-mestone fillers (Figure 6) (Figure 7).
The heat output at the inflection point (point where the reaction rate began to decrease) increased as the w/c-ratio increased. Addition of limestone and C-S-H
coated limestone appeared to decrease the heat output (Figure 8).
4. Discussion
[image:7.595.210.539.265.466.2] [image:7.595.209.539.498.704.2]Although the experiments were made with white Ordinary Portland Cement and grounded limestone, the cement hydration followed the autocatalytic reaction
Figure 5. Modelled number of active C-S-H growth sites and total surface area.
Figure 6. Modelled autocatalytic reaction rate (k2) and water/cement-ratio. 0
20 40 60 80 100
0 1000 2000 3000
[B]
0
/ m(
c
e
m)
Total surface area m2/m(cem)
OPC
OPC/Limestone 3
OPC/Limestone 2
OPC/Limestone 1
OPC/Limestone 3 CSH
OPC/Limestone 2 CSH
0 0.0005 0.001 0.0015 0.002
0.3 0.4 0.5 0.6
R
e
a
c
ti
o
n
ra
te
(k
2
)
water/cement -ratio
OPC
OPC/Limestone 3
OPC/Limestone 2
OPC/Limestone 1
OPC/Limestone 3 CSH
DOI: 10.4236/msa.2017.812063 866 Materials Sciences and Applications Figure 7. Modelled autocatalytic reaction rate (k2) and total surface area.
Figure 8. Inflection point and water/cement-ratio.
principles within the first hours. An excellent fitting for autocatalytic model was observed throughout the induction period and the acceleration period. Excellent fitting does not confirm the autocatalytic nature of the early-age hydration. Mul-tiple models match the sigmoidal shape of the curve, producing the so-called
sigmoidal fraud [28]. However, according the obtained results the autocatalytic
nature of the early-age hydration is plausible. The autocatalytic reaction and measured calorimeter curves started to significantly deviate near the point where accelerating period changed to deceleration period. This point was named as an inflection point. After the inflection point, the measured calorimeter data and autocatalytic model showed clear differences. The studied samples produced significantly less heat compared to the autocatalytic model in the deceleration period. This probably indicates some change of the reaction mechanism.
0 0.0005 0.001 0.0015 0.002
0 1000 2000 3000
R
e
a
c
ti
o
n
ra
te
(k
2
)
Total surface area m2/m(cem)
OPC
OPC/Limestone 3
OPC/Limestone 2
OPC/Limestone 1
OPC/Limestone 3 CSH
OPC/Limestone 2 CSH
0 20 40 60 80 100 120
0.3 0.4 0.5 0.6
In
fl
e
c
ti
o
n
p
o
in
t
/[k
J
]
water/cement -ratio
OPC
OPC/Limestone 3
OPC/Limestone 2
OPC/Limestone 1
OPC/Limestone 3 CSH
DOI: 10.4236/msa.2017.812063 867 Materials Sciences and Applications According to the autocatalytic modelling, the quantity of the initial C-S-H in-creased as the w/c-ratio inin-creased in pure cement pastes. This observation com-plied with earlier studies, stating that the quantity of the initial C-S-H depends
on the amount of the supersaturated silicon in the first dissolution step [6].
As limestone fillers were introduced to the mixes, the quantity of the C-S-H formed initially did not increase according to the autocatalytic modelling. How-ever, in the presence of the C-S-H coated limestone filler, the increase was up to 4.5 times higher in comparison with the uncoated filler and pure paste. The re-sult indicated that the C-S-H coating acted as nucleation sites from the very be-ginning of the measuring period.
Towards the end of the acceleratory period in the presence of the filler surfac-es, the reaction propagated faster than could be expected according the autoca-talytic reaction alone. The increased nonlinear propagation of the reaction was impossible to explain by increasing the quantity of C-S-H formed initially. Con-sequently, a deviation from the autocatalytic model in the reaction rate
coeffi-cient (k2) was introduced. The higher reaction rate could be a consequence of an
additional C-S-H nucleation which followed the primary nucleation. The addi-tional C-S-H nucleation could take place simultaneously with the autocatalytic reaction. The difference is that C-S-H growth on C-S-H does not need additional energy but the C-S-H growth on mineral surfaces must overcome energy barrier. This energy barrier is known in nucleation and crystal growth theories when materials precipitate on foreign substrate. Crystallization from solutions
under-lies in a large range of industrial, laboratory and physiological processes [29].The
precipitation process over a certain energy barrier is expressed by Equation (4)
[18]:
exp
h
h h
G
kI
K
RT
−∆
=
(4)Ih is the rate of nucleation in a unit area of substrate. Kh is a constant irrespective
of the substrate type, presenting nucleation rate without energy barrier. R is the
universal gas constant. T is a temperature and h
k
G
∆ is a potential energy
bar-rier for heterogeneous nucleation which can also be expressed as shown in
Equ-ation (5), [5][18][30]:
(
)(
)
22 cos 1 cos
4 h
k k
G G + Θ − Θ
∆ = ∆ (5)
where ∆Gk is the potential energy barrier for a homogeneous nucleation and θ is
the contact angle between the nucleating crystal and the substrate. When the
substrate is identical to nucleating crystal, θ = 0˚ and no potential barrier exist. If
the substrate does not have any similarities to nucleating crystals, then θ = 180˚
and additional nucleation rate is similar to a homogeneous nucleation. Accord-ing to the classic nucleation theory, the potential barrier for a homogeneous nucleation can be related to the degree of supersaturation as expressed in
DOI: 10.4236/msa.2017.812063 868 Materials Sciences and Applications
3
2
4π
4
π
ln
3
k
a SP
r
Q
G
r
RT
v
K
σ
∆ =
−
(6)r is the radius of nucleating product, σ is the surface tension related to the
prod-uct, υ is the molar volume of the product, Q is the ion activity product in the
supersaturated solution and Ksp is the solubility product of a
cal-cium-silicate-hydrate.
The values of surface tension (σ) of a nucleating C-S-H, molar volume (υ) and
radius (r) were determined by Gauffinet and Nonat [5]. The contact angle (θ)
between calcite and C-S-H was calculated to be 60˚ [5], which further yields the
relative nucleation rate (Ih) a value 0.13 at the equilibrium saturation. According
to calculations, additional nuclides on filler surfaces are able to precipitate dur-ing the crystal growth of calcium silicate hydrates. The larger surface area of
fil-lers in the mixes, the larger is the deviation of reaction rate k2 (Figure 7).
Ac-cording to calculations, this deviation originates further nucleation of C-S-H on mineral filler surfaces.
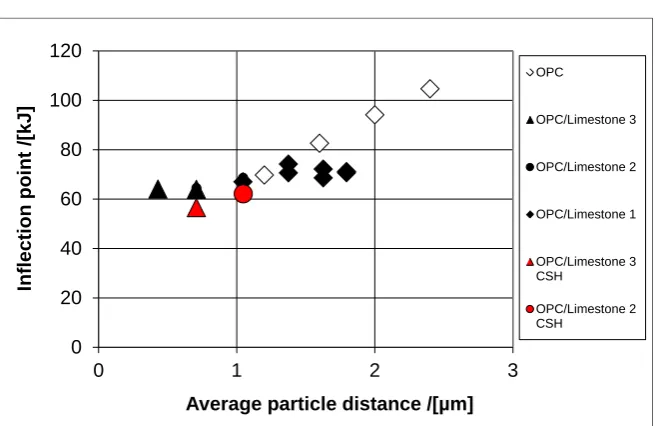
Since the filler surfaces perform as active nucleation sites for the C-S-H for-mation the hydration products will be also deposited on these surfaces along with the OPC surfaces. Consequently, a formation of a thinner product layer on OPC could be expected in the presence of fillers. The total product volume should remain the same. The calorimetric test results revealed a decreasing heat evolution at the inflection point in the presence of fillers which contradicts the earlier assumption. The formed layer of hydration product on the OPC surface at the knee point (the time of the change of the reaction mode) appeared to con-sist of a smaller quantity of product per unit of OPC surface in the presence of fillers when compared to the pure paste. This observation contradicts the wide spread thinking that the knee point corresponds to the formation of a diffusion barrier. The present test results indicate that the origin of the knee point is dif-ferent. One explanation could be related to the geometry of the particle system particularly the inter particle distances. Generally, the shorter is the distance the
smaller is the heat output at the inflection point (Figure 9) and the more limited
is the space for C-S-H formation around OPC particles presuming that the par-ticles are distributed evenly. The lack of a free volume around cement parpar-ticles is related to the onset of the densification of C-S-H beyond a critical point that re-duces its efficiency as an autocatalyst. Similar behavior was also observed when
the w/c-ratio of pure pastes was varied (Figure 8). Densification of early C-S-H
versus time has been observed with SANS measurements by Jennings et al.[32].
It has also been modelled by Bishnoi and Scrivener [33].
5. Conclusions
DOI: 10.4236/msa.2017.812063 869 Materials Sciences and Applications Figure 9. Inflection point and average particle distance.
cement hydration followed autocatalytic reaction principles throughout induc-tion period and accelerating period. Autocatalytic model and measured calori-meter curve started to significantly deviate at the inflection point, where the reaction mode changed. According autocatalytic modelling this type of reaction mode change can be understood as a densification process. In most of the sam-ples, beginning of densification process was observed to depend on the average particle distance.
A simple method to apply autocatalytic reaction was established. It was as-sumed that autocatalytic material, C-S-H, was formed through supersatura-tion/precipitation-process during the initial dissolution. It was found to be an accurate approach in terms of modelling of pure cement pastes. As limestone fillers were introduced to the mixes, the quantity of initially formed C-S-H did not increase. In case of C-S-H coated fillers, a huge increase of initially formed C-S-H was observed. The reaction rate of the autocatalytic reaction was in-creased as additional surface was introduced to samples. The inin-creased reaction rate was related to additional nucleation of C-S-H on the filler surface and sim-ple thermodynamic equations were proposed to evaluate these effects. This type of approach could give a valuable data for cement hydration simulations and
microstructural modelling [34][35], especially in the case of evaluation of effect
of supplementary cementitious materials on the early-age hydration.
Acknowledgements
This work was supported by the Finnish Funding Agency for Technology and Innovation, Nordkalk Oy Ab, Cementa Ab and Tikkurila Oyj. Authors also wish to thank Dr. Ilya Anoskin of SEM imaging.
References
[1] Bullard, J.W., Jennings, H.M., Livingston, R.A., Nonat, A., Scherer, G.W., Schweitz-0
20 40 60 80 100 120
0 1 2 3
In
fl
e
c
ti
o
n
p
o
in
t
/[k
J
]
Average particle distance /[µm]
OPC
OPC/Limestone 3
OPC/Limestone 2
OPC/Limestone 1
OPC/Limestone 3 CSH
DOI: 10.4236/msa.2017.812063 870 Materials Sciences and Applications er, J.S., et al. (2011) Mechanisms of Cement Hydration. Cement and Concrete
Re-search, 41, 1208-1223. https://doi.org/10.1016/j.cemconres.2010.09.011
[2] Scrivener, K.L. and Nonat, A. (2011) Hydration of Cementitious Materials, Present and Future. Cement and Concrete Research, 41, 651-665.
https://doi.org/10.1016/j.cemconres.2011.03.026
[3] Thomas, J.J. (2007) A New Approach to Modeling the Nucleation and Growth Ki-netics of Tricalcium Silicate Hydration. Journal of the American Ceramic Society, 90, 3282-3288.https://doi.org/10.1111/j.1551-2916.2007.01858.x
[4] Brown, P.W., Pommersheim, J. and Frohnsdorff, G. (1985) A Kinetic Model for the Hydration of Tricalcium Silicate. Cement and Concrete Research, 15, 35-41.
https://doi.org/10.1016/0008-8846(85)90006-7
[5] Garrault-Gauffinet, S. and Nonat, A. (1999) Experimental Investigation of Calcium Silicate Hydrate (C-S-H) Nucleation. Journal of Crystal Growth, 200, 565-574.
https://doi.org/10.1016/S0022-0248(99)00051-2
[6] Garrault, S. and Nonat, A. (2001) Hydrated Layer Formation on Tricalcium and Dicalcium Silicate Surfaces: Experimental Study and Numerical Simulations.
Lang-muir, 17, 8131-8138.https://doi.org/10.1021/la011201z
[7] Garrault, S., Behr, T. and Nonat, A. (2006) Formation of the C-S-H Layer during Early Hydration of Tricalcium Silicate Grains with Different Sizes. The Journal of
Physical Chemistry B, 110, 270-275.https://doi.org/10.1021/jp0547212
[8] Labbez, C., Nonat, A., Pochard, I. and Jönsson, B. (2007) Experimental and Theo-retical Evidence of Overcharging of Calcium Silicate Hydrate. Journal of Colloid
and Interface Science, 309, 303-307.https://doi.org/10.1016/j.jcis.2007.02.048
[9] Nonat, A. (2004) The Structure and Stoichiometry of C-S-H. Cement and Concrete
Research, 34, 1521-1528.https://doi.org/10.1016/j.cemconres.2004.04.035
[10] Nonat, A., Mutin, J.C., Lecoq, X. and Jiang, S.P. (1997) Physico-Chemical Parame-ters Determining Hydration and Particle Interactions during the Setting of Silicate Cements. Solid State Ionics, 101, 923-930.
https://doi.org/10.1016/j.cemconres.2004.04.035
[11] Nonat, A. (1994) Interactions between Chemical Evolution (Hydration) and Physi-cal Evolution (Setting) in the Case of TriPhysi-calcium Silicate. Materials and Structures, 27, 187-195.https://doi.org/10.1016/j.cemconres.2004.04.035
[12] Labbez, C., Jönsson, B., Pochard, I., Nonat, A. and Cabane, B. (2006) Surface Charge Density and Electrokinetic Potential of Highly Charged Minerals: Experi-ments and Monte Carlo Simulations on Calcium Silicate Hydrate. Journal of
Physi-cal Chemistry B, 110, 9219-3920.https://doi.org/10.1021/jp057096+
[13] Gallucci, E., Mathur, P. and Scrivener, K. (2010) Microstructural Development of Early Age Hydration Shells around Cement Grains. Cement and Concrete Research, 40, 4-13. https://doi.org/10.1016/j.cemconres.2009.09.015
[14] Bellmann, F., Damidot, D., Möser, B. and Skibsted, J. (2010) Improved Evidence for the Existence of an Intermediate Phase during Hydration of Tricalcium Silicate.
Cement and Concrete Research, 40, 875-884.
https://doi.org/10.1016/j.cemconres.2010.02.007
[15] Thomas, J.J., Jennings, H.M. and Chen, J.J. (2009) Influence of Nucleation Seeding on the Hydration Mechanisms of Tricalcium Silicate and Cement. The Journal of
Physical Chemistry C, 113, 4327-4334.https://doi.org/10.1021/jp809811w
DOI: 10.4236/msa.2017.812063 871 Materials Sciences and Applications
https://doi.org/10.1021/ed064p925
[17] Skalny, J.P. (1989) Materials Science of Concrete 1. American Ceramic Society Inc., Columbus.
[18] Liu, C. and Shen, W. (1997) Effect of Crystal Seeding on the Hydration of Calcium Phosphate Cement. Journal of Materials Science: Materials in Medicine, 8, 803-807.
https://doi.org/10.1023/A:1018529116330
[19] Oey, T., Kumar, A., Bullard, J.W., Neithalath, N. and Sant, G. (2013) The Filler Ef-fect: The Influence of Filler Content and Surface Area on Cementitious Reaction Rates. Journal of the American Ceramic Society, 96, 1978-1990.
https://doi.org/10.1111/jace.12264
[20] Hawkins, P., Tennis, P.D. and Detwiler, R.J. The Use of Limestone in Portland Ce-ment: A State-of the-Art Review, EB227. Portland Cement Association, Skokie, Illi-nois, 2003, 44 p.
[21] Sato, T. and Diallo, F. (2010) Seeding Effect of Nano-CaCO3 on the Hydration of Tricalcium Silicate. Transportation Research Record, 2141, 61-67.
https://doi.org/10.3141/2141-11
[22] Björnström, J., Martinelli, A., Matic, A., Börjesson, L. and Panas, I. (2004) Accele-rating Effects of Colloidal Nano-Silica for Beneficial Calcium-Silicate-Hydrate For-mation in Cement. Chemical Physics Letters, 392, 242-248.
https://doi.org/10.1016/j.cplett.2004.05.071
[23] Bentz, D.P., Ardani, A., Barrett, T., Jones, S.Z., Lootens, D., Peltz, M.A., et al. (2015) Multi-Scale Investigation of the Performance of Limestone in Concrete.
Construc-tion and Building Materials, 75, 1-10.
https://doi.org/10.1016/j.conbuildmat.2014.10.042
[24] Chen, J.J., Thomas, J.J., Taylor, H.F.W. and Jennings, H.M. (2004) Solubility and Structure of Calcium Silicate Hydrate. Cement and Concrete Research, 34, 1499-1519.
https://doi.org/10.1016/j.cemconres.2004.04.034
[25] Hesse, C., Goetz-Neunhoeffer, F. and Neubauer, J. (2011) A New Approach in Quantitative In-Situ XRD of Cement Pastes: Correlation of Heat Flow Curves with Early Hydration Reactions. Cement and Concrete Research, 41, 123-128.
https://doi.org/10.1016/j.cemconres.2010.09.014
[26] RILEM Technical Committee 119-TCE (1998) Adiabatic and Semi-Adiabatic Calo-rimetry to Determine the Temperature Increase in Concrete Due to Hydration Heat of Cement. Materials and Structures, 30, 451-464.
[27] Kada-Benameur, H., Wirquin, E. and Duthoit, B. (2000) Determination of Apparent Activation Energy of Concrete by Isothermal Calorimetry. Cement and Concrete
Research, 30, 301-305.https://doi.org/10.1016/S0008-8846(99)00250-1
[28] Scherer, G.W. (2012) Models of Confined Growth. Cement and Concrete Research, 42, 1252-1260. https://doi.org/10.1016/j.cemconres.2012.05.018
[29] Vekilov, P.G. (2010) Nucleation. Crystal Growth & Design, 10, 5007-5019.
https://doi.org/10.1021/cg1011633
[30] Markov, I. (2003) Crystal Growth for Beginners, Fundamentals of Nucleation Crys-tal Growth and Epitaxy. World Scientific Publishing Co. Ltd., Singapore.
https://doi.org/10.1142/5172
[31] Vold, R. and Vold, M. (1983) Colloid and Interface Chemistry. Addison-Wesley, Reading.
DOI: 10.4236/msa.2017.812063 872 Materials Sciences and Applications
The Journal of Physical Chemistry C, 113, 19836-19844.
https://doi.org/10.1021/jp907078u
[33] Bishnoi, S. and Scrivener, K.L. (2009) Studying Nucleation and Growth Kinetics of Alite Hydration Using UIC. Cement and Concrete Research, 39, 849-860.
https://doi.org/10.1016/j.cemconres.2009.07.004
[34] Bentz, D.P. (2006) Modeling the Influence of Limestone Filler on Cement Hydra-tion Using CEMHYD3D. Cement and Concrete Composites, 28, 124-129.
https://doi.org/10.1016/j.cemconcomp.2005.10.006
[35] Thomas, J.J., Biernacki, J.J., Bullard, J.W., Bishnoi, S., Dolado, J.S., Scherer, G.W., et al. (2011) Modeling and Simulation of Cement Hydration Kinetics and Microstruc-ture Development. Cement and Concrete Research, 41, 1257-1278.