Munich Personal RePEc Archive
Working Capital Management, Cash
Flow and SMEs’ Performance
Afrifa, Godfred and Tingbani, Ishmael
Department of Accounting, Finance and Economics, Bournemouth
Univrsity, Department of Accounting, Finance and Economics,
Canterbury Christ Church University
2017
Online at
https://mpra.ub.uni-muenchen.de/82894/
1
Working Capital Management, Cash Flow and SMEs’ Performance
Dr. Godfred Adjapong Afrifa
Senior Lecturer in Accounting and Finance Canterbury Christ Church Universit
North Holmes Road Canterbury
CT1 1QU
Email: godfred.afrifa@canterbury.ac.uk
Tel: 00441227923911
Dr. Ishmael Tingbani
Lecturer in Finance Department of Accounting Finance and Economics
The Business School Bournemouth University
Dorset BH8 8EB
Email: itingban@bournebouth.ac.uk
2
Abstract
Purpose – The paper presents comprehensive evidence on the relationship between
Working Capital Management (WCM) and SMEs’ performance by taking into
consideration the plausible effect of cash flow.
Design/methodology/approach – The paper adopts a panel data regression analysis
on a sample of 802 British quoted small and medium enterprises listed on the
Alternative Investment Market for the period from 2004 to 2013.
Findings – The results of the study demonstrate the importance of cash flow on SMEs’
WCM and performance. According to our findings, WCM has a significantly negative
impact on SME performance. However, with available cash flow, we find a significantly
positive relationship. Additionally, our evidence revels that cash flow constrained
(non-constrained) SMEs are able to enhance their performance through decreased
(increased) investment in WCM.
Practical implications – Overall, the results demonstrate the importance of cash flow
availability on SMEs’ working capital needs. Our findings suggest that in an event of
cash flow unavailability (availability) managers should strive to reduce (increase) the
investment in working capital in order to improve performance.
Originality/value – This current study incorporates the relevance of cash flow in
assessing the association between WCM and firm performance.
3
1 Introduction
Working capital represents an essential component of firms’ performance. Its relevance on
performance has been revisited by recent studies (see Aktas et.al, 2015; Banos-Caballero et
al., 2014; Tauringana and Afrifa, 2013). Working Capital Management (WCM) is important
because of its effects on the firm’s profitability and risk, and consequently its value (Smith,
1980). According to Aktas et al. (2015), efficient WCM translates into superior performance
because it allows firms to redeploy underutilised corporate resources to high-value use.
Firms can minimise risk and increase performance by understanding the importance of
WCM (Nasr and Afza, 2008).
The issue of working capital management has been of concern to managers,
investors and policy makers because of its economic magnitude and impact on firms’
performance. In 2015, the leading 2,000 US and European companies had over US$1.2
trillion of cash unnecessarily tied up in working capital (Ernst & Young, 2016). Also, Aktas et
al. (2015) find that, at the end of 2011, US firms’ total investment in working capital (i.e.,
inventories plus receivables) amounted to $4.2 trillion, which is 24% of their total sales and
above 18% of the book value of their assets. At the same time, almost 40% of this aggregate
working capital has been financed by accounts payable (i.e., supplier credit), leading to an
aggregate investment in net operating working capital (NWC) of $2.5 trillion.
According to existing literature, the nature of the relationship between WCM and
performance depends on the policy that the firm decides to adopt (Garcia-Teruel and
Martinez-Solano, 2007). For example, if the firm adopts an aggressive WCM policy this will
result in a reduction in the investment in working capital by minimising the amount of
inventory and accounts receivable. Minimising the amount invested in stock, ceteris paribus,
4
increase the firm’s profitability. Keeping accounts receivable to a minimum will also increase
performance because the funds not tied up in accounts receivable can be left in the bank
earning interest or invested elsewhere.
On the other hand, if a firm adopts a conservative policy to WCM, which advocates
an increase in investment in working capital, this will stimulate sales by increasing both
inventories and receivables and therefore increase profitability. This is because an increase
in inventories can prevent production disruptions (Garcia-Teruel and Martinez-Solano,
2007), reduce the risk of stock-out (Deloof, 2003), and reduce supply costs and price
fluctuations (Blinder and Maccini, 1991). Also, an increase in accounts receivable can
increase sales because it allows customers time to pay (Long et al., 1993; Deloof and Jegers,
1996), reduces the information asymmetry between buyer and seller, and can be an
inexpensive source of credit for customers (Peterson and Rajan, 1997; Deloof, 2003).
Recent evidence has also highlighted the importance of firms’ financial strength on
the investment in working capital (Banos-Caballero et al., 2014; Afrifa, 2016). Previous
studies based on the seminal work of Modigliani and Miller (1958) have argued that due to
capital market imperfection, the ability of firms to finance their investment in working
capital depends on their financial capabilities such as availability of internal finance, access
to capital market and cost of financing (see Banos-Caballero et al., 2014; Hill et al., 2010).
Greenwald et al. (1984), argue that the availability of cash flow is particularly relevant to
SMEs due to the high cost of raising external capital to finance their investment strategy.
Lack of cash flow holdings can constrain a firm’s investment in working capital (Banos
-Caballero et al., 2014) given that there is a limit to how much inventory it can buy on credit
and also how much trade credit it can seek from suppliers. The availability of cash flow may
5
takes advantage of available discounts of buying in bulk (Banos-Caballero et al., 2014),
which reduces the procurement cost of production and the transactional cost of paying bills
(Ferris, 1981). It follows that firms with limited cash flow should strive to reduce investment
in working capital so as to avoid the need for expensive external finance, while those with
available internal cash flow should increase investment in working capital in order to
increase performance.
Despite the importance of the interrelations between WCM and firm performance
(Aktas et.al. 2015; Banos-Caballero et al., 2014; Tauringana and Afrifa, 2013), little empirical
evidence exists on SMEs and, especially, the possible influence of cash flow. Also, the
existing literature on the relationship between WCM and performance has largely focused
on larger firms (see Banos-Caballero et al., 2014; Deloof, 2003; Hill et al., 2010) with very
limited evidence on SMEs. This paper adds to the existing literature by showing evidence of
the possible effect of cash flow on the relationship between WCM and SMEs performance.
However, research shows that the efficient management of working capital is critical
to SMEs’ performance (Peel and Wilson, 1996; Peel et al., 2000; Banos-Caballero et al.,
2010; Paul and Boden, 2011). Various reasons account for this proposition. Firstly, most
SMEs have a high proportion of both current assets and current liabilities in relation to total
assets and total liabilities. For example, Vanhorne and Wachowicz (2001) estimate that for a
typical manufacturing SME, current assets account for over half of its total assets. Further, a
study by Garcia-Teruel and Martinez-Solano (2007) found that current assets of Spanish
SMEs represent 69% of their total assets, while their current liabilities represent more than
52% of their total liabilities. Secondly, SMEs also rely heavily on current liabilities as an
alternative source of finance due to their inability to obtain external funding from the
6
high proportion of both current assets and current liabilities in relation to total assets and
total liabilities respectively, coupled with the fact that SMEs rely heavily on current liabilities
as an alternative source of finance, highlights the importance of efficient management of
working capital for SMEs.
In this context, the objective of the study is to provide empirical evidence on the
impact of cash flow on the relationship between WCM and performance for a sample of 802
listed SMEs on the Alternative Investment Market (AIM) for the period 2004 to 2013. The
market over the years has grown organically and attracted a large number of small young
firms. WCM’s importance to SME on the AIM can be explained by the legal and financial
characteristics of these firms. SMEs listed on the AIM have less stringent joining
requirements and low standard of standards of conduct compared to those listed in the
main market (London Stock Exchange, 2015). As a result of this lax legal protection, WCM is
seen to be relatively more prevalent and important than bank credit (see Demirguc-Kunt
and Maksimovic, 2002; La Porta et al., 1998). Against this backdrop, any instabilities or
dysfunction of WCM operations is likely to have significant microeconomic consequences on
these firms. Also, the weak legal protection in this market represents weaker creditor
protection, which could lead to a significant cash-flow risk and an adverse effect on SMEs
performance through late or non-payment. These overall factors, suggests the need for an
imperative study on this market.
Similar to previous studies, we use the cash conversion cycle (CCC) as a
comprehensive measure of WCM (Deloof, 2003; Garcia-Teruel and Martinez-Solano, 2007;
Tauringana and Afrifa, 2013). Evidence from the study indicates a negative relationship
between CCC and performance in the absence of cash flow; however, the relationship
7
further show that firms with cash flow below the sample median exhibit a negative
association between CCC and performance, but firms with cash flow above the sample
mean display a positive relationship. Additionally, the paper broadens the scope of the
literature by demonstrating that the association between CCC and firm performance
persists over time.
The study contributes to WCM literature in a number of ways. Firstly, we offer new
evidence of the relationship between WCM and SMEs’ performance by taking into
consideration the plausible effect of cash flow. This study differs from the few studies that
have exclusively examined the relationship between WCM and SMEs’ performance. Deloof
(2003) examines the relationship between WCM and operating performance of Belgian
firms. The author finds a significantly negative relationship between WCM and operating
performance with firms’ fixed effects. Banos-Cabellero et al. (2014), focuses on Spanish
SMEs and documents a concave relationship between net working capital (NWC) and firm
performance. Afrifa et al (2015) describes the relationship between working capital (CCC)
and the profitability of UK SMEs. Evidence from the study reveals an inverse U-shape
relationship between CCC and ROA. In another similar evidence on UK SMEs, Afrifa (2016),
document an inverted U-shaped relationship between net working capital (NWC) and the
profitability (QRATIO). The author argue that there is a trade-off between cost and benefit
of investing in NWC. Unlike Afrifa et al (2015) and Afrifa (2016), our study adopts a linear
model to investigate the relationship between CCC and SMEs performance. We argue that,
there is a linear effect on the relationship between CCC and performance among listed SMEs
on the AIM as evidenced by the results of the Ramsey’s RESET test of linearity which failed
to provide empirical support for a non-monotonic relationship in the data. This can be
8
bargaining power and hence are often compeled to invest in CCC in order survive despite
the associated costs (Cheng and Pike, 2003). Therefore, with the availability of cashflow, the
marginal benefits of investing in CCC often tend to surpass the associated marginal costs
among these SMEs.
Secondly, this paper specifically looks at SMEs that are listed on the stock exchange
in the United Kingdom (UK). This is significant because being listed on the AIM helps to
improve the opportunity of additional finance for a company. This can be achieved at the
time of the flotation or by subsequent share issuance. By law, private companies are not
permitted to solicit for finance through the public. This hinders their ability to obtain finance
for the smooth running of the company. This restriction leaves an SME that is looking to
expand with no choice but to list on a stock exchange in order to secure the needed finance.
Pagano and Roell (1998) argue that firms that do not generate sufficient internal cash flow
will have to be listed on a stock exchange to be able to raise funds to finance growth. SMEs
listed on the AIM also have the advantage of obtaining funds at a low cost (Mendoza, 2011).
Zara (2003) asserts that after a listing on a stock exchange, SMEs increase the average
duration of loans and reduce the size of guarantees. The status as a listed company
increases the credibility of a firm, which improves the number of institutions wanting to do
business with it.
We study a sample of 802 non-financial small and medium enterprises listed on the
Alternative Investment Market for the period from 2004 to 2013. The results indicate a
negative relationship between WCM and performance in the absence of cash flow;
however, the relationship becomes significant and positive after taking cash flow into
9
The structure of our paper is as follows: Section 2 discusses the literature review; the
hypotheses are developed in Section 3; the model and data are discussed in Section 4;
Section 5 discusses the empirical results; and Section 6 presents the summary and
conclusion.
2 Literature Review
2.1 Working capital management and firm performance
The extant literature has demonstrated the importance of firm WCM to performance and
liquidity (Shin and Soenen, 1998). However, the working capital of a firm may be managed
under two different strategies: (1) aggressive strategy; and (2) conservative strategy
(Garcia-Teruel and Martinez-Solano, 2007). The aggressive strategy leads to lower investment in
working capital; whereas the conservative strategy is designed to increase investment in
working capital (Deloof, 2003; Tauringana and Afrifa, 2013).
An aggressive strategy of WCM reduces investment in inventory and accounts
receivable (Deloof, 2003). A reduction in inventory period can improve a firm’s performance
because of the various costs associated with the holding of inventory including warehouse
storage costs, insurance, spoilage, theft etc. Also, a reduction in accounts receivable
investment may increase a firm’s performance because it will increase the cash flow
available to the firm, which can be used to finance the day-to-day operations therefore
preventing the need for expensive external finance (Autukaite and Molay, 2011). The
delaying of payments to suppliers as a result of indulging in an aggressive strategy of WCM
can also improve firm performance.
Alternatively, a conservative strategy can improve a firm’s performance by
10
because of the increase in inventories and trade receivables (Tauringana and Afrifa, 2013).
Investment in inventories can prevent production disruptions, reduce the risk of running out
of inventory, and reduce supply costs and price fluctuations (Blinder and Maccini, 1991;
Deloof, 2003; Garcia-Teruel and Martinez-Solano, 2007). Similarly, investment in accounts
receivable can improve performance because it allows customers time to pay, reduces the
information asymmetry between buyer and seller, serves as a product differentiation
strategy, strengthens the supplier/customer long-term relationship, serves as an effective
price cut, reduces transaction costs and entices customers to acquire merchandise at times
of low demand (Nadiri, 1969; Ferris, 1981; Emery, 1987; Smith, 1987; Brennan et al., 1988;
Shipley and Davis, 1991; Long et al., 1993; Deloof and Jegers, 1996; Wilner, 2000).
2.2 Cash flow, working capital management and performance
The amount of cash retained by companies shows its importance to firms’ performance.
According to Guney et al. (2003), 10.3% of British firms’ total assets is in the form of cash.
The availability of cash flow will have an influence on the relationship between WCM and
the performance of companies. Previous studies have postulated that cash flow availability
leads to higher investment in working capital (Hill et al., 2010). The availability of cash flow
may lead to an increase in the investment of inventory, which will increase the overall CCC
of a company. A company with available cash flow may take advantage and make a bulk
purchase. Buying in bulk may reduce the procurement cost of production. The bulk
purchase cost savings will also result in a decrease in the cost of sales of the product, which
will reduce the overall price of the product leading to higher performance. These cost
savings of bulk purchase may arise for many reasons. A company that buys in bulk will enjoy
11
of transportation, because instead of undertaking two or three trips a company will make
only one trip. In addition, the company will make savings on the fixed costs of ordering,
including placing and processing orders or setting up costs.
An increase in inventory investment will help to avoid the prospect of a stock-out
situation (Tauringana and Afrifa, 2013), as this will have a catastrophic effect on a
company’s performance because a company without stock may lose its goodwill
(Bhattacharya, 2008). The lack of inventory will drive both current and potential customers
away to competitors. This will not only affect the current performance of the company but
also the future performance, as it might affect the good name of the company.
The availability of cash flow may also lead to an increase in accounts receivable
investment. A company with available cash flow may be in a better position to offer
generous credit to customers. An increase in the investment of accounts receivable may
lead to higher performance. This is because companies offer trade credit to allow customers
the necessary time to be able to verify the extent of the quality of the product (Smith, 1987;
Long et al., 1993; Danielson and Scott, 2000). Buyers, especially newer ones, do not have
knowledge about the product quality. Product guarantee is particularly important to sellers
as it will help to facilitate future purchases (Bastos and Pindado, 2007) and to reduce the
confusion over the product by allowing the customer to be satisfied with the product before
payment is made, thus avoiding future contentions.
The availability of cash flow may also increase the investment in working capital by
reducing the accounts payable period. A company with enough cash flow may take
advantage of suppliers’ cash discount by paying immediately for supplies (Banos-Caballero
et al., 2010). As maintained by Ng et al. (1999) the amount of cash discount offered by
12
inherent cost to a company, which diminishes performance. Research by Ng et al. (1999)
indicates that the combination of the 2% discount for payment within 10 days of supplies
and a net period ending after 30 defines an implicit interest rate of 43.9%. Therefore the
high inherent cost involved in a credit period will cause a reduction in performance. This
means that the availability of cash flow may help companies to improve their performance
by paying for supplies on time.
3 Hypotheses Development
A shorter CCC may improve SMEs’ performance because it will reduce or avoid the
over-reliance on external finance. In this case, the company may be financing part of its current
assets with suppliers’ credit, thereby avoiding the need for a short-term loan, which can be
expensive to SMEs in particular. Another performance enhancement benefit of a shorter
CCC is the fewer financial resources of SMEs (Nobanee, 2009).
Owing to the lack of access to the capital markets, SMEs may improve performance
by relying on suppliers’ credit. A shorter CCC may also maximise performance because it
indicates the efficiency of using working capital. An efficient use of working capital means
that the company is able quickly to convert inventory into sales and at the same time is fast
in collecting receivables, but slow in paying suppliers. For example, Nobanee (2009)
maintains that the efficiency of WCM is based on the principle of speeding up cash
collections as quickly as possible and slowing down cash disbursements as slowly as
possible. Mathuva (2010) postulates a negative association between CCC and performance
and therefore argues that minimising the investment in current assets can help in boosting
performance. The negative association between CCC and the performance of companies is
13
and Martinez-Solano, 2007). Given the lack of financial resources and access to capital
markets of SMEs, the reduction in working capital will enhance their performance.
Therefore, we hypothesize the following:
Hypothesis 1: A negative relationship exists between CCC and performance
Cash flow is important to companies because it allows them to pay bills on time. The
availability of cash flow may improve SMEs’ performance by reducing the transaction costs
of raising funds (All-Najjar and Belghitar, 2011). The benefits of cash flow to performance
are particularly high for SMEs because their transaction costs are relatively higher as
compared to those of larger firms, which benefit from economies of scale (Faulkender,
2002). Cash flow also serves as a buffer against unexpected events (Opler et al., 1999). As
argued by Gill and Shah (2012), cash flow availability helps companies to pay off their
obligations on time even even during the bad times. Cash flow can also help companies to
avoid the likelihood of financial distress, especially for those companies with more volatile
cash flows (Ferreira and Vilela, 2004). Belghitar and Khan (2013) indicate that market
imperfections, such as financial distress, are more severe for SMEs. This logic leads to the
following hypothesis:
Hypothesis 2: There is a positive association between cash flow and performance
Some previous studies in WCM have suggested a negative association between CCC
and performance in both SMEs and larger firms, arguing that investment in CCC may require
the need to seek expensive external finance (Banos-Caballero et al., 2014). However, the
evidence suggests that firms with available cash flow benefit from the investment in
working capital (Padachi, 2006; Hill et al., 2010; Dong and Su, 2010; Banos-Caballero et al.,
14
relationship between CCC and performance of SMEs (Afrifa, 2016). SMEs with available cash
flow may be able to take advantage of the various benefits of longer CCCC, which can
improve their performance by increasing sales (Deloof, 2003). SMEs with cash flow can
entice customers to purchase to purchase a greater amount (Emery, 1987) by extending
more generous trade credit terms. Cash flow availability may allow SMEs to increase
inventory in stock, which will mean that customers will always have what they want (Schiff
and Lieber, 1974). This may lead to higher sales, which will in turn improve performance.
The availability of cash flow can also improve SMEs’ performance by allowing them to make
an up-front payment to suppliers (Deloof, 2003) because of the discount usually offered by
suppliers for immediate payment (Ng et al., 1999; Wilner, 2000).
Hypothesis 3: cash flow availability leads to a positive association between CCC and
performance
4 Model and Data
4.1 Data: sample selection, sources, and description
The sample for the study is drawn from all 1,316 firms listed on the AIM as at 27th August
2014. Financial firms such as banks and insurance were excluded because they have
different accounting requirements (e.g. Deloof, 2003; Hill et al., 2010). Moreover, firm-years
with anomalies in their accounts such as negative values in assets, sales, current assets and
fixed assets were removed (see, Hill et al., 2010). Finally, all variables were winsorized at 1%
(see, Garcia-Teruel and Martinez-Solano, 2007; Hill et al., 2010). The final sample of SMEs,
which is based on the requirements established by the European Commission’s
recommendation 2003/361/CE of 6th May 2003 on the definition of SMEs, therefore consists
15
firm-year observations. Specifically, the following criteria are used for the selection of
SMEs1:
Fewer than 250 employees;
Turnover less than €50 million; and
Possession of less than €43 million of total assets.
By allowing for both entry and exit, the use of an unbalanced panel partially
mitigates potential selection and survivor bias. The sample is collected from the AIM
because it is one of the few stock exchanges around the world established purposely for
SMEs (Mendoza, 2011) and is by far the most successful second tier market (Colombelli,
2010).
These criteria were set for many reasons. Firstly, this allows for easy comparability
with similar studies. Secondly, to permit the use of unbalanced panel data, which has the
advantage, as argued by Gujarati (2003), of more degrees of freedom and less
multicollinearity among variables. Two separate sets of data were employed to establish the
association between WCM and SMEs performance. The first set of information concerns
financial data involving both accounting figures and ratios. These data were extracted from
the Analyse Major Databases from European Sources (AMEDEUS). Thirdly, in order to
ascertain the ages of firms, the dates of incorporation of all the sampled firms were
extracted from the database of the UK Companies House.
3.2 Variable definitions
1
16
The main dependent variable to be analyzed is Tobin’s q ratio (QRATIO). The QRATIO has
been used extensively in the literature to assess listed firm’s performance (Afrifa, 2016). In
this paper, we employ both the 1-year QRATIO and the 3-year QRATIO. The 3-year QRATIO
horizon is employed to assess whether the performance of WCM persists through time. We
adopt QRATIO as the main measure of performance for two reasons: First, it captures
reputational value effect of SMEs WCM capabilities resulting from stakeholder involvement
on performance. Ntim (2009) argue that market-based performance measure is best suited
for listed firms due to its sensitivity to industry effects as in the case of this study. SMEs
WCM is likely to influence QRATIO due to its effect on investments and financing choices of
firms (Kieschnick, Laplante, and Moussawi, 2013; Ek and Guerin, 2011). Second, compared
to other accounting measures QRATIO, has more desirable distributional properties and is
less affected by accounting anomalies due to tax laws and accounting conventions
(McGahan 1999, Wernerfelt and Montgomery 1988).
The main variable of interest is the CCC, which is a comprehensive measure of a
firm’s WCM efficiency and effectiveness. This definition of CCC measures the average
number of days it takes a firm to recoup the amount invested in current assets, which is
different from the definition adopted by studies including Hill et al. (2010) and Afrifa (2016)
that measures the amount of money invested in current assets2. Following Afrifa and
Tauringana (2013), Deloof (2003), Garcia-Teruel and Martinez-Solano (2007), it is defined as:
2 They measured working capital as the ratio of accounts receivables plus inventory minus account
17
As the goal of this paper is to measure the QRATIO implications attributable to a firm’s
WCM, all regressions include control variables to account for other changes in financial
characteristics. These control variables include: sales growth, which is defined as the annual
sales growth (Sales – Salest−1)/Salest−1 (Baños-Caballero, et al., 2014); firm age, which is
defined as the number of years between incorporation and the calendar year end of each
firm (Afrifa et al., 2016); firm size, which is defined as the log of the total assets (Ferrando
and Mulier, 2013); tangible fixed assets, which is defined as the fixed assets as a percentage
of total assets (Afrifa, 2013); financial leverage, which is defined as the total debt as a
percentage of total assets (Aktas et al., 2015); and finally, in order to incorporate the effect
of business cycles on the relationship between WCM and SMEs’ performance, the dummy
variable CRISIS is used. The variable CRISIS distinguishes between boom and recession
periods, which take the value one for the years 2007 to 2009, otherwise zero3.
The firms in our sample belong to 21 different industries, according to the NACE 2
industry classification system4. The empirical studies suggest that WCM issues are
industry-specific (Hill et al., 2010) and that WCM affects performance differently for firms in different
industries (Afrifa, 2016). Therefore, we include industry in all the regressions.
4.2 Regression model specification
The choice of an the appropriate regression in working capital manangement studies is
somehow ambiguous. Studies including Afrifa (2016), Banos-Cabellero et al. (2014) have
used the non-linear regression, whereas studies by Afrifa et al. 2015), Garcia-Teruel et al.
(2007), Tauringana and Afrifa (2013) have also used the linear regression. This therefore
3
Similar results are quantitatively obtained when 2007-2010 is considered to be the crisis period
4
18
calls for a test of the appropriate regression model to use. This paper therefore uses the
Ramsey’s RESET test in a bid to select the appropriate regression model. According to the
results of the Ramsey’s RESET test displayed in Tables 5 to 8, the null hypothesis of linear
parameters cannot be rejected. Therefore, it is assumed in the paper that the data is linear
in parameters. The following linear regression analysis model is therefore specified to
examine the relationship between WCM and performance of AIM-listed SME firms, similar
to Dezso and Rose (2012). In equations 1-3, all right-hand side variables are lagged by one
period in order to alleviate the concern that CCC and firm QRATIO may be simultaneously
determined in equilibrium (Renders et al., 2010).
QRATOit= β0+ β1CCCi,t-1+ β2GROWTHi,t-1+ β3AGEi,t-1+ β4SIZEi,t-1
+ Β5ATANi,t-1 + β6LEVi,t-1 +εi,t-1 (1)
QRATOit= β0+ β1CCCi,t-1+ β2CFLOWi,t-1 + β3GROWTHi,t-1 + β4AGEi,t-1
+ β5SIZEi,t-1+ β6ATANi,t-1 + β7LEVi,t-1 + εi,t-1 (2)
QRATIOit= β0+ β1CCCi,t-1+ β2CFLOWi,t-1+ β3CCC*CFLOWi,t-1 + Β4GROWTHi,t-1
+ β5AGEi,t-1 + β6SIZEi,t-1+ β7ATANi,t-1+ β8LEVi,t-1 +εi,t-1 (3)
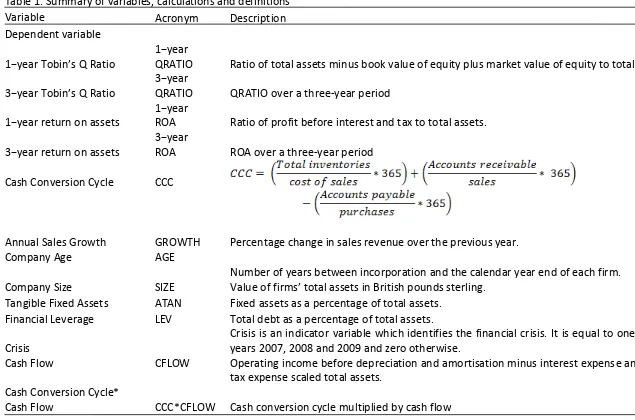
We define all the variables in Table 1 below.
[Table 1 about here]
The dependent variable QRATIO represents two measurements, namely 1-year
QRATIO and 3-year QRATIO. The subscript i denotes the nth firm (ί = 1,...6,424) and the
subscript t denotes the nth year (t=1,...10). εit is the error term.
Since panel data regression is used, the Hausman test is utilised to decide whether to
employ the Fixed Effect (FE) model or Random Effect (RE) model by first determining
whether there is a correlation between the unobservable heterogeneity (µi) of each firm
and the explanatory variables of the model. The Hausman test was performed, which
19
regressors. This finding means that the RE is significantly different from the FE, and
therefore the FE is the more consistent and efficient method to use. For this reason, all the
regressions are run using the FE regression.
5 Empirical Evidence
5.1 Descriptive statistics
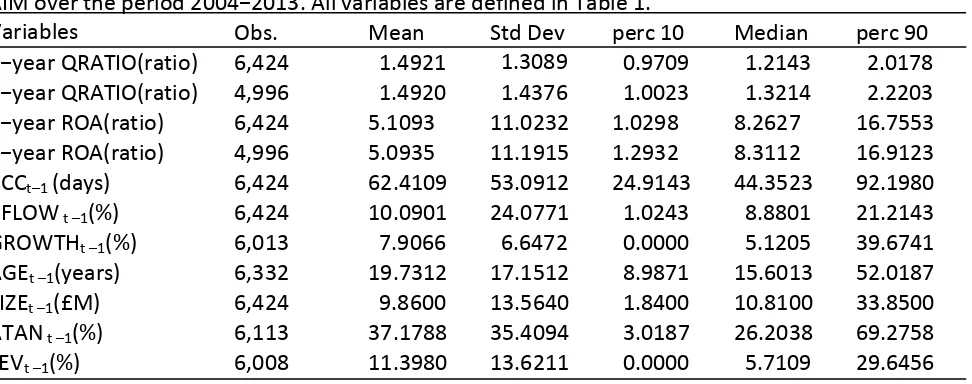
Table 2 reports descriptive statistics of the variables included in our regression analyses.
1-year QRATIO has a mean of 1.4921 and a median of 1.2143. The mean and median 3-1-year
QRATIO are 1.4920 and 1.3214, respectively. The CCC has a mean of 62.4109 days and a
median of 44.3523 days. The mean of 62.4109 days indicates that AIM-listed SMEs are slow
both in converting inventory into sales and in collecting monies owed by customers, but that
they pay their suppliers faster. In order words, it takes an average of about two months’
time between the outflow of cash and the inflow of cash. Mathuva (2010) reported a similar
CCC duration of 69.35 days when he investigated the influence of WCM components on the
corporate performance of Kenyan-listed firms. Cash flow has a mean of 10.0901% and a
median of 8.8801%. The average GROWTH is 7.9066% with a median of 5.1205%. The
sampled companies’ average age is 19.7312 years with a median of 15.6013 years. An
average age of approximately 20 years indicates that the firms in the sample are
consolidated in the market. Mean and median SIZEs are approximately £10m and £11m,
respectively. The average size of £10m suggests that the majority of the companies fall
under the small-size category of companies (see, Garcia-Teruel and Martinez-Solano, 2010).
For asset tangibility, its mean is 37.1788% with a median of 26.2038%. The average financial
leverage of the sampled companies is 11.3980% and a median of 5.7109%,which explains
20
[Table 2 about here]
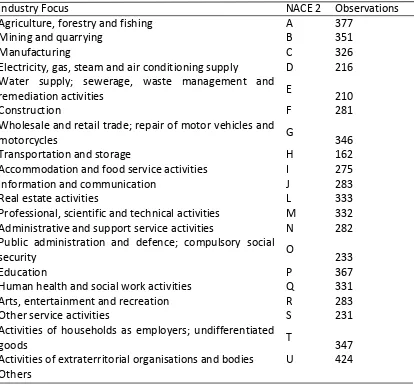
Table 3 presents firm-year observations across all 21 non-financial industries
according to the European Community statistical classification system5 (see, Tykvova and
Borell 2012). The industry with the highest observations is activities of extraterritorial
organisations and bodies (424), while transport and storage has the lowest firm-year
observations (162). Overall, the sample is fairly representative of all 21 industries.
[Table 3 about here]
5.2 Correlation analysis
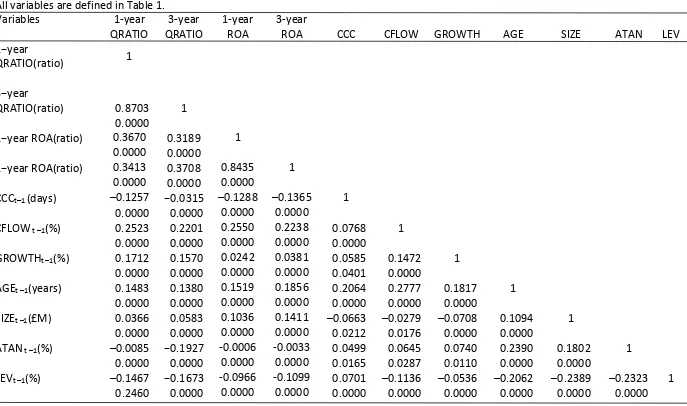
Table 4 contains the correlation matrix for the variables included to test for
multicollinearity. The correlation result in Table 4 indicates a significant and negative
association between 1-year and 3-year QRATIO and CCC at the 1% level. The correlations of
annual sales growth with 1-year and 3-year QRATIO are positive and significantly correlated
at the 1% level. The correlation between 1-year and 3-year QRATIO and cash flow are
positive and significant at the 1% level. Finally, the correlations among the independent
variables suggest that multicollinearity should not be a problem in the panel data regression
analysis since the coefficient values are well below the 0.80 limit prescribed by Field (2005).
[Table 4 about here]
5.3 1-year QRATIO and CCC specification
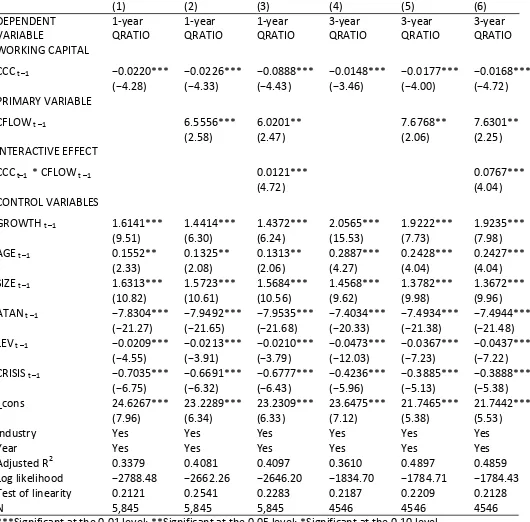
Model 1 in Table 5 presents the results for hypothesis 1. The model has an R2 of 34%. CCC is
found to be negative and significantly related to 1-year QRATIO at the 1% level, which
supports the hypothesis developed. The results show that minimising the investment in
21
working capital will result in higher performance for AIM-listed SMEs (Banos-Caballero et al.,
2013). This outcome can be explained by the fact that investment in working capital
requires financing, which can be extremely expensive (Autukaite and Molay, 2011). These
results support the findings by Ganessan (2007), Garcia-Teruel and Martinez-Solano (2007),
Wang (2002) and Autukaite and Molay (2011) that reducing the requirement in working
capital leads to less need for external financing and less cost of capital, which increases
performance. In the case of SMEs, this result makes sense given their severe lack of financial
resources (Storey, 2004; Nobanee, 2009).
For the control variables, the association between annual sales growth and 1-year
QRATIO is positive at the 1% level of significance. Company age has a direct and significant
effect on performance at the 5% level. Company size is positive and significantly associated
with 1-year QRATIO at the 1% level. Asset tangibility has a negative and significant
relationship with 1-year QRATIO at the 1% level. Finally, financial leverage and crisis have
negative coefficients with the 1-year QRATIO at the 1% apiece.
[Table 5 about here]
Model 2 presents the results for hypothesis 2 with the inclusion of the cash flow,
which shows an R2 of 41%. As we expected based on the theory, available cash flow has a
strongly positive relationship with 1-year QRATIO at the 1% level. Thus, hypothesis 2 is
supported. This result underscores the importance of cash flow to firm performance (Opler
et al., 1999; Saddour, 2006), because of its ability to reduce the cost of raising external
funds (All-Najjar and Belghitar, 2011), to buffer against unexpected events (Opler et al.,
1999), to avoid the likelihood of financial distress (Ferreira and Vilela, 2004) and to
22
To test hypothesis 3, the interaction of CCC and cash flow is included in model 3,
which shows an R2 of 41%. The result indicates that the availability of cash flow turns the
association between CCC and 1-year QRATIO to become positive and significant at the 1%
level. Thus, hypothesis 3 is supported. The positive and significant association between the
interaction of CCC and cash flow with QRATIO (0.0121) supports the empirical evidence,
which suggests that firms with available cash flow can enhance performance by making a
higher investment in working capital (Hill et al., 2010; Banos-Caballero et al., 2013). For
example, research by Padachi (2006) and Dong and SU (2010) suggest that firms can benefit
enormously from investment in working capital. This result shows that whilst a lack of cash
flow will require firms to minimise investment in working capital (Autukaite and Molay,
2011), because of lack of finance in general and the expensive cost of financing in particular,
the availability of cash flow should influence firms to increase investment in working capital
(Fazzari and Petersen, 1993). This is because internal cash flow is cheaper than external
financing (Myers and Majluf, 1984). The availability of cash flow can help firms to improve
performance by extending more credit to customers (Deloof, 2003), increasing inventory in
stock (Schiff and Lieber, 1974) and paying upfront to enjoy cash discount (Ng et al., 1999;
Wilner, 2000). In summary, the results show that SMEs with cash availability exhibit the
conservative strategy of WCM, whereas SMEs with lack of cash availability follow the
aggressive strategy of WCM.
In order to determine the effectiveness of the three models, the log likelihood was
calculated for each model; model 1 with CCC only; model 2 with CCC and cash flow; and
model 3 with CCC, cash flow and the interaction of CCC and cash flow. The results are
23
that the best model was the complete model 3. The log likelihood increases from −2788.48
in model 1 to −2662.26 in model 2 and finally to −2646.20 in model 3.
5.4 3-year QRATIO and CCC specification
To assess whether the effect of CCC on firm performance persists through time, the QRATIO
over a 3-year horizon is also considered, which reduces the observation by 1,299. The
results using the 3-year horizon as the dependent variable appear in models 4 to 6 of Table
5. Overall, the results are consistent with the earlier results displayed in models 1 to 3 of
Table 5 in that CCC is negative. Moreover, the effect of the interaction between CCC and
cash flow with 3-year QRATIO is significantly positive at the 1% level. Finally, the results of
the other control variables displayed in models 4 to 6 generally echo those found in models
1 to 3.
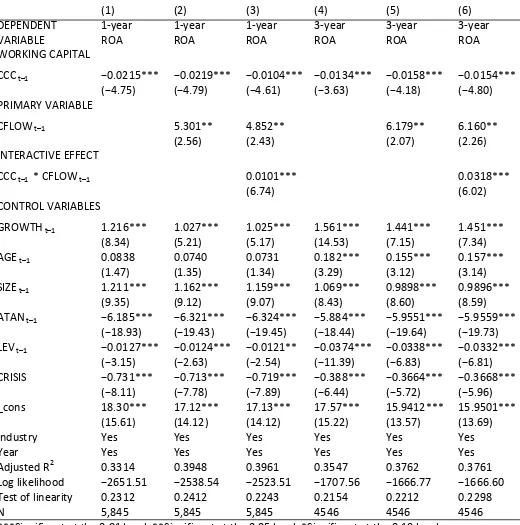
5.5 Alternative measure of firm performance - return on assets
Here, we employ the return on assets (ROA) as a measure of SMEs performance to test the
sensitivity of our main results to the alternative performance measure. ROA is defined as
the profit before interest and tax divided by its total assets at the end of the financial year
(Afrifa et al., 2015). The results of using ROA as the dependent variable are contained in
Table 6. Once again, the same econometric approach and the same set of control variable
are used as those presented in Table 5.
For both the 1-year and 3-year ROA as dependent variables in colums 1-6, the
coefficient of the CCC is negative at the 1% level of significance. In terms of the interaction
24
regardless of whether the 1-year or the 3-year ROA is used as dependent variable, the cash
flow availability leads to a higher ROA from an increase in the cash conversion cycle.
[Table 6 about here]
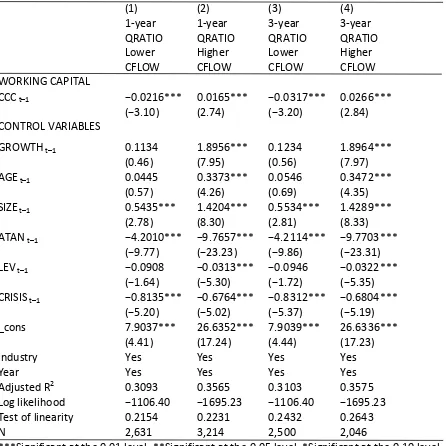
5.5 Robustness test
Following the work of Banos-Caballero et al. (2014) and also to check the robustness of the
results, the sample is divided into two based on the median of cash flow. Firms with cash
flow above the sample median are assumed to be less likely to lack cash flow, while firms
with cash flow below the sample median are assumed to suffer from a lack of cash flow
(Banos-Caballero et al., 2014). Therefore, it is predicted that a cash flow above the sample
median will lead to a positive association between CCC and performance, whilst a cash flow
below the sample median will lead to a negative relationship between CCC and
performance.
Model 1 of Table 7 contains the results of firms with cash flow below the sample
median with an R2 of 31%. The results show that CCC is negative and significantly related to
performance at the 1% level. This indicates the robustness of the results obtained above
and confirms that firms with lower cash flow should endeavour to reduce their level of
investment in working capital (Autukaite and Molay, 2011). Model 2 of Table 7 also contains
the results of firms with cash flow above the sample median with an R2 of 36%. These show
a significantly positive association between CCC and performance. This finding confirms the
results obtained above and indicates that firms with higher cash flow should increase
investment in working capital, which will lead to higher performance (Hill et al., 2010).
As before, the results in models 3 and 4 of Table 7 echo the findings in models 1 and
25
significance level. Also, the results in model 4 indicate a significantly positive association
between CCC and 3-year QRATIO at the 1% level.
[Table 7 about here]
The results presented in Table 8 by using the 1-year ROA as the dependent variable in
columns 1-2 and the 3-year ROA in columns 3-4 also shows qualitatively similar results on
the association between low cash flow and high cash flow with ROA. Similar to the results
presented in Table 7, the relationship between both the 1-year and 3-year ROA with CCC is
negative for SMEs with lower cash flow but positive and significant at the 1% level for SMEs
with higher cash flow.
[Table 8 about here]
6 Conclusion
The paper presents comprehensive evidence on the relationship between WCM and SMEs’
performance by taking into consideration the plausible effect of cash flow. Despite the
widespread evidence on the relevance of WCM on firm performance, little empirical
evidence exists on SMEs and, especially, the possible influence of cash flow. The existing
literature on the relationship between WCM and performance has largely focused on larger
firms with limited evidence on SMEs. We employ panel data regression analysis on a sample
of 802 non-financial small and medium enterprises listed on the AIM for the period from
2004 to 2013 to estimate this relationship.
Evidence from the study reveals the importance of cash flow on SMEs’ WCM and
performance. The results show that CCC relationship to performance is negative; however,
after taken into consideration the moderating effect of the availability of cash flow, the
26
related to firms’ performance. The results from separating the total sample according to the
median cash flow further prove the importance of cash flow to the relationship between
WCM and performance. The relationship between CCC and performance for firms with cash
flow below the sample median is significant and negative. On the other hand, the
association between CCC and performance for firms with cash flow above the sample
median is significant and positive. Finally, the results are also robust after employing a
3-year QRATIO and employing the ROA as an alternative measure of SME performance.
Our findings suggest that managers should be concerned about the economic
implications of the cash flow availability on investment in working capital. In the event of
cash flow unavailability managers should strive to reduce the investment in working capital
in order to improve performance. Thus, our study broadens the scope of the literature by
demonstrating that the association between WCM and SMEs’ performance depends on the
financial strength of firms and suggests future studies to control for this in future research.
References
Afeef, M. (2011). Analyzing the Impact of Working Capital Management on the Profitability of SMEs in Pakistan. International Journal of Business and Social Science, 2(22), 175 – 183.
Afrifa, G. A. (2013). Working capital management and AIM listed SME companies’
profitability: a mixed research method approach PhD. dissertation. Bournemouth: Bournemouth University.
Afrifa, G. A. (2016), Net working capital, cash flow and performance of UK SMEs. Review of Accounting and Finance,15 (1) pp. 21 – 44.
Afrifa, G., Tauringana, V. and Tingbani, I., (2015). Working capital management and performance of listed SMEs. Journal of Small Business & Entrepreneurship, 27 (6). Aktas, N., Croci, E. and Petmezas, D. (2015). Is working capital management
value-enhancing? Evidence from firm performance and investments. Journal of Corporate Finance, 30, 98-113.
27
Autukaite, R., & Molay, E. (2011). Cash holdings, working capital and firm value: Evidence from France. Paper presented at the International Conference of the French Finance Association (AFFI), May.
Baños-Caballero, S., García-Teruel, P. J., & Martínez-Solano, P. (2010). Working capital management in SMEs. Accounting & Finance, 50(3), 511-527. doi:10.1111/j.1467-629X.2009.00331.x
Baños-Caballero, S., García-Teruel, P. J., & Martínez-Solano, P. (2014). Working capital management, corporate performance, and financial constraints. Journal of Business Research, 67(3), 332-338. doi:http://dx.doi.org/10.1016/j.jbusres.2013.01.016
Bastos, R., & Pindado, J. (2007). An agency model to explain trade credit policy and empirical evidence. Applied Economics, 39(20), 2631-2642. doi:10.1080/00036840600722232 Belghitar, Y., & Khan, J. (2013). Governance mechanisms, investment opportunity set and
SMEs cash holdings. Small Business Economics, 40(1), 59-72. doi:10.1007/s11187-011-9366-z
Bhattacharya, H. (Ed.) (2008). (2008), Theories of trade credit: limitations and applications. Calcutta: Prentice-Hall.
Blinder, A. S., & Maccini, L. J. (1991). The Resurgence of Inventory Research: What Have We Learned? Journal of Economic Surveys, 5(4), 291-328.
doi:10.1111/j.1467-6419.1991.tb00138.x
Brennan, M. J., Maksimovics, V., & Zechner, J. (1988). Vendor Financing. The Journal of Finance, 43(5), 1127-1141. doi:10.1111/j.1540-6261.1988.tb03960.x
cash holdings. EFMA Helsinki meetings.
Cheng, N. S., & Pike, R. (2003). The trade credit decision: evidence of UK firms. Managerial and Decision Economics, 24(6-7), 419-438. doi: 10.1002/mde.1049
Colombelli, A. (2010). Alternative investment market: a way to promote entrepreneurship. Danielson, M., & Scott, J. (2000). Additional Evidence on the Use of Trade Credit by Small
Firms: The Role of Trade Credit Discounts. Working Paper, SSRN Electronic Library. Deloof, M. (2003). Does Working Capital Management Affect Profitability of Belgian Firms?
Journal of Business Finance & Accounting, 30(3-4), 573-588. doi:10.1111/1468-5957.00008.
Deloof, M., & Jegers, M. (1996). Trade Credit, Product Quality, and Intragroup Trade: Some European Evidence. Financial Management, 25(3), 33-43. doi:10.2307/3665806. Demirguc-Kunt, A., and Maksimovic, V. (2002). Firms as financial intermediaries: evi- dence
from trade credit data, working paper (World Bank).
Dezsö, C.L. and Ross, D.G. (2012). Does Female Representation in Top Management Improve Firm Performance? A Panel Data Investigation. Strategic Management Journal, 33(9), 1072-1089.
Dong, H. P., & Su, J. (2010). The relationship between working capital management and profitability: a Vietnam case. International Research Journal of Finance and Economics, 49, 62-71.
Ek, R., and Stephen G., (2011). Is there a right level of working capital? Journal of Corporate Treasury Management 4, 137-149.
Emery, G. W. (1987). An Optimal Financial Response to Variable Demand. The Journal of Financial and Quantitative Analysis, 22(2), 209-225. doi:10.2307/2330713. Ernst & Young (2016). All tied up Working capital management report.
28
Faulkender, M. (2002). Cash holdings among small business. Working Paper (Kellogg School of Management, Northwestern University).
Fazzari, S., & Petersen, B. (1993). Working Capital and Fixed Investment: New Evidence on Financing Constrains. RAND Journal of Economics, 24, 328-342.
Fazzari, S., Hubbard, R. G., & Petersen, B. (1988). Financing Constraints and Corporate Investment. Brookings Papers on Economic Activity, 1, 141-195.
Field A (2005) Discovering statistics using SPSS. Second ed. London: Sage Publications Ltd Ferrando A, Mulier K. 2013. Do firms use the Credit Channel of Trade to finance growth?
Journal of Banking and Finance, 37 (2013), pp. 3035-3046.
Ferreira, M. A., & Vilela, A. S. (2004). Why Do Firms Hold Cash? Evidence from EMU Countries. European Financial Management, 10(2), 295-319. doi:10.1111/j.1354-7798.2004.00251.x
Ferris J S. 1981. A transactions theory of trade credit use, Quarterly Journal of Economics 96, 243–270
Ganesan, V. (2007). An analysis of working capital management efficiency in
telecommunication equipment industry. River Academic Journal, 3(2), 1-10.
García‐Teruel, P. J., & Martínez‐Solano, P. (2007). Effects of working capital management on SME profitability. International Journal of Managerial Finance, 3(2), 164-177.
doi:10.1108/17439130710738718
Gill, A., & Shah, C. (2012). Determinants of corporate cash holdings: Evidence from Canada.
International Journal of Economics and Finance, 4(1), 70-79.
Greenwald, B., Stiglitz, J. E. and Weiss, A. (1984). Informational Imperfections in the Capital Gujarati, D. N. (2003). Basic Econometrics (fourth edition ed.). McGraw-Hill: New York. Guney, Y., Ozkan, A. and Ozkan, N. (2003). Additional international evidence on corporate Hill, M. D., Kelly, G. W., & Highfield, M. J. (2010). Net Operating Working Capital Behavior: A
First Look. Financial Management, 39(2), 783-805. doi:10.1111/j.1755-053X.2010.01092.x
Journal of Industry, Competition and Trade, 10(3–4), 253–274.
Kieschnick R., Laplante M. and Moussawi R. (2013). Working capital management and shareholders' wealth. Review of Finance. 17(5), 1827-1852.
La Porta, R., Lopez-de-Silanes, F., Shleifer, A. & Vishny, R. (1998). Law and finance, Journal of Political Economy 106, 1113–1155.
Lazaridis, I., & Tryfonidis, D. Relationship between working capital management and profitability of listed companies in the Athens stock exchange. Journal of Financial Management and Analysis, 191, 26-35.
London Stock Exchange, (2015). A guide to AIM. White Page Ltd. http://www.londonstockexchange.com/companies-and-advisors/aim/publications/documents/a-guide-to-aim.pdf
Long, M., Malitz, I., & Ravid, S. (1993). Trade Credit, Quality Guarantees and Product Marketability. Financial Magement, 22(4), 117-127.
Mathuva, D. (2010). The influence of working capital management components on
corporate profitability: a survey on Kenyan listed firms. Research Journal of Business Management, 41, 1-11.
McGahan, A.M., (1999). The performance of U.S. corporations: 1981–1994. Journal of Industrial Economics 47, 373–398.
29
Mendoza, J. M. (2011). Securities Regulation in Low-Tier Listing Venues: The Rise of the Alternative Investment Market. Fordham Journal of Corporate & Financial Law, 3(2), 257–328.
Modigliani, F., & Merton, H. M. (1958). The Cost of Capital, Corporation Finance and the Theory of Investment. The American Economic Review, 48(3), 261-297.
Myers, S. C., & Majluf, N. S. (1984). Corporate financing and investment decisions when firms have information that investors do not have. Journal of Financial Economics, 13(2), 187-221. doi:http://dx.doi.org/10.1016/0304-405X(84)90023-0
Ntim, C. G. (2009). Internal corporate governance and firm financial performance: evidence from South African listed firms. PhD thesis, University of Glasgow.
Nazir, M. S. and Afza, T., 2008. Working Capital Requirements and the Determining Factors in Pakistan. IUP Journal of Applied Finance, 15(4), 28-38.
Ng, C. K., Smith, J. K., & Smith, R. L. (1999). Evidence on the Determinants of Credit Terms Used in Interfirm Trade. The Journal of Finance, 54(3), 1109-1129. doi:10.1111/0022-1082.00138
Nobanee, H., & Al Hajjar, M. (2009). Working Capital Management and Firm's Profitability: An Optimal Cash Conversion Cycle. Retrieved from
http://ssrn.com/abstract=2128662.
Opler, T., Pinkowitz, L., Stulz, R., & Williamson, R. (1999). The determinants and implications of corporate cash holdings. Journal of Financial Economics, 52(1), 3-46.
doi:http://dx.doi.org/10.1016/S0304-405X(99)00003-3
Padachi, K. (2006). Trends in working capital management and its impact on firms performance: an analysis of Mauritian small manufacturing firms. International Review of Business Research Papers, 22, 45-58.
Pagano M & Röell, A. (1998). The Choice of Stock Ownership Structure: Agency Costs, Monitoring, and the Decision to Go Public. Oxford Journals Social Sciences Quarterly Journal of Economics, 113(1), 187-225.
Paul, S.Y. and Boden, R. (2011). Size Matters: the Late Payment Problem. Journal of Small Business and Enterprise Development, 18 (4): 732–47.
Peel, M. J., & Wilson, N. (1996). Working Capital and Financial Management Practices in the Small Firm Sector. International Small Business Journal, 14(2), 52-68.
Peel, M. J., Wilson, N., & Howorth, C. (2000). Late Payment and Credit Management in the Small Firm Sector: Some Empirical Evidence. International Small Business Journal, 18(2), 17-37.
Petersen, M. A., & Rajan, R. G. (1997). Trade credit: theories and evidence. Review of Financial Studies, 10(3), 661-691.
Renders A, Gaeremynck A, Sercu P (2010). Corporate-governance ratings and company performance: a cross-European study. Corp Gov: Int Rev 18:87–106
Saddour, K. (2006). The determinants and the value of cash holdings: Evidence from French firms. CEREG, 1-33.
Schiff, M., & Lieber, Z. (1974). A Model For The Integration of Credit And Inventory Management. The Journal of Finance, 29(1), 133-140. doi:10.1111/j.1540-6261.1974.tb00029.x
Shin, H., & Soenen, L. (1988). Efficiency of working capital and corporate profitability.
Financial Practice and Education, 8(2), 37-45.
30
Smith, J. K. (1987). Trade Credit and Informational Asymmetry. The Journal of Finance, 42(4), 863-872. doi:10.1111/j.1540-6261.1987.tb03916.x
Storey, D.J. (2004). Exploring the link, among, small firms, between management training and firm performance: a comparison between the UK and other OECD countries,
International Journal of Human Resource Management, 15(1), pp. 112-30. Tauringana, V., & Afrifa, G. A. (2013). The relative importance of working capital
management and its components to SMEs' profitability. Journal of Small Business and Enterprise Development, 20(3), 453-469. doi:10.1108/JSBED-12-2011-0029 Tykvova , T. & Borell, M. (2012). Do private equity owners increase risk of financial distress
and bankruptcy? Journal of Corporate Finance, 18(1), Pages 138–150
VanHorne, J. C., & Wachowiez, J. M. (2001). Fundamentals of Financial Management (11th edn. ed.). New York: Prentice Hall Inc.
Wang, Y.-J. (2002). Liquidity management, operating performance, and corporate value: evidence from Japan and Taiwan. Journal of Multinational Financial Management, 12(2), 159-169. doi:http://dx.doi.org/10.1016/S1042-444X(01)00047-0
Wernerfelt, B. and Montgomery, C. A. (1986). What is an attractive industry?, Management Science, 32, 1223-1230.
Whited, T. M. (1992). Debt, Liquidity Constraints, and Corporate Investment: Evidence from Panel Data. The Journal of Finance, 47(4), 1425-1460. doi:10.2307/2328946
Wilner, B. S. (2000). The Exploitation of Relationships in Financial Distress: The Case of Trade Credit. The Journal of Finance, 55(1), 153-178. doi:10.1111/0022-1082.00203
31
Table 1. Summary of variables, calculations and definitions
Variable Acronym Description
Dependent variable
1−year Tobin’s Q Ratio
1−year
QRATIO Ratio of total assets minus book value of equity plus market value of equity to total assets.
3−year Tobin’s Q Ratio
3−year
QRATIO QRATIO over a three-year period
1−year return on assets 1−yearROA Ratio of profit before interest and tax to total assets.
3−year return on assets 3−yearROA ROA over a three-year period
Cash Conversion Cycle CCC
Annual Sales Growth GROWTH Percentage change in sales revenue over the previous year.
Company Age AGE
Number of years between incorporation and the calendar year end of each firm. Company Size SIZE Value of firms’ total assets in British pounds sterling.
Tangible Fixed Assets ATAN Fixed assets as a percentage of total assets. Financial Leverage LEV Total debt as a percentage of total assets.
Crisis
Crisis is an indicator variable which identifies the financial crisis. It is equal to one for fiscal years 2007, 2008 and 2009 and zero otherwise.
Cash Flow CFLOW Operating income before depreciation and amortisation minus interest expense and income tax expense scaled total assets.
Cash Conversion Cycle*
32
Table 2. Descriptive statistics
The table provides the sample characteristics of 6,424 firm−years across 802 unique UK SMEs on the AIM over the period 2004−2013. All variables are defined in Table 1.
Variables Obs. Mean Std Dev perc 10 Median perc 90
1−year QRATIO(ratio) 6,424 1.4921 1.3089 0.9709 1.2143 2.0178
3−year QRATIO(ratio) 4,996 1.4920 1.4376 1.0023 1.3214 2.2203
1−year ROA(ratio) 6,424 5.1093 11.0232 1.0298 8.2627 16.7553
3−year ROA(ratio) 4,996 5.0935 11.1915 1.2932 8.3112 16.9123
CCCt–1 (days) 6,424 62.4109 53.0912 24.9143 44.3523 92.1980
CFLOW t –1(%) 6,424 10.0901 24.0771 1.0243 8.8801 21.2143
GROWTHt –1(%) 6,013 7.9066 6.6472 0.0000 5.1205 39.6741
AGEt –1(years) 6,332 19.7312 17.1512 8.9871 15.6013 52.0187
SIZEt –1(£M) 6,424 9.8600 13.5640 1.8400 10.8100 33.8500
ATAN t –1(%) 6,113 37.1788 35.4094 3.0187 26.2038 69.2758
33
Table 3. Industry distribution of the sample
The table presents the industry distribution based on NACE rev. 2 which is a statistical classification system of economic activities within the European Community.
Industry Focus NACE 2 Observations
Agriculture, forestry and fishing A 377
Mining and quarrying B 351
Manufacturing C 326
Electricity, gas, steam and air conditioning supply D 216 Water supply; sewerage, waste management and
remediation activities E 210
Construction F 281
Wholesale and retail trade; repair of motor vehicles and
motorcycles G 346
Transportation and storage H 162
Accommodation and food service activities I 275
Information and communication J 283
Real estate activities L 333
Professional, scientific and technical activities M 332 Administrative and support service activities N 282 Public administration and defence; compulsory social
security O 233
Education P 367
Human health and social work activities Q 331 Arts, entertainment and recreation R 283
Other service activities S 231
Activities of households as employers; undifferentiated
goods T 347
34
Table 4. Pearson correlation coefficients
The table provides Pearson correlation coefficients for the 6,424 firm-years across 802 unique UK SMEs on the AIM over the period 2004-2013. All variables are defined in Table 1.
Variables 1-year
QRATIO
3-year QRATIO
1-year ROA
3-year
ROA CCC CFLOW GROWTH AGE SIZE ATAN LEV
1−year
QRATIO(ratio) 1
3−year
QRATIO(ratio) 0.8703 1 0.0000
1−year ROA(ratio) 0.3670 0.3189 1
0.0000 0.0000
1−year ROA(ratio) 0.3413 0.3708 0.8435 1
0.0000 0.0000 0.0000
CCCt–1 (days) –0.1257 −0.0315 –0.1288 –0.1365 1
0.0000 0.0000 0.0000 0.0000
CFLOW t –1(%) 0.2523 0.2201 0.2550 0.2238 0.0768 1
0.0000 0.0000 0.0000 0.0000 0.0000
GROWTHt –1(%) 0.1712 0.1570 0.0242 0.0381 0.0585 0.1472 1
0.0000 0.0000 0.0000 0.0000 0.0401 0.0000
AGEt –1(years) 0.1483 0.1380 0.1519 0.1856 0.2064 0.2777 0.1817 1
0.0000 0.0000 0.0000 0.0000 0.0000 0.0000 0.0000
SIZEt –1(£M) 0.0366 0.0583 0.1036 0.1411 –0.0663 –0.0279 –0.0708 0.1094 1
0.0000 0.0000 0.0000 0.0000 0.0212 0.0176 0.0000 0.0000
ATAN t –1(%) –0.0085 −0.1927 -0.0006 -0.0033 0.0499 0.0645 0.0740 0.2390 0.1802 1
0.0000 0.0000 0.0000 0.0000 0.0165 0.0287 0.0110 0.0000 0.0000
LEVt –1(%) –0.1467 −0.1673 -0.0966 -0.1099 0.0701 –0.1136 –0.0536 –0.2062 –0.2389 –0.2323 1
35
Table 5: Effect of cash flow on relationship between WCM and QRATIO
The table presents random effects regression with 1-year QRATIO and 3-year QRATIO as the dependent variables. The sample conssist of 6,424 firm-years across 802 unique UK SMEs on the AIM over the period 2004-2013. P-values are below coefficients. The Ramsey’s RESET test is used for the test of linearity. All variables are defined in Table 1.
(1) (2) (3) (4) (5) (6)
DEPENDENT VARIABLE 1-year QRATIO 1-year QRATIO 1-year QRATIO 3-year QRATIO 3-year QRATIO 3-year QRATIO WORKING CAPITAL
CCC t –1 −0.0220*** −0.0226*** −0.0888*** −0.0148*** −0.0177*** −0.0168***
(−4.28) (−4.33) (−4.43) (−3.46) (−4.00) (−4.72)
PRIMARY VARIABLE
CFLOW t –1 6.5556*** 6.0201** 7.6768** 7.6301**
(2.58) (2.47) (2.06) (2.25)
INTERACTIVE EFFECT
CCC t–1 * CFLOW t –1 0.0121*** 0.0767***
(4.72) (4.04)
CONTROL VARIABLES
GROWTH t –1 1.6141*** 1.4414*** 1.4372*** 2.0565*** 1.9222*** 1.9235***
(9.51) (6.30) (6.24) (15.53) (7.73) (7.98) AGE t –1 0.1552** 0.1325** 0.1313** 0.2887*** 0.2428*** 0.2427***
(2.33) (2.08) (2.06) (4.27) (4.04) (4.04) SIZE t –1 1.6313*** 1.5723*** 1.5684*** 1.4568*** 1.3782*** 1.3672***
(10.82) (10.61) (10.56) (9.62) (9.98) (9.96)
ATAN t –1 −7.8304*** −7.9492*** −7.9535*** −7.4034*** −7.4934*** −7.4944***
(−21.27) (−21.65) (−21.68) (−20.33) (−21.38) (−21.48)
LEV t –1 −0.0209*** −0.0213*** −0.0210*** −0.0473*** −0.0367*** −0.0437***
(−4.55) (−3.91) (−3.79) (−12.03) (−7.23) (−7.22)
CRISIS t –1 −0.7035*** −0.6691*** −0.6777*** −0.4236*** −0.3885*** −0.3888***
(−6.75) (−6.32) (−6.43) (−5.96) (−5.13) (−5.38)
_cons 24.6267*** 23.2289*** 23.2309*** 23.6475*** 21.7465*** 21.7442*** (7.96) (6.34) (6.33) (7.12) (5.38) (5.53)
Industry Yes Yes Yes Yes Yes Yes
Year Yes Yes Yes Yes Yes Yes
Adjusted R2 0.3379 0.4081 0.4097 0.3610 0.4897 0.4859
Log likelihood −2788.48 −2662.26 −2646.20 −1834.70 −1784.71 −1784.43 Test of linearity 0.2121 0.2541 0.2283 0.2187 0.2209 0.2128
N 5,845 5,845 5,845 4546 4546 4546