Soils
184 Cattle treading effects on sediment loss and water infiltration by J.R. Russell, K.
Betteridge, D.A. Costall, and A.D. MacKay Technical Notes
191 A simple method for preparing reference slides of seed by Maria A. Dacar, and Stella M. Giannoni
194 Physical and chemical comparisons between microphytic and non-microphytic soil seedbeds by Robert R. Blank, Fay L. Allen, and James A. Young
197 Early harvest of squirreltail seed by Paul S. Doescher Book Review
200 Dynamic State Variable Models in Ecology: Methods and Applications by Colin W. Clark and Marc Mangel
Synopsis Papers of Remote Sensing Symposium
201 Remote Sensing/GIS Symposium by Douglas E. Johnson
202 A method to incorporate phenology into land cover analysis by Keith T. Weber 203 Airborne LASER technology for measuring rangeland conditions by Jerry C.
Ritchie, Mark S. Seyfried, Mark J. Chopping, and Yakov Pachepsky
204 Stream change analysis using remote sensing and geographic information sys- tems (GIS) by Andrea S. Laliberte, Douglas E. Johnson, Norman R. Harris, and Grant M. Casady
205 Responses of elk and mule deer to cattle in summer by Priscilla K. Coe, Bruce K.
Johnson, John W. Kern, Scott L. Findholt, John G. Kie, and Michael J. Wisdom 206 Remote Sensing of Range Production and Utilization by Paul T. Tueller
207 Mapping weekly rangeland vegetation productivity using MODIS algorithms by Matthew C. Reeves, Jerome C. Winslow, and Steven W. Running
208 Reflectance and image characteristics of selected noxious rangeland species by J.H. Everitt, D.E. Escobar, and M.R. Davis
Published bimonthly—January, March, May, July, September, November
Copyright 2001 by the Society for Range Management
INDIVIDUAL SUBSCRIPTION is by membership in the Society for Range Management.
LIBRARY or other INSTITUTIONAL SUBSCRIP- TIONS on a calendar year basis are $95.00 for the United States postpaid and $112.00 for other coun- tries, postpaid. Payment from outside the United States should be remitted in US dollars by interna- tional money order or draft on a New York bank.
BUSINESS CORRESPONDENCE, concerning subscriptions, advertising, reprints, back issues, and related matters, should be addressed to the Managing Editor, 445 Union Blvd., Suite 230, Lakewood, Colorado 80228.
EDITORIAL CORRESPONDENCE, concerning manuscripts or other editorial matters, should be addressed to the Editor, Gary Frasier, 7820 Stag Hollow Road, Loveland, Colorado 80538. Page proofs should be returned to the Production Editor, 3059A Hwy 92, Hotchkiss, CO 81419-9548..
INSTRUCTIONS FOR AUTHORS appear on the inside back cover of most issues. THE JOURNAL OF RANGE MANAGEMENT (ISSN 0022-409X) is published bimonthly for $56.00 per year by the Society for Range Management, 445 Union Blvd., Ste 230, Lakewood, Colorado 80228. SECOND CLASS POSTAGE paid at Denver, Colorado and additional offices.
POSTMASTER: Return entire journal with address change—Address Service Requested to Society for Range Management, 445 Union Blvd., Suite 230, Lakewood, Colorado 80228.
PRINTED IN USA Managing Editor J. CRAIG WHITTEKIEND
445 Union Blvd., Ste 230 Lakewood, Colorado 80228
(303) 986-3309 Fax: (303) 986-3892 e-mail address:
[email protected] Editor/Copy Editor
GARY FRASIER/JO FRASIER 7820 Stag Hollow Road Loveland, Colorado 80538 e-mail address:
[email protected] Production Editor
PATTY RICH
Society for Range Management 3059A Hwy 92
Hotchkiss, Colorado 81419-9548 e-mail address:
[email protected] Book Review Editor DAVID L. SCARNECCHIA
Dept of Natural Res. Sci.
Washington State University Pullman, Washington 99164-6410 e-mail address:
[email protected] Electronic JRM Editor M. KEITH OWENS
Texas A&M University Research Center 1619 Garner Field Road Ulvade, Texas
Associate Editors YUGUANG BAI
Dept. Plant Sciences University of Saskatchewan 51 Campus Drive
Saskatoon, Saskatchewan S7N 5A8
CANADA
ROBERT R. BLANK USDA-ARS 920 Valley Road Reno, Nevada 89512 KLAAS BROERSMA
Agriculture and Agri-Food Canada 3015 Ord Rd.
Kamloops, British Columbia V2B 8A9 CANADA JOE E. BRUMMER
Mt. Meadows Res. Ctr.
P.O. Box 598
Gunnison, Colorado 81230 DAVID GANSKOPP
USDA-ARS
HC-71 4.51 HWY 205 Burns, Oregon 97720 ROBERT GILLEN
USDA-ARS
Southern Plains Range Res. Sta.
2000 18th Street
ELAINE E. GRINGS USDA-ARS Fort Keogh-LARRL Route 1, Box 2021 Miles City, Montana 59301 MARSHALL HAFERKAMP
USDA-ARS Fort Keogh-LARRL Route 1, Box 2021 Miles City, Montana 59301 BILL OCUMPAUGH
Texas A&M Research 3507 Hwy 57E Beeville, Texas 78102 MITCHEL McCLARAN
University of Arizona 301 Biological Science East Tucson, Arizona 85721-0001 PAUL OHLENBUSCH
Kansas State University Department of Agronomy Throckmorton Hall Manhattan, Kansas 66506 ROBERT PEARCE
Resources Concept 340 N. Minnesota St.
Carson City, Nevada 89703
MICHAEL H. RALPHS USDA-ARS Poisonous Plant Lab 1150 E 1400 N
Logan, Utah 84341-2881 CAROLYN HULL SIEG
S.W. Science Complex 2500 South Pine Knoll Flagstaff, Arizona 86001 FAISAL K. TAHA
Director of Technical Programs Biosaline Agriculture Center P.O. Box 14660
Dubai, U.A.E.
ALLEN TORELL
New Mexico State University Agricultural Economics Box 3169
Las Cruces, New Mexico 88003 MIMI WILLIAMS
USDA-ARS
22271 Chinsegut Hill Rd Brooksville, Florida 34601-4672
THE SOCIETY FOR RANGE MANAGEMENT, founded in 1948 as the American Society of Range Management, is a nonprofit association incorporated under the laws of the State of Wyoming. It is recognized exempt from Federal income tax, as a scientific and educa- tional organization, under the provisions of Section 501(c)(3) of the Internal Revenue Code, and also is classed as a public foundation as described in Section 509(a)(2) of the Code. The name of the ..Society was changed in 1971 by amendment of the Articles of Incorporation.
The objectives for which the corporation is established are:
—to properly take care of the basic rangeland resources of soil, plants, and water;
—to develop an understanding of range ecosystems and of the principles applicable to the management of range resources;
—to assist all who work with range resources to keep abreast of new findings and techniques in the science and art of range management;
—to improve the effectiveness of range management to obtain from range resources the products and values necessary for man’s welfare;
—to create a public appreciation of the economic and social benefits to be obtained from the range environment;
—to promote professional development of its members.
Membership in the Society for Range Management is open to anyone engaged in or interested in any aspect of the study, management, or use of rangelands. Please contact the Executive Vice- President for details.
President
JAMES T. O’ROURKE 61 Country Club Road Chadron, Nebraska 69337 1st Vice-President
RODNEY K. HEITSCHMIDT USDA-ARS
Ft. Keogh LARRL Rt 1, Box 2021
Miles City, Montana 59301-9801 2nd Vice-President
BOB BUDD Red Canyon Ranch 350 Red Canyon Rd Lander, Wyoming 82520-9417 Executive Vice-President J. CRAIG WHITTEKIEND
445 Union Blvd. Suite 230 Lakewood, Colorado 80228-1259
(303) 986-3309 Fax: (303) 986-3892 e-mail address:
[email protected] Directors
1999-2001
JAMES LINEBAUGH 3 Yhvona Dr.
Carson City, NV 89706-7717 GLEN SECRIST
Idaho Dept. of Agriculture 3818 S. Varian Ave.
Boise, Idaho 83709-4703 2000–2002
RICHARD H. Hart USDA-ARS
High Plains Grasslands Station 8408 Hildreth Rd.
Cheyenne, Wyoming 82009-8809 DON KIRBY
North Dakota State University Animal & Range Science Fargo, North Dakota 58105 2001–2003
JOHN TANAKA Oregon State Univ.
1648 Bailey St.
Philomath, Oregon 97370-9552 GREG TEGART
BCMAFF
1690 Powick Rd, Suite 2000 Kelowna, BC V1X 7G5 CANADA
The term of office of all elected officers and directors begins in February of each year during the Society’s Annual Meeting.
Contribution Policy: The Society for Range Management may accept donations of real and/or personal property subject to limitations set forth by State and Federal law. All donations shall be subject to management by the Executive Vice President as directed by the Board of Directors and their discretion in establishing and maintaining trusts, memorials, scholarships, or other types of funds.
Individual endowments for designated purposes can be established according to Society policies. Gifts, bequests, legacies, devises, or donations not intended for establishing designated endowments will be deposited into the SRM Endowment Fund. Donations or requests for further information on Society policies can be directed to the Society for Range Management, Executive Vice-President, 445 Union Blvd., Suite 230, Lakewood, Colo. 80228-1259. We recommend that donors consult Tax Advisors in regard to any tax consideration that may result from any donation.
The Journal of Range Managementis a publication of the Society for Range Management. It serves as a forum for the presentation and discussion of facts, ideas, and philosophies pertaining to the study, management, and use of rangelands and their several resources. Accordingly, all material published herein is signed and reflects the individual views of the authors and is not necessari- ly an official position of the Society. Manuscripts from anyone—nonmembers as well as members—are welcome and will be given every consideration by the editors. Editorial comments by an individual are also welcome and, subject to acceptance by the editor, will be published as a “Viewpoint.”
In Cooperation With: Some of the articles appearing in The Journal of Range Management (JRM) are presented in cooperation with The American Forage and Grassland Council (AFGC). This coopera- tion consists of JRM acceptance of professional papers in forage grazing management and related sub- ject areas from AFGC members and the appointment of 2 AFGC affiliated associate editors to JRM’s Editorial Staff. The American Forage and Grassland Council Offices: P.O. Box 94, Georgetown, Texas 78627; Rebecca Greenwald, President; Dana Tucker, Executive Secretary.
Abstract
Woody cover, when expressed at the scale of the 207 km2 Cusenbary Draw basin, remained unchanged (~23%) from 1955 to 1990. When expressed at the scale of range sites, woody cover declined on sites with relatively high production potential and increased on sites with relatively low production potential.
Change in woody cover distribution at sub-range site scales, increased low and high woody covers and decreased intermediate woody cover, would be expected to lead to increased water yield at the basin scale because there was an apparent threshold woody cover (~20%) above which simulated evapotranspiration (ET) changed little with increasing woody cover. This potential increase, however, was more than offset by the decreased water yield due to increased ET loss associated with compositional changes of woody vegetation from oak to juniper. A set of woody cover-ET regression curves was developed for different range sites based on simulation studies using the SPUR-91 hydrologic model. Based on these woody cover-ET regression curves and GIS analysis, no brush management would result in a 35%
decrease in water yield, while a hypothetical brush management cost-share program would increase water yield by 43% over the 1990 level. Benefits in water yield and forage production from brush management differ in different range sites. A brush man- agement cost-share program that preferentially allocated brush management to sites with deep soil and the highest forage pro- duction potential increased water yield by 50%, compared to a 100% increase if brush management were preferentially allocat- ed on sites with shallow soil and highest water yield potential.
These model results illustrate that the spatial scale of assessment and spatial distribution of brush management among range sites should be important concerns associated with developing and evaluating brush management policies.
Key Words: brush management, evapotranspiration, GIS and remote sensing, hydrologic modeling, semi-arid rangeland
Replacement of grasslands and savannas with woodlands is a worldwide trend that coincided with European expansion and set- tlement in the eighteenth and nineteenth centuries (Scholes and
Archer 1997). This shift from grassland savannas to shrub-domi- nated landscapes has broad implications for availability and qual- ity of water (Archer 1994, Thurow 1998). Increased woody cover and its effect on hydrology have special significance in the semi- arid rangelands of the western US that are relied on as sources of J. Range Manage.
54: 98-105 March 2001
Vegetation and water yield dynamics in an Edwards Plateau watershed
X. BEN WU, ERIC J. REDEKER, AND THOMAS L. THUROW
Authors are assistant professor, Department of Rangeland Ecology and Management, Texas A&M University, College Station, Tex. 77843; research scien- tist, Caesar Kleberg Wildlife Research Institute, Texas A&M University-Kingsville, Kingsville, Tex. 78363; and professor and head, Department of Renewable Resources, University of Wyoming, Laramie, Wyo. 82071.
The research was supported by a grant from the Texas Agriculture Experiment Station. The authors wish to thank Fred Smeins, Charles Taylor, Dee Carlson, Tom Payton, Shiping Xiong, Xiaolian Ren, and Carr Thomson for their assistance dur- ing the study. Comments of Fred Smeins and 2 anonymous reviewers led to con- siderable improvement of the manuscript.
Manuscript accepted 19 Jun. 2000.
Resumen
Cuando la cobertura de la vegetación leñosa se expresó a escala de los 207 km2 de la cuenca Cusenbary Draw permaneció sin cambios (~23%) durante el periodo de 1955 a 1990. Cuando se expresó a escala de sitio de pastizal, la cobertura de leñosas disminuyó en sitios con potenciales de producción relativamente altos y se incrementó en sitios con potenciales de producción rel- ativamente bajos. Por los cambios en la distribución de la cober- tura de leñosas a escala de subsitio de pastizal (aumento en la cobertura de leñosas bajas y altas y disminución en la de leñosas intermedias) se esperaría que ocurriera un aumento en el rendimiento de agua a nivel de cuenca, porque aparentemente hubo un umbral de cobertura de leñosas (~20%) arriba del cual la evapotranspiración simulada (ET) cambia poco con los aumentos de cobertura de leñosas. Sin embargo, este incremento potencial fue mas que compensado por la disminución en el rendimiento de agua debido a el incremento de la perdida de ET asociada con los cambios composicionales de la vegetación de leñosas de roble a juniper. Se desarrollo un juego de curvas de regresión entre coberturas de leñosas y ET para diferentes sitios de pastizal, las curvas se desarrollaron en base a estudios de simulación utilizando el modelo hidrológico SPUR-91. Basados en estas curvas de regresión y análisis con sistemas de informa- ción geográfica, el no manejar la vegetación arbustiva resultaría en una disminución del 35% del rendimiento de agua, mientras que un programa de manejo de los arbustos, hipotéticamente viable en términos de costos, incrementaría el rendimiento de agua en 43% respecto a la producción de 1990. Los beneficios en rendimiento de agua y producción de forraje difieren entre sitios de pastizal distintos. Un programa de manejo de arbustos económicamente viable asignado a sitios de pastizal con suelo profundo y la mas alta de producción de forraje incrementaría el rendimiento de agua en 50%, comparado con el incremento del 100% si el manejo de arbustos se asignará a sitios con suelos poco profundos y con el mayor potencial de rendimiento de agua. Los resultados de este modelo ilustran que la evaluación de la escala espacial y la distribución espacial del manejo de arbus- tos entre sitios de pastizal deben ser preocupaciones importantes asociadas al desarrollo y evaluación de las políticas de manejo de arbustos.
water, such as the Edwards Plateau region of Texas. The Edwards aquifer, which is recharged from Edwards Plateau range- lands, is the primary source of water for San Antonio, Austin and the many other municipalities of the region. Many rivers also originate in this region, which provide habitat for endangered species, recreation- al opportunities, and water supply to an area extending from the Edwards Plateau to the Gulf Coast.
Policy makers are increasingly con- cerned that vegetation management on rangeland be responsive to regional water yield objectives (Thurow et al. 2000).
Water yield (deep percolation and surface runoff) from rangelands can be determined by the balance of water input in precipita- tion and water output in evapotranspira- tion (interception loss, soil evaporation, and transpiration), plus any changes in the amount of water stored in soil (Hibbert 1983). In semi-arid rangelands, evapotran- spiration (ET) can account for 80–95% of the water loss (Thurow 1991). Changes in woody cover in semi-arid rangelands can significantly alter ET losses, hence water yield, due to higher interception and tran- spiration of woody vegetation compared to those of herbaceous vegetation, particular- ly on shallow range sites. Annual intercep- tion loss, mainly determined by precipita- tion pattern and the water holding capacity of plant canopies and associated litter, ranges from 11 to 18% of precipitation for herbaceous vegetation (Clark 1940, Thurow et al. 1987) and is considerably higher for woody vegetation [e.g., about 46% for live oak (Thurow et al. 1987) and 70 to 80% for juniper (Eddleman 1983, Hester 1996)]. Most woody plants in semi- arid rangelands also have higher transpira- tion rates than do grasses and forbs due to larger transpirational area (leaf area), longer transpirational period (length of growing period), and deeper rooting struc- tures that access deep soil moisture (Davis and Pase 1977, West 1992). Studies at plot (1 to 20 m2) and catchment (1 to 10 ha) scales have shown that reduction of woody cover through brush management on the Edwards Plateau area significantly increases water yield, mostly as deep drainage to recharge springs and aquifers because of the high infiltration characteris- tics of Edwards Plateau soils and the frac- tured limestone substrate (Richardson et al. 1979, Dugas et al. 1996, Thurow and Hester 1997).
A number of catchment experiments have been conducted on rangeland and forest watersheds to determine the effect of vegetation changes on ET and water
yield (summarized by Bosch and Hewlett 1982, Hibbert 1983, Douglass 1983).
Catchment level water yield studies are very expensive and frequently require many years before a conclusion can be drawn, consequently empirical studies can only evaluate a very limited number of sites and vegetation management scenar- ios. A potentially effective approach for assessing the effect of brush management on water yield in large watersheds is com- puter simulation using watershed hydro- logic models (Singh 1995). One such model is the SPUR-91 (Simulation of Production and Utilization of Rangelands), a physically-based simulation model that has been specifically developed and vali- dated for rangeland ecosystems (Wight and Skiles 1987, Carlson and Thurow 1992, 1996). One limiting factor for this approach is the requirement of complex input parameters of spatially distributed attributes. The development of geographic information systems (GIS) technology and spatial modeling approaches in the recent decades has significantly eased this limita- tion and made the application of complex hydrology models practical (Maidment 1993). Another factor that limits the use- fulness of hydrologic modeling approach- es for assessment of the effects of brush management on water yield is spatially explicit vegetation data with sufficient spatial resolution and extent suitable for both brush management assessment and hydrologic modeling. Remote sensing and digital image processing technologies have made the development of such vege-
tation data covering large spatial and tem- poral extents possible, although it requires a considerable amount of time and effort.
Objectives of this study were to 1) assess historical (1955 to 1990) changes in vegetation structure and its relationship to rangeland management, using remote sensing and GIS analysis, in a 207 km2 watershed composed of 5 range sites rep- resentative of the rangelands on the west- ern Edwards Plateau, and 2) develop pre- dictive vegetation structure and water yield relationships using SPUR-91 hydro- logic model simulations and GIS model- ing to evaluate a) the effect of changing woody cover, as well as the spatial scale of assessment, on water yield, and b) the water yield ramifications of brush man- agement patterns and policies.
Materials and Methods
Study Area and GIS Database The study was conducted on the Cusenbary Draw basin (207 km2 ) on the Edwards Plateau (30°21' N; 100°38' W) (Fig. 1). The elevation of the basin ranges from 628 to 711 m above msl. The mean frost-free period is 240 days. Annual pre- cipitation is highly variable with a mean of 553 mm and a range of 156–1,054 mm.
Most precipitation results from intense, brief thunderstorms. Low Stony Hill and Shallow range sites are the most common range sites within the basin; Deep Divide, Valley and Bottomland range sites are also present (Fig. 1). Tarrant stony clay,
Fig. 1. Study site showing the location of the Cusenbary Draw basin and range sites in the basin. Percentage in parentheses indicates proportion of the basin in a range site.
Kavett-Tarrant complex, Tobosa clay, Knippa silty clay and the Frio-Dev associ- ation characterize the soils within these range sites, respectively (Wiedenfeld and McAndrew 1968). Woody vegetation composition varies considerably among sites. Ashe and redberry juniper (Juniperus ashei Buchh. and Juniperus pinchotii Sudw.), live oak (Quercus vir- giniana Mill.), and Vasey shin oak (Q.
pungens var. vaseyana Buckholz) domi- nate the shallow soil upland sites with honey mesquite (Prosopis glandulosa Torr.) and live oak dominating the sites with deeper soil. Dominant herbaceous species include Texas wintergrass (Stipa leucotricha Trin. & Rupr.), sideoats grama (Bouteloua curtipendula Torr.), three-awn (Aristida purpurea Nutt.), and common curlymesquite (Hilaria belangeri Nash) (Fuhlendorf and Smeins 1997).
A GIS database was developed for the study area. The watershed boundaries of the Cusenbary Draw basin and its sub- watersheds were delineated based on the 1:24000 digital elevation models (DEM) through cell-based hydrologic modeling using ARC/INFO GRID (ESRI 1994).
Over 300 ground control points were dis- tributed throughout the basin and immedi- ate surrounding areas; geo-location data for these points were collected using Trimble’s Pathfinder global positioning system (GPS) units (±2.5-m accuracy). Range sites were delineated from 1:20000 NRCS soils maps from the Sutton County Soil Survey (Wiedenfeld and McAndrew 1968). These soils maps were scanned into digital for- mat, mosaicked using ERDAS Imagine (ERDAS 1997), and geo-referenced with the GPS control points using a second- order polynomial transformation (Fig. 1).
Changes in Vegetation Structure Historical vegetation coverage was developed from over 90 black and white aerial photographs taken in 1955 (1:20,000) and 1990 (1:40,000). The photos were scanned into digital form with 1-m resolu- tion (1-m2 pixels); mosaicked and geo-ref- erenced based on GPS ground control points using ERDAS Imagine. An iterative self-organizing clustering algorithm (ERDAS ISODATA) (ERDAS 1997) was used to classify the images by range site.
Fifty clusters generated by the algorithm were then reclassified into 2 classes, woody and non-woody, based on original aerial photographs and field verification. A 50x50-m moving window with 10-m steps was used to evaluate the spatial distribution of woody cover in different range sites. The composition of the vegetation in each range
site was estimated based on data from the literature (Smeins and Merrill 1988, Wiedenfeld and McAndrew 1968, Thurow et al. 1988, Schacht and Reinke 1993, Hester 1996). Seven compositional classes including juniper, oak, mesquite, short- grass, midgrass, forbs, and bare ground were used for simulation modeling.
Effect of Woody Cover on Water Yield
The effects of woody cover on water yield were examined through simulations using the SPUR-91 hydrologic model (Carlson and Thurow 1992). This model was validated on several Texas rangeland sites, including the Sonora Agricultural Experiment Station site which was part of the Cusenbary Draw basin. The model has proven to be effective in predicting the effect of management practices on hydrol- ogy (Carlson and Thurow 1996). A single climate input file, generated based on average monthly precipitation data (1948 to 1996), was used for all simulations. The generated precipitation data were adjusted by subtracting interception that was deter- mined based on the percent cover and species composition of the vegetation in each range site and the species-specific interception data from the literature (Clark 1940, Thurow et al. 1987, Desai 1992, Thurow and Hester 1997) since SPUR-91 did not take interception into account. The phytomass for each site was estimated based on the vegetation composition and species-specific phytomass parameters from the SPUR-91 Texas validation input files (Carlson and Thurow 1992).
Simulations were conducted for nine ~10%
increments from 0 to 80% of potential woody cover for each of the range sites based on 1990 species composition (Fuhlendorf and Smeins 1997, Unpublished data, Smeins and Fuhlendorf). The species compositions was defined by the proportion of woody cover that were juniper, oaks, and mesquite and the proportion of non-woody cover that were short-grass, mid-grass, forbs, and bare ground for each of the range sites (Redeker 1998). These compo- sitions were used for simulations with dif- ferent percent woody cover. Each simula- tion was run for 15 years and only the last 10 years of data were used for analysis, which increases the reliability of simula- tion results by allowing the sensitive para- meters to stabilize (Carlson and Thurow 1992). Results of the simulations for the nine, 0 to 80% woody cover levels, were used to generate regression curves of per- cent woody cover vs. ET for each of the range sites. A form of exponential curve
was fitted to the data with non-linear regression using the Levenberg-Marquardt algorithm. Evapotranspiration for each range site was estimated based on the pro- portions of land (in 0.25 ha cells) in 5%
woody cover intervals and the woody cover-ET curve for that range site. The ET for the entire basin was determined as a weighted average of the range site esti- mates. Running the simulation by range site using the field scale model may under- estimate the ET for the Valley and Bottomland range sites because there may be additional water input from surface and subsurface flows from the upland sites.
Given the shallow soil and fractured lime- stone substrate of the uplands, however, it is likely that the majority of the water input from upland would be in channel, and possibly spring, flow which may affect only a limited proportion of the Valley and Bottomland range sites. Water yield was estimated as the difference between simulated annual precipitation and predicted total ET, assuming no long- term changes in water stored in soil.
Although changes in water stored in soil (∆S) can be an important factor for event- based simulation and time specific short- term evaluations, in assessing long-term average behavior for strategic evaluation and planning, however, it should be rea- sonable to assume ∆S=0.
Water Yield Ramifications of Brush Management
The woody cover-ET regression curves were used to assess the effect of vegeta- tion on water yield under different man- agement scenarios. For a scenario of zero brush management, 2 areas in the basin that received no brush management from 1955 to 1990, one on a deep soil range site and the other on a shallow soil range site, were used to estimate the relative change in percent woody cover in the absence of brush management. The relative change in woody cover of the deep range site was used for the Bottomland, Valley and Deep Divide range sites where the primary invading species is honey mesquite. The relative change in woody cover of the shallow site was used for the Shallow and Low Stony Hill range sites where the pri- mary invading species is juniper. In the second scenario, the effects of a Texas brush management program that incorpo- rated a revenue neutral cost-share offer (Thurow et al. 2000) were examined. This study found that 40% of the rangeland would be voluntarily enrolled in a publicly funded brush management program designed to increase water yield that
required that woody cover be reduced to 3% via chaining on all land entered into the program. For this simulation, woody cover was reduced to 3% on 40% of the land in each range site, and was held at the 1990 level in the remaining 60% of the land. The third and fourth scenarios were variations of the second scenario with dif- ferent spatial distributions of the enrolled land; one concentrated the brush manage- ment on the range sites that had the great- est potential for forage production and the other concentrated the brush management on the range sites that had the greatest potential for water yield.
Results and Discussions
Changes in Vegetation Structure The overall woody cover remained virtu- ally unchanged (23.6%), when expressed at the scale of the 207 km2 Cusenbary Draw basin. However, changes in woody cover varied considerably among different range sites over the 35 years based on the classified 1955 and 1990 aerial photogra- phy (Fig. 2). This is largely due to the uneven distribution of brush management efforts (Redeker et al. 1998). The majority of the brush management took place on range sites with higher production poten- tial because investment in clearing brush on these sites offers higher economic returns in terms of increases in forage. As a result, woody cover decreased 17% and 28%, respectively, in the most productive Bottomland and Valley range sites while it increased over 170% in the least produc- tive Deep Divide sites.
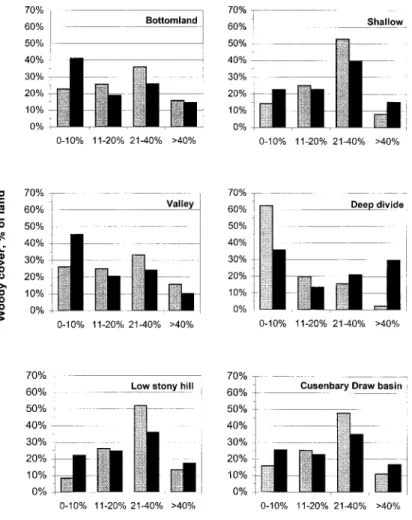
Changes in the relative amount of land with different amount of woody cover in each range site further illustrate the dynamics in woody encroachment and brush management (Fig. 3). On the most productive Bottomland and Valley range sites, considerable amount of land with medium (11–40%) and high (>40%) woody covers were converted to areas with low woody cover (≤10%). The pro- portion of land with low woody cover on these range sites increased to over 40% by 1990, some 70 to 80% increase over the 35 years. On Low Stony Hill and Shallow range sites with intermediate forage pro- duction potentials, considerable brush management increased the proportion of land with low woody cover to over 20%;
however, woody encroachment in some other areas was not controlled which resulted in an increase in the area of land with high woody cover. Due to low levels Fig. 2. Percent cover of woody vegetation for individual range site in 1955 and 1990.
Fig. 3. Distribution of areas with different percent woody cover for individual range site and the whole basin in 1955 and 1990.
of brush management efforts, the area with low woody cover decreased from 62% to 36% for the least productive Deep Divide range site, while the area with high woody cover increased from less than 3% to near 30%. As a result of these changes, there was an increase in the amount of land with either low or high woody cover at the expense of a decreasing amount of land with intermediate woody cover in the Cusenbary Draw basin as a whole. This change in the distribution reflected a com- bination of accelerated rates of woody encroachment and unevenly distributed brush management efforts.
Although the vegetation composition on the deeper range sites remained unchanged over the 35 years, there was a significant reciprocal change in juniper and oak cover on the Low Stony Hill and Shallow range sites. Juniper cover increased from 2.9%
in 1955 to 10.9% in 1990, while oak cover decreased from 18.3% to 9.9% in the same period. Two factors contributed most to this shift in woody vegetation structure.
The severe drought in the 1950's resulted in high mortalities of woody species, but the mortality for juniper trees less than 2- m tall was insignificant (Merrill and Young 1959). This set the stage for juniper to increase its cover in the years after the drought with the absence of fire (Fuhlendorf et al. 1996). The other factor contributing to this increase in juniper was the chaining practices common in the 1950's and 1960's that indiscriminately cleared all brush. Redberry juniper aggres- sively coppices from the roots. It is likely that the continuous presence of cattle, sheep, goats and deer would have put greater browse pressure on the resprouts and seedlings of oaks than on the less palatable juniper seedlings and resprouts.
Effect of Woody Cover on Water Yield
Woody Cover-ET Relationship
The woody cover-ET regression curves based on the systematic simulation studies represent the effect of woody cover on water balance for each of the 5 range sites within the Cusenbary Draw basin which are repre- sentative of the rangelands on the Edwards Plateau (Fig. 4). Evapotranspiration, the reci- procal of water yield, often accounts for over 90–95% of the water budget on these rangelands and the reduction of ET is the key for vegetation management to increase water yield (runoff and deep percolation).
Deeper range sites (Bottomland and Valley) exhibit relatively little change in ET with changes in woody cover. This is due to the high ET at 0% woody cover
determined by the soil depth and large amount of herbaceous transpiring tissue, and the low interception losses associated with honey mesquite which tends to domi- nate these sites. On the Low Stony Hill and Shallow range sites, ET increases dra- matically with increase in woody cover over 0% as a result of elevated intercep- tion loss of precipitation by juniper and oak. With continuous deep soil, relatively high herbaceous cover and greater compo- nent of mesquite in the woody cover, the upland Deep Divide range sites have rela- tively small change in ET with changes in woody cover.
These simulation results compared favorably with the literature. The model predicted ET losses within 5% of values reported in the studies of Thurow and Hester (1997) based on empirical field
studies conducted on a Shallow range site at the Sonora Agriculture Experiment Station. The simulation results fit well to the experimental studies not only at 0%
woody cover, where very high reliability was demonstrated in the validation studies (Carlson and Thurow 1992), but also at high woody cover levels. The SPUR-91 model simulations predicted 5% greater ET than the empirical estimates on 100%
herbaceous cover, 2% greater on 30%
woody cover and less than 1% greater on 60% woody cover. These similar results of 2 very different methods strengthen the case that these estimates are reasonable for the region.
The simulations, however, apparently over-predict ET at low but non-zero woody cover levels. The SPUR-91 model performs well in situations with no (0%)
Fig. 4. Relationship between evapotranspiration (ET, expressed as a percent of precipitation) and percent woody cover at different range sites and for the Cusenbary Draw basin as a whole. The symbols shown are SPUR 91 simulation results and the line is the regression curve. The open symbols represent data points that were not used in the regression for reasons detailed in the text.
woody cover or with relatively high (>20%) woody cover, but not in situations with relatively low (<20%) woody cover.
The soil moisture extraction routine of the model allows plants to extract their physio- logic requirements of water before allowing soil water to percolate below their rooting zone. When a single woody plant is present on a site the model does not limit water extraction for that plant to the volume of soil physically accessible to the plant.
Rather this plant is allowed unlimited access to all soil water on the site that has percolated below the maximum rooting depth of more shallow rooted herbaceous species. This lack of spatial constraints on soil water available for individual woody plants allows unrealistic luxury consump- tion that results in an over-prediction of transpiration in low woody cover scenarios.
This over-prediction in low woody cover conditions can be compensated for by fit- ting a form of exponential curves to the data points generated by the model, exclud- ing the data points at very low (<15%) but non-zero woody covers. These regression curves fit the data points at 0% and high woody cover well while reducing the effects of excessive water extraction in low woody cover conditions. An ET to woody cover regression curve for the Cusenbary Draw basin was generated based on the regression curves for individual range sites and the relative proportions of the basin fall in different range sites (Fig. 4).
Woody Cover and Water Balance Figure 5 depicts the water balance of the Cusenbary Draw basin as a function of percent woody cover, based on the simula- tion results with 1990 species composition and associated regression curves.
Interception loss increases linearly with increasing woody cover assuming the species composition remains unchanged.
The amount of bare ground may increase on Shallow and Low Stony Hill ranges, sites dominated by dense stands of juniper and oak thereby lowing the interception loss of the area not occupied by woody cover. This should have a limited influ- ence on the estimation of interception given the small amount of non-woody cover and the relatively low interception of herbaceous species. For example, an increase in the proportion of bare ground in the non-woody cover from the default 30% to 80% would change the intercep- tion from 50.4% to 49.3% on Shallow and Low Stony Hill ranges sites with 80%
woody cover. Soil evaporation is greatest at 0% woody cover and decreases as woody cover increases due to the modifi-
cation of microenvironments by increased shading and reduced wind exposure (Thurow and Hester 1997). The rate of reduction in soil evaporation decreases at woody covers greater than 20%.
Transpiration initially increases with increased woody cover. As woody cover increases beyond 20%, however, transpi- ration begins to decrease in response to the reduced amount of precipitation reaching mineral soil, hence reduced soil water available for transpiration, as a result of increased interception loss. These model- ing results indicate that there is a threshold woody cover around 20% over which the reduction of water yield levels off and water yield reaches its lowest level. Below this threshold woody cover, water yield increases exponentially with decreasing woody cover. This implies that brush man- agement effort must reduce the woody cover to less than 20% to have a meaning- ful contribution to water yield on these rangelands. It also shows that the lower the woody cover the more effective per unit reduction of woody cover for increased water yield.
Effect of Spatial Scale on Assessment of Vegetation Change and Water Yield
Given the differential changes in woody cover on different range sites (Fig. 2) and the different shapes of the woody cover- ET regression curves for different range sites (Fig. 4), it would be misleading to use the average woody cover and the woody cover-ET regression curve for the basin to assess the effect of vegetation change from 1955 to 1990 on water yield.
Even assessments based on average woody cover and woody cover-ET regres- sion curve for individual range sites may be inaccurate because of the strongly non- linear nature of the woody cover-ET regression curves (Fig. 3). An area domi- nated by an intermediate level of woody cover would have lower water yield than an area with the same average woody cover but dominated by very low and very high woody covers. These considerations illustrate that assessments should be based on frequency distribution of areas with different percent woody cover by range sites. If the woody species composition in 1955 were the same as that in 1990, the changes in woody cover distribution from 1955 to 1990 would have resulted in a Fig. 5. Water balance for the Cusenbary Draw basin.
24% increase in water yield. However, water yield from Cusenbary Draw basin actually decreased (over 30%) because of the reciprocal change in juniper and oak cover on the Low Stony Hill and Shallow range sites and the higher interception and transpiration rates of juniper compared to that of oak (Thurow et al. 1987, Owens 1996, Thurow and Hester 1997). Despite improvement in woody cover distribution from the efforts of brush management over the 35 years, the potential increase in water yield, however, was more than offset by the decreased water yield due to composi- tional changes of woody vegetation caused in part by brush management practices.
Water Yield Ramifications of Brush Management
The hydrologic modeling approach used in this study and the resulting woody cover-ET regression curves can be an effective tool for assessing the implica- tions of brush management scenarios for policy making and educational purposes.
In the absence of landowner investment in brush management, the amount of woody cover would increase substantially as was evident on several ranches within the basin that selected not to invest in this form of land management. With no brush management, the Shallow and Low Stony Hill sites were observed to experience over 50% relative increases in woody cover from 1955 to 1990; and the Deep Divide, Bottomland, and Valley range sites were observed to experience relative increases in woody cover as high as 150%.
Such increase in woody cover will result in a significant change in water yield. A scenario of no brush management, assum- ing a 5% increase in woody cover for the shallow sites and a 10% increase in woody cover for the deep sites, would result in a 35% decrease in water yield from the 1990 levels (Table 1). Although this scenario represents one extreme of the spectrum, it
may not be far from possible realities in some areas of the Edwards Plateau where large ranches are being subdivided into smaller parcels. These ranchettes are used mainly for recreation and their owners tend to be less interested in brush manage- ment (Thurow et al. 2000).
A second scenario examined the possi- ble effect of a hypothetical publicly fund- ed brush management cost-share program designed to increase water yield (Thurow et al. 2000). It required that ranchers clear enrolled land to 3% woody cover and maintain that cover for a 10-year period.
The government payment associated with the cost-share was calculated so that the brush management effort would result in zero net financial cost to the rancher. The ranchers who participated in a survey were willing to enroll 40% of their land to be managed at 3% brush cover (Thurow et al.
2000). Assuming 40% of the land in each range site with the least woody cover were enrolled and the woody cover for the rest of the land remain unchanged, this sce- nario would increase water yield by 43%
over 1990 level (Table 1). These results suggest that brush management has the potential to dramatically alter water yield.
Spatial distribution of Brush
Management: Water Yield vs. Forage Production
Benefits in water yield and forage pro- duction from brush management may dif- fer in different range sites. In this study, the range sites with the highest forage pro- duction potential (Bottomland and Valley) (Redeker et al. 1998) had gentler slopes (1 to 5%) and deeper soil resulting in greater soil water storage potential; therefore, these sites had the lowest water yield potential. The range sites with relatively low forage production potential (Low Stony Hill and Shallow) had steeper slopes (3 to 12%) and shallower soil resulting in higher inherent water yield potential (Fig. 4). Reducing the woody
cover to 3% on a Low Stony Hill range site would generate 4.8 times more water yield than doing the same on a Bottomland range site. If there is no specific structure in a cost-share program on range site distri- bution of the enrolled land, it is likely that more low water yield potential (high pro- duction potential) land and less high water yield potential (low production potential) land will be enrolled in the program. If the second scenario were modified (a third scenario) to enroll 40% of land in the Cusenbary Draw in range sites with the highest forage production potentials (Bottomland, Valley, and then Shallow), it would increase water yield by 50% over the 1990 level (Table 1). A fourth scenario that enrolls 40% of land in the Cusenbary Draw in range sites with the highest water yield potentials (Low Stony Hill and then Shallow), would increase water yield by 100% over the 1990 level (Table 1). The same amount but different spatial distribu- tion of brush management efforts in these 2 scenarios would result in a 50% differ- ence in water yield.
Population increases are expected to place increasing demands on natural resources, including the surface and sub- surface freshwater supplies. These increased demands for freshwater supplies in arid and semi-arid areas are often dependent on rangeland water yield.
Incentive programs, such as the publicly funded cost-share program examined by Thurow et al. (2000) have the potential to encourage vegetation management in a way that could increase water yield sub- stantially. Range site-specific woody cover-ET regression curves, developed based on hydrologic model simulations, can be a useful tool for considering the estimated water yield associated with brush management, and a useful compo- nent to evaluate trade-offs between bene- fits in water yield and range production.
Such consideration will aid improvement of policy structure. This approach, coupled Table 1. Woody cover and water balance of the Cusenbary Draw basin for 1990 and 4 scenarios evaluated using woody cover-ET regression curves
developed from SPUR-91 hydrologic model simulations (simulated mean precipitation 501 mm/yr).
No brush Variations of the revenue neutral brush management 1990 cover management over program (Thurow et al. 2000) with emphasis on:
35 years1 No preference2 Forage production3 Water yield4
Overall woody cover (% of basin) 23.6% 29.5% 21.7% 17.6% 17.3%
Interception loss (mm/yr) 99.9 148.9 109.5 90.2 87.9
Total ET (mm/yr) 482.7 489.1 474.9 473.6 464.4
Water yield (liter/ha/yr) 182,531 119,070 260,606 274,477 365,541
% difference from 1990 water yield 0% –35% 43% 50% 100%
15% woody cover increase in Shallow and Low Stony Hill and 10% in Deep Divide, Bottomland, and Valley range sites.
2Woody cover is reduced to 3% on 40% of the land in each range site with the lowest woody cover; and remains unchanged on the rest of the land.
3Woody cover is reduced to 3% on 40% of the land with highest forage production potentials; and remains unchanged on the rest of the land.
4Woody cover is reduced to 3% on 40% of the land with highest water yield potentials; and remains unchanged on the rest of the land.