Munich Personal RePEc Archive
Ownership structure and bank
performance: An emerging market
perspective
Mamatzakis, Emmanuel and Zhang, Xiaoxiang and Wang,
Chaoke
1 July 2017
Online at
https://mpra.ub.uni-muenchen.de/80653/
1
Ownership structure and bank performance: An emerging market
perspective
Emmanuel Mamatzakis* [email protected]
Xiaoxiang Zhang* [email protected]
Chaoke Wang* [email protected]
Abstract
This study investigates whether ownership type does matter for bank performance in an emerging market. By tracing the identity of top owners, I group large shareholder of China’s commercial banks into government, state owned enterprises (SOEs), domestic private investors and foreign investors. These distinct types of shareholders have multiple motivations and incentives, in turn, this will affect how they perform their control rights and monitor over the invested banks. The main findings regarding the impact of ownership structure on bank performance suggest that banks with high state shareholding tend to have poorer performance and low profitability, consistent with much of the literature. In addition, banks with higher domestic privately shareholders are generally operated more profitably. Furthermore, higher foreign ownership may negatively affect bank performance. Moreover, ownership type diversity is positively associated with bank performance, and banks with concentrated ownership are worse performing. My findings are robustness under the different measures of bank performance.
Keywords: Banks, Ownership structure, Corporate governance JEL Classification: G21, G28, G32.
2
1 Introduction
Explaining performance differences among banks is a prevailing theoretical and empirical issue in the field of finance literatures. Ownership structure is widely accepted in the finance and economics study as an instrumental determinant of bank performance. Indeed, a considerable literature has developed on the relationship between ownership and performance. More specifically, examining the state ownership versus private ownership has received much attention in banking sector.
This study falls within a broad research program focusing on ownership in general. There are commonly three types of shareholder – state, private investors, and foreign investor in governance literature. There have been a number of empirical studies showing how differences between owner types influence bank performance (for government owned banks, see Iannotta et al., 2013 and Berger et al., 2015; for ownership by privately owners, see Cornett et al., 2010; for ownership by foreign owners, see Lensink et al., 2008; for managerial owners, see DeYoung et al., 2013;). The results of these studies are mixed but overall suggest that types of owner differ in their contributions to performance variation over time. The aim of this study is to reconcile these conflicting results by enriching the analysis of the bank's ownership structure using the Chinese case.
I limit this study to the significance of owner type in countries making the transition to some form of capitalism and focus specifically on China. China’s bank reform is still ongoing so that it is hard to reach conclusions on how it may affect the whole financial system. In particular, China’s banking sector is the most important component of the financial system (with 69% of total financial assets in 2016) and yet it has long remained undercapitalized and presented with non-performing loans. In
3
implications for regulators and other stakeholders. Moreover, study on ownership differences has to be grounded in an environment whereby banks of different ownership types coexist and compete, China's transition economy presents such an ideal context.
While ownership itself is an objective structure, I contend different ownership types that leads to different managerial cognitions. The main findings regarding the static effects of bank ownership on performance suggest that banks with more state shareholder tend to have poorer performance, consistent with much of the literature. In addition, banks with higher domestic privately shareholders are generally operated more profitably. Furthermore, higher foreign ownership may negatively affect bank performance. Moreover, ownership type diversity is positively associated with bank performance, while banks with concentrated ownership are worse performing. The results are robustness under the different measures of bank performance. My findings have implications for the design of appropriate corporate governance systems for Chinese commercial banks. Moreover, my results provide information that can inform policy debates within the China regulators.
This study makes a number of contributions to the literature. Firstly, it analysis the effects of ownership reforms, enriching the literature from the perspective of transitional as well as developing countries. The type of privatization and the form of state ownership is one of the major concerns in these countries. Secondly, this study exploits how banks function in an economy that combines rapid economic growth and state-owned banks that serve pollical goals. In another word, it examines the role of
4
ownership structure (i.e. ownership distribution and nature of the owners) in banking sector. As the recent calls to consider multiple dimensions of diversity simultaneously, this study extend the literature on the effects of shareholder diversity on performance in banks.
The study is organised as follows. Section 2 provides a brief outline of the current Chinese banking system, and followed by literature review in Section 3. Section 4 discusses the methodology and the data used. Section 5 presents the results of the tests, and followed by the robustness test in Section 6. Section 7 summarises and presents the implications of the results for China’s banking sector in its new regulatory environment.
2 China banking background
For three decades prior to the 1970s, China was a centrally planned economy with the majority of companies owned by government or state-related cooperative entities. In
another word, a large number of commercial banks are owned or controlled by the state, either directly through central or local government institutions or indirectly through marketized SOEs. Under the traditional communist system, the Chinese government gathered revenues from SOEs and provided financing support to the corporations according to the government planning. Whilst financial liberalisation helped to integrate Chinese markets with global markets, it constituted a major challenge for domestic banks and their systems of governance. However, the weak state of law and regulation in China’s capital market is a major limitation on the efficiency of financial institutions.
The state-owned banks have been criticized for the larger amount of impairment loans
due to the politically lending practices. Specifically, inefficient state-owned
5
Chinese government established the asset management companies that liquidated majority bank assets at high discounts.
Prior to 2003, the majority of Chinese commercial bank had been controlled by government entities with minority individual shareholders. Banking sector has been the primary source of financing for the economy growth, with the banking and other financial institutions accounting for over 80% of whole country’s financial assets. China becomes the world’s rapidly developing economies in last two decades.
In 2003, the government has been implementing a series of reforms to improve the efficiency and profitability of the state banks, particularly given the impending opening of the domestic financial sector to foreign investor under the World Trade Organization (WTO). China started the transition with a small number of large fully government-owned banks and few if any private banks. Three of the Big 4 state banks
was changed from fully state owned banks to the corporations owned by public and private shareholders, despite the state still remains the largest shareholder. Foreign investors have been allowed to take few ownership shareholding in the state banks. Some larger banks were gone public in Hong Kong capital market, such as China Construction Bank listed in Hong Kong in 2005, and Bank of China and Industrial and Commercial Bank of China cross listed in Hong Kong and Shanghai in 2006.
In spite of these efforts, many inherent drawbacks still remain in Chinese banking system. For instance, the ownership of foreign owners is relatively minority, and their involvement in efficient corporate governance is remain limit. Besides, Chinese banks are forced to meet multiple and contradictory goals of supporting local economic growth, employment and political lending.
6 2.1 Ownership and performance
Academic interests in bank performance have transfer from developed economies to developing and transitional markets. Bank governance structure is a critical and well-explored topic of relevant studies. For instance, the study on bank governance is
dominated by research focus on how insiders versus outsiders can affect a bank’s performance. However, in addition to insider versus outsider equity holders, another important dimension of ownership structure is state or public ownership versus private ownership structure. Especially, the study examines the impact of equity ownership by different shareholders group on manager behavior, in turn affecting performance. Thus, it seems reasonable to suggest ownership is a key determinant underlying different corporate governance regimes.
A bank’s ownership structure influences its performance for several reasons. Firstly, differences in ownership type identity, concentration, diversity, and resource endowments among shareholders determine their incentives and ability to monitor bank managers. Shareholdings by state, state owned enterprise (SOE), domestic private and foreign investors are typical examples of this phenomenon. Secondly, as shareholders have divergent interest, consequence they have different impacts on bank behavior.
The relationship between the shareholder and management is complicated due to their interests are not aligned. The effect that ownership structure has on bank performance may be considered through the principal–agent framework (Altunbas et al., 2001).
The effectiveness of governance is determined by ownership mechanisms and as consequence it affects firm performance. Several studies analyze whether ownership and governance do matter for bank performance.
7
State ownership refers to equity investments by central or local governmental institutions. The state has become increasingly important as an owner of domestic firms as well as foreign firms (Carney and Child, 2013). Generally, governments owned banks have multiple (often conflicting) goals other than commercial considerations. They are forced to meet contradictory objectives of supporting employment and changing themselves into modern commercial banks. Therefore, state owned banks may not be the independent organization governed by shareholders with return maximization. Barth et al. (2013) presents a cross-country statistics on the
degree of state ownership of the banking sector, they do not provide detailed information on the ownership structure of banks.
Banks with majority government ownership are normally beneficial of either implicit or explicit regulatory support from the authority (Faccio et al., 2006). For instance, these banks are likely to benefit from a lower cost of funding when issuing debt or equity securities in capital markets. Cornett et al. (2010) find that the deterioration in the cash flow returns, core capital, and credit quality of state-owned banks was
significantly greater than that of private banks, especially for the countries that were hardest hit by the Asian crisis. Chen et al. (2016) find that government banks have high loan growth rates than privately-owned banks. Zhu and Yang (2016) find that
state-owned banks have relatively lower risk taking after foreign acquisition. Zhang et
al. (2013) suggest that banks taking a lower level of risks perform better. Tan (2016) find that compared to the state-owned commercial banks, the joint-stock commercial
banks and city commercial banks in China have lower profitability. Beuselinck et al. (2017) suggest that the benefits of government ownership increased relative to the costs of government ownership in countries with good investor protection and low corruption.
8
incentives, political lending and misallocation of resource (Berger et al., 2005, Micco et al., 2007 and Lin and Zhang, 2009). Firstly, state shareholding is argued to be intrinsic inefficient because agency problem (Williams and Nguyen, 2005). The agent-principal problem turn into more significant under government ownership.
Managers are likely to pursue their own benefits rather than acting in the best interest of owners, which may lead to negative effects on bank performance. Ashrf (2017) suggest that government ownership in banks are likely generating the moral hazard problems due to the expectation of government bailouts in worst economic conditions. Therefore, governance of banks more relevant for performance in bad than in good times (Martin-Oliver et al., 2017).
Second, state invest in a particular bank because of its political and strategic value (Iannotta et al., 2013). As such, governments tend to own equity in firms and industries that usually are not the most competitive ones. Iannotta et al. (2013) find that government-owned banks have higher operating risk than private banks,
indicating the presence of governmental protection that induces higher risk taking. For instance, state owned banks are likely granting loans to socially valuable investment projects with low financial returns. State ownership of banks have led to ownership bias in lending (Lin et al., 2015). As consequence, these lending behaviors would inevitably deteriorate their asset quality and increase their risk profile. Dong et al. (2014) also find that government controlled banks tend to take more risks than those controlled by state-owned enterprises or private investors. Allen et al. (2017) find that
government-owned banks relatively increased credit supply during the global crisis.
Iannotta et al. (2007) find that government-owned banks exhibit a lower profitability
than privately owned banks. Indeed, stated owned banks with lower profitability may be related to the situation that those banks finance projects with high social benefit.
9
Bailey et al. (2011) find that poor financial performance and high managerial expenses increase the likelihood of obtaining a bank loan in China. Besides, the government’s nominees on the board are typically bureaucrats with minimal skill or expertise in banking sector. Micco et al. (2007) find that state-owned banks located in
developing countries tend to have lower profitability and higher costs than their private counterparts. Shaban and James (2017) find that state-owned banks tend to be
less profitable and more exposed to risk than private and foreign banks.
H1: Banks with high state ownership are negatively related to performance.
2.3 State owned enterprise (SOE)
Although an SOE’s ultimate controlling shareholder is the local or central government, but as the shareholder of a bank, SOE are different from government shareholders in many prospective. First, despite SOEs need to serve some politicians’ interests, but they are more empowered and have large autonomy. Second, SOEs have some financial policy constraints and may not obtain sufficient support from government. Furthermore, banks give preferential treatment to SOEs and discriminate against non-SOEs in China when making lending decision (Lu et al., 2013). Therefore, SOEs
are willing to hold higher ownership and maintain good relationship with bank. Chen et al. (2009) find that SOE controlled Chinese listed firms perform better than private controlled firms. SOEs’ may change their organizational goals following partial privatization, in turn, its effect on firm performance, as higher levels of profit orientation are instituted by the private investors.
10
adequately monitored (leading to poor incentive structures). The predominant view is that SOEs may not have enough resources and financial expertise to monitor and discipline bank managers, and thereby reducing agency problems. Therefore, managers of those banks have little incentive to minimize costs or maximize profit. Bank owned by SOE are not run by their owners, therefore the owners cannot tell how much of performance is due to managerial failure or external factors. Furthermore, organizational slack can readily inform the understanding of organizations’ behavior is possible due to SOEs prioritize goals such as social welfare different than other private owned firms (Stan et al., 2014). Saghi-Zedek (2016) find that when banks
have no controlling shareholder yields diseconomies on activity diversification.
Given that they are less sensitive to market pressures, economic performance and operation efficiency are not necessarily the priority concerns of SOE managers. In particular, direct monitoring from shareholders are either unavailable or are ineffective tools for mitigating agency costs in SOE. Thus, in the absence of appropriate monitoring, bank managers may prefer to take riskier activities in order to maintain or increase their remuneration.
H2: Banks with high SOE ownership are negatively related to performance.
2.4 Domestic private investors
11
Domestic private ownership is anticipated to reduce agency problems and enhance operating performance through varies mechanisms, such as managerial ownership and attractive remuneration package. These investors tend to have maximal equity returns as their primary investment objective. Thus, they are typically tied to the firm only with their equity stakes and mostly operate at arm’s length from managers. In response to the greater competitive and liberalized environment, these investors are closely monitor and give pressure on managers to improve operations as inadequate managers can be changed. Their monitoring incentives as well as their abilities are substantially greater than other domestic institutions. Jiang et al. (2013) show that the privatization of banks has improved performance with respect to revenue inflow and efficiency gains in the short- or long-run in China. Saghi-Zedek (2016) also find that
bank with more domestic shareholders display higher profitability as these shareholders bring additional skills to manage activity diversification and yields economies.
H3: Banks with high domestic private ownership are positively related to performance.
2.5 Foreign shareholders
Financial globalization has further opened in banking sector that were previously off-limits to international investment. Increased openness to foreign equity investors
generally enhances the information environment such as increasing analyst coverage and decreasing earnings management.
Foreign shareholding is expected to have a positively impact on performance. Firstly, foreign shareholders are less prone to political pressure and more likely to participate in arm's-length negotiation and monitoring in companies (Huang and Zhu, 2015).
12
corporations in different jurisdictions, they tend to have the relevant experience and know-how to set appropriate benchmarks for performance. Gillan and Starks (2003)
observe that foreign owners play a more active role than local investors in advocating better firm-level governance which may influence corporate performance. Empirical
studies (i.e. Berger et al., 2009; Lin and Zhang, 2009) suggest the improvements in performance after involved with foreign strategic investorss in domestic banks. Besides, foreign investors may choose to invest the better performing banks, or alternatively that the government sells the equity of better performing banks first in an effort to attract foreign investors. These foreign investors might help local banks in employ advanced banking strategies to enhance operating efficiency. Furthermore, foreign shareholders may insist having board member to represent their interest. Having foreign directors on the board would bring diversity of expertise that may effective than similar members from local business environment, as a result to enhance bank performance.
However, there are some inherent limitation for foreign shareholders to improve bank performance. Firstly, foreign investors may difficult to closely monitor from a long distance and limited access to local information. Indeed, those shareholders have general disadvantage about understanding the local country’s economy, language, laws and politics. Second, foreigners and nationals may receive different treatment from local governments, consumers and suppliers. Lensink et al. (2008) find that foreign ownership negatively affects bank efficiency. Besides, Berger et al. (2009b) claim that foreign ownership is not helpful for bank stability in 23 developed nations. Lee and Hsieh (2014) show that domestic banks are better than foreign banks.
H4: Banks with higher foreign ownership are positively related to performance.
2.4 Ownership diversity
13
which includes the state, SOE, domestic private, and foreign owners. Ownership diversity can influence firm performance in several ways. First, these diversities have impact corporate governance structure because they determine the incentives of managers and the economic efficiency of the corporations. Second, enhance performance is a common avenue of the state, private, and foreign investors, conflicts of interest between each shareholder are alleviated. More diversity equity ownership may increase corporate performance because it means better alignment of the monetary incentives between the manager and other equity owners. Theories from economics, organizational behaviour, and social psychology can provide some understanding of the nature of the link between ownership diversity and financial performance. Diversity incentives of shareholders holds their potential conflict to improve the information provided by the board to managers. Thus, differences in background of shareholders are very likely to produce unique information sets that are available to management for better decision-making. However, decision-making may
be slower and more conflicted with diverse shareholders. Garcia-Meca et al. (2015)
shows that directors diversity increases bank performance.
Therefore, relying on above arguments, it is reasonably to believe that a bank with different type of owners (state, SOE, domestic private, and foreign) is more capable of securing the complementary set of key resources for improve the operations.
H5: Ownership type diversity is positively related to bank performance.
2.5 Ownership concentration
Ownership concentration is a generally used structure through which investors aim to ensure the reasonable return on their investment (Shleifer and Vishny, 1997). Claessens et al. (2000) find that more than two-thirds of the firms are controlled by a
14
are not widely held and tend to be controlled by a family or the State. It is commonly held that concentrated ownership offers the best protection to shareholders.
Evidences from previous studies on the effect of ownership concentration on bank performances are mixed and complexity. The different national system of corporate governance reflected differences in ownership structure of firms in distinct economies and particularly, as well as in ownership concentration (Shleifer and Vishney. 1997; Caprio et al., 2007). Beltratti and Stulz (2012) find that more concentrated banking system was not associated with better performance.
It is not necessarily the case that greater ownership concentration means better alignment of interests of management with shareholders and thus enhance performance. DeYoung et al. (2001) indicate that banks with large ownership concentration face a classic monitoring problem. Garcia-Herrero et al. (2008) find that
a more concentrated banking system is associated with a lower profit. Indeed, controlling shareholders could use control of a bank to benefit their related entities and easily extract private benefits. Besides, those controlling shareholder may abuse using their power, which could be detrimental to the value maximization goal of the firm. Large bank shareholders can fire managers, such shareholders can use their power to ensure that managers engage in related lending (Caprio et al., 2007). Battaglia and Gallo (2017) find that greater shareholder influences are take more systemic risk during the crisis. Indeed, although few larger shareholders might have the power to induce management to run the firm in their interest, these interests need not converge with those of minority shareholders.
15
financial performance in Asia. Iannotta et al. (2007) find that ownership concentration has no effects on banks’ performance, but is associated with better loan quality. Caprio et al. (2007) find that concentrated ownership reduces incentives for insiders to expropriate bank resources, and that this boosts valuations. In the opposite situation, Jensen and Meckling (1976) argue that as more dispersed shareholding, the firm value increase.
More concentrated ownership can exploit strong bargaining power with mangers, in turn reducing managerial initiatives. Thus, my sixth hypothesis is as follows:
H6: Ownership concentration is negatively related to bank performance.
4 Methodology and data
4.1 Data and sample selectionOur sample is an unbalanced panel of 132 Chinese banks during the period of 2005– 2015. These banks are the top banks based on the total assets according to the annual China Banking Regulatory Commission (CBRC) ranking.
To investigate the impact of ownership structure on banks' performance, I collect my dataset from two sources. I hand-collect the information about the sample banks'
ownership structures, such as the percentage of ownership held by the top ten owners from annual reports. In addition, the bank-specific accounting data are retrieved from
the BankScope database and the banks' annual reports. Whenever Bankscope and annual report do not support enough information or has questionable amount, I retrieve or double-check the data from other official sources, such as annual issues of
Almanac of China’s Finance and Banking.
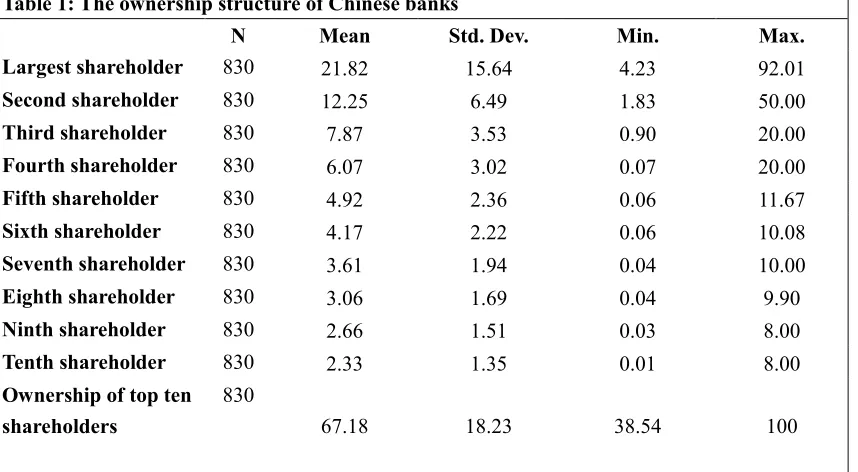
16 Table 1: The ownership structure of Chinese banks
N Mean Std. Dev. Min. Max.
Largest shareholder 830 21.82 15.64 4.23 92.01
Second shareholder 830 12.25 6.49 1.83 50.00
Third shareholder 830 7.87 3.53 0.90 20.00
Fourth shareholder 830 6.07 3.02 0.07 20.00
Fifth shareholder 830 4.92 2.36 0.06 11.67
Sixth shareholder 830 4.17 2.22 0.06 10.08
Seventh shareholder 830 3.61 1.94 0.04 10.00
Eighth shareholder 830 3.06 1.69 0.04 9.90
Ninth shareholder 830 2.66 1.51 0.03 8.00
Tenth shareholder 830 2.33 1.35 0.01 8.00
Ownership of top ten shareholders
830
67.18 18.23 38.54 100
Note: This table presents the percentage of a bank's equity share capital owned by the top ten largest shareholders individually and their total shareholding.
I delete the observations in the top 0.5% and in the bottom 0.5% of bank performance and ownership structure, as Chen et al. (2014) did.
4.2 Model
Several studies analyze whether ownership and governance do matter for bank performance. For example, Lin and Zhang (2009) assess the effect of bank ownership on performance using a panel of Chinese banks over the 1997–2004 period. Berger et al. (2009) analyze the efficiency using 266 annual observations over 1994–2003 on 38 commercial banks in China with different majority ownership. Iannotta et al. (2007) investigates whether any significant difference exists in the performance of European banks with different ownership structure.
17
taxes, divided by the average of the two most recent years of total assets. Follow Elyasiani and Zhang (2015) and Berger et al. (2005), the second performance variable is return on equity (ROE), defined as profits (net income after taxes) relative to equity, which is used as robustness test.
In line with prior studies that examine the relationship between ownership and bank performance (e.g., Lin and Zhang, 2009; Berger et al., 2009; Iannotta et al., 2009), I use the following regression specification:
𝑃𝐸𝑅𝐹𝑖𝑡 = 𝛼 + 𝛽1𝑆𝑇𝐴𝑇𝐸𝑖𝑡+ 𝛽2𝑆𝑂𝐸𝑖𝑡+ 𝛽3𝐷𝑃𝑂𝑖𝑡+ 𝛽4𝐹𝑂𝑅𝑖𝑡+ 𝛾1𝐷𝐼𝑉𝑖𝑡+ 𝛾2𝐶𝑂𝑁𝐶𝑖𝑡
+ 𝛴𝑘𝛿𝑘𝐶𝑂𝑁𝑇𝑅𝑂𝐿𝑘𝑖𝑡+ 𝜀𝑖𝑡
(Equation 1)
where the dependent variable PERF is one of the two bank performance measures: the return on assets (ROA) and return on equity (ROE).
STATE, SOE, DPO and FOR indicates the percentage of equity shares held by the shareholders for government, state owned enterprise, domestic private owners and foreign investors respectively. State ownership refers to equity investments by central or local governmental institutions. In China, for historical reasons, a large number of commercial banks are owned or controlled by the state, either directly through central or local government institutions or indirectly through marketized SOEs. Governments have conflicting objectives other than profit maximization. The model captures the contribution of state ownership, SOE ownership, domestic private ownership, foreign ownership, ownership diversity and ownership concentration on the performance measured by return on asset and return on equity of conglomerate banks.
DIV and CONC represent the ownership type diversity and concentration. First, following Chen et al. (2014), I used the Herfindahl measure, a commonly-used
18
𝑂𝑤𝑛𝑒𝑟𝑠ℎ𝑖𝑝 𝑡𝑦𝑝𝑒 𝑑𝑖𝑣𝑒𝑟𝑠𝑖𝑡𝑦 = 1
∑ 𝑖 [(𝑐𝑢𝑚𝑢𝑙𝑎𝑡𝑖𝑣𝑒 𝑜𝑤𝑛𝑒𝑟𝑠ℎ𝑖𝑝 𝑜𝑓 𝑡𝑦𝑝𝑒 𝑖 𝑏𝑙𝑜𝑐𝑘ℎ𝑜𝑙𝑑𝑒𝑟𝑡𝑜𝑡𝑎𝑙 𝑜𝑤𝑛𝑒𝑟𝑠ℎ𝑖𝑝𝑏𝑦 𝑎𝑙𝑙 𝑏𝑙𝑜𝑐𝑘ℎ𝑜𝑙𝑑𝑒𝑟 )2] ⁄
(Equation 2)
where i can be one of the state, SOE, domestic private, or foreign investors.
In addition, ownership concentration equals the sum of the squared ownership shares of the ten largest shareholders of the bank (Dong et al., 2014). It is the proportion of shares owned by a certain number of shareholders. I argued that the higher the number of equity owned by the block holders, the more mangers action will be monitored to act in the interest of the shareholders.
A larger value of ownership diversity indicates a more diverse presence of ownership types among those larger shareholders, while a higher value of ownership concentration indicates more concentrated control by larger shareholders.
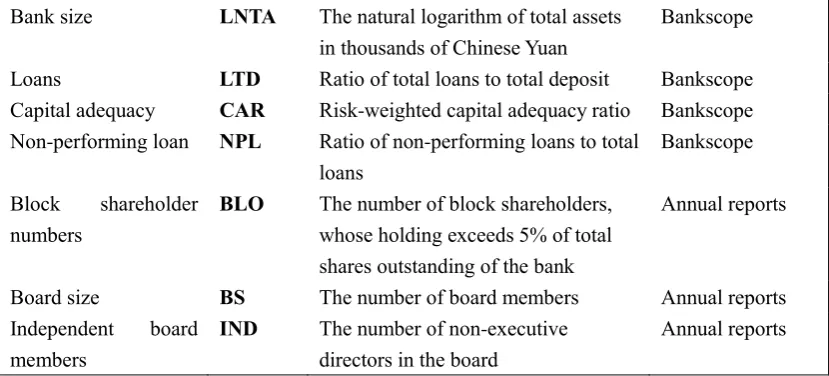
Control variables
Bank size: Bank size is measured by the natural logarithm of the bank's total assets. This variable includes the total assets to take account for differences in bank size. Large banks normally have diversified geographically, setting up branches around the world in countries and with many different sources of income. As large and complex organisations that have multiple and overlapping layers of hierarchy, they may suffer from complex agency problems. However, DeYoung et al. (2013) find that the larger banks are able to take advantage of these opportunities when industry deregulation expanded these banks’ growth opportunities. Bertay et al. (2013) show that bank returns increase with absolute size because large banks are subject to greater market discipline, yet decline with systemic size.
19
throughout decades. Banks obtain low cost fund by giving lower interest rates for deposits. A large portion of these funds are loaned to enterprises and individual borrowers to generate interest income. Jiang et al. (2013) find that Chinese banks are more efficient in generating interest revenue than non-interest income. Moreover,
loans might be more profitable than other types of assets, such as securities and other types of investment; therefore, a positive coefficient sign is expected for this variable in the regression.
Capital adequacy: Better capitalized banks may reflect higher management quality, thereby generating a higher profit. As pointed out by Berger and Bouwman (2013), well capitalized bank face lower expected bankruptcy costs, which in turn increase their shareholders’ return. Moreover, regulators require banks to hold a minimum level of capital as a percentage of risk-weighted assets. Higher levels of capital may
therefore indicate banks with riskier assets.
Non-performing loans: This variable is used to proxy for asset quality. Lower loan
quality typically indicates more resources on credit underwriting and loan monitoring, thus reduce profitability.
Block shareholder numbers: This variable is the number of shareholders whose single holding exceeds 5% of total shares outstanding of the bank. Block shareholders may have incentive to extract private benefit from bank and have a negative effect on a bank’s profitability.
20
Vallelado (2008) find that an inverted U-shaped relation between bank performance
and board size. Jiang et al. (2013) find board size has a significantly negative impact on bank performance.
[image:21.595.90.497.354.751.2]Independent directors: It is not enough merely to appoint more executive directors to safeguard the efficacy of supervision and advising for a bank. Independent directors should be appointed to monitor and discipline mangers. De Andres and Vallelado (2008) suggest that that larger and not excessively independent boards might prove more efficient in monitoring and advising functions, and create more value. Jiang et al. (2013) find the proportion of independent directors have significantly positive impacts on both bank performance and asset quality.
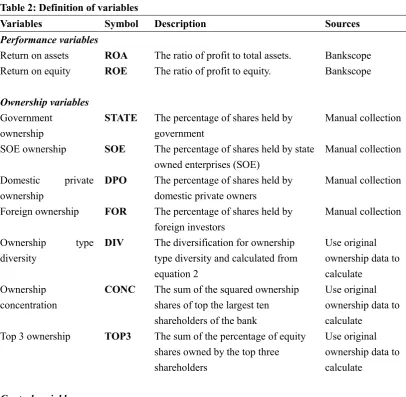
Table 2: Definition of variables
Variables Symbol Description Sources
Performance variables
Return on assets ROA The ratio of profit to total assets. Bankscope Return on equity ROE The ratio of profit to equity. Bankscope
Ownership variables
Government ownership
STATE The percentage of shares held by government
Manual collection
SOE ownership SOE The percentage of shares held by state owned enterprises (SOE)
Manual collection
Domestic private ownership
DPO The percentage of shares held by domestic private owners
Manual collection
Foreign ownership FOR The percentage of shares held by foreign investors
Manual collection
Ownership type diversity
DIV Thediversification for ownership type diversity and calculated from equation 2
Use original ownership data to calculate
Ownership concentration
CONC The sum of the squared ownership shares of top the largest ten shareholders of the bank
Use original ownership data to calculate
Top 3 ownership TOP3 The sum of the percentage of equity shares owned by the top three shareholders
Use original ownership data to calculate
21
Bank size LNTA The natural logarithm of total assets in thousands of Chinese Yuan
Bankscope
Loans LTD Ratio of total loans to total deposit Bankscope Capital adequacy CAR Risk-weighted capital adequacy ratio Bankscope
Non-performing loan NPL Ratio of non-performing loans to total
loans
Bankscope
Block shareholder numbers
BLO The number of block shareholders, whose holding exceeds 5% of total shares outstanding of the bank
Annual reports
Board size BS The number of board members Annual reports Independent board
members
IND The number of non-executive
directors in the board
Annual reports
It is reasonable to believe that the role played by different types of owners in banks' performance behaviors is conditional on their incentives as reflected by the ownership type diversity and concentration, i.e., the relation between performance and the ownership type diversity and the degree of ownership concentration. To explore this issue, I use the following regression model:
𝑃𝐸𝑅𝐹𝑖𝑡 = 𝛼 + 𝛽1𝑆𝑇𝐴𝑇𝐸𝑖𝑡+ 𝛽2𝑆𝑂𝐸𝑖𝑡+ 𝛽3𝐷𝑃𝑂𝑖𝑡+ 𝛽4𝐹𝑂𝑅𝑖𝑡+ 𝛾1𝐷𝐼𝑉𝑖𝑡+ 𝛾2𝐶𝑂𝑁𝐶𝑖𝑡
+ 𝜀1𝑆𝑇𝐴𝑇𝐸𝑖𝑡×𝐷𝐼𝑉𝑖𝑡+ 𝜀2𝑆𝑂𝐸𝑖𝑡×𝐷𝐼𝑉𝑖𝑡+ 𝜀3𝐷𝑃𝑂𝑖𝑡×𝐷𝐼𝑉𝑖𝑡
+ 𝜀4𝐹𝑂𝑅𝑖𝑡×𝐷𝐼𝑉𝑖𝑡+ 𝜀5𝑆𝑇𝐴𝑇𝐸𝑖𝑡×𝐶𝑂𝑁𝐶𝑖𝑡 + 𝜀6𝑆𝑂𝐸𝑖𝑡×𝐶𝑂𝑁𝐶𝑖𝑡
+ 𝜀7𝐷𝑃𝑂𝑖𝑡×𝐶𝑂𝑁𝐶𝑖𝑡+ 𝜀8𝐹𝑂𝑅𝑖𝑡×𝐶𝑂𝑁𝐶𝑖𝑡 + 𝛴𝑘𝛿𝑘𝐶𝑂𝑁𝑇𝑅𝑂𝐿𝑘𝑖𝑡+ 𝜀𝑖𝑡
(Equation 3)
where the interaction terms are included in the model as the output of the ownership type diversity (DIV) and concentration (CONC) with the percentage of each ownership type, respectively. Other control variables are as defined as above. If the coefficients of the interaction terms are statistically significant, this imply that the impacts of ownership type diversity and concentration on performance varies across those ownership types.
4.3 Descriptive statistics
[image:22.595.85.500.72.260.2]22
[image:23.595.87.513.167.558.2](1.12%) with standard deviation of 0.42%, and minimum and maximum values of 0.05% and 2.39% respectively. This figure is similar as the value given by Lin and Zhang (2009). The mean (median) ROE is 17.71% (17.64%).
Table 3: Descriptive statistics for main model variables
Variable N Mean Std. Dev. Min. Max.
Performance variables
ROA 830 1.14 0.43 0.05 2.39
ROE 830 17.87 6.86 0.63 39.72
Ownership variables
STATE 830 7.22 10.18 0.00 39.21
SOE 830 25.16 22.66 0.00 90.15
DPO 830 14.36 17.02 0.00 67.33
FOR 830 3.88 7.14 0.00 20.00
DIV 830 1.81 0.6 1.00 2.99
CONC 830 0.21 0.14 0.00 0.74
TOP3 830 0.42 0.18 0.16 0.92
Control variables
LNTA 830 16.32 1.79 13.19 21.19
LTD 830 60.76 10.64 28.34 78.45
CAR 830 12.96 3.18 5.77 30.14
NPL 830 1.31 1.18 0.00 8.21
BLO 830 4.22 2.15 0.00 10.00
BS 830 12.88 2.94 6.00 19.00
IND 830 3.09 1.85 0.00 7.00
Note: ROA is ratio of profit to the book value of total assets. ROE is ratio of profit to the book value of total equity. STATE is the percentage of equity shares held by government owners. SOE is the percentage of equity shares held by state owned enterprises (SOE) owners. DPO is the percentage of equity shares held by domestic private owners. FOR is the percentage of equity shares held by foreign owners. DIV is the diversification for ownership type diversity and calculated from equation 2. CONC is the sum of the squared ownership shares held by top ten largest shareholders. TOP3 is the total percentage of equity shares owned by the largest three shareholders. LNTA is the natural logarithm for the amount of total assets in thousands of Chinese Yuan. LTD is the ratio of total loans to total deposit. CAR is risk-weighted capital adequacy ratio. NPL is the ratio of the amount of non-performing loans over the amount of total loans. BLO is the number of block shareholders. BS is the number of board members. IND is the total number of independent member in the board.
23
14.37% and 3.89%. furthermore, the mean (median) of the ownership type diversity is 1.80 (1.80). The mean (median) of the ownership concentration is 0.21 (0.15), with a small degree of variation across sample.
With regard to the control variables, the range of capital adequacy ratio is from 5.77% to 30.14%, with an average of 13.19%. This figure is comparable to the figure reported in Dong et al. (2014). The mean (median) NPL is 1.31% (1.03%).
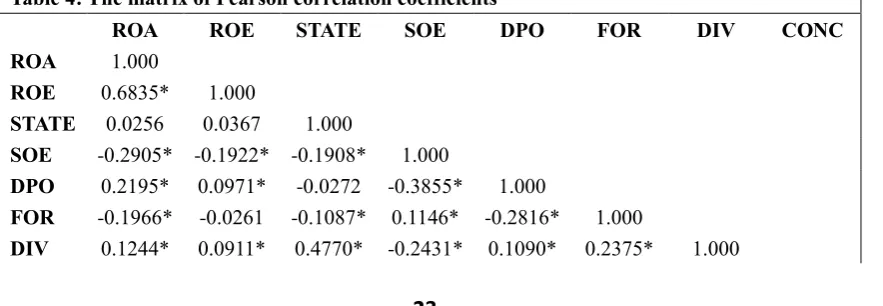
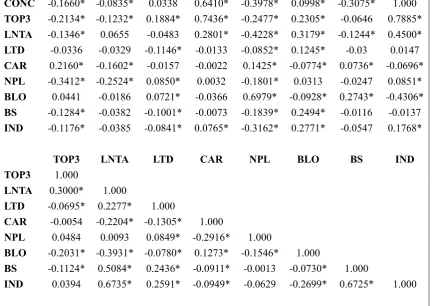
[image:24.595.85.527.620.773.2]The correlation between variables is used to identify whether there is a significant relationship between the ownership type and the performance. Table (4) shows the correlation matrix, which shows the relationship between all pairs of variables in the regression model. The correlation matrix indicates that state ownership (STATE) is not significantly related to two of the two performance measures, the return on assets (ROA), and the return on equity (ROE). However, SOE ownership (SOE) is significantly negatively related to ROA and ROE. Foreign ownership (FOR) is also significantly negatively related to ROA, but not significantly related to ROE. In addition, private domestic ownership (PDO) is significantly positively related to both ROA and ROE. Furthermore, ownership type diversity (DIV) is significantly positively related to ROA and ROE, and ownership concentration (CONC) is significantly negatively related to both ROA and ROE. Although I observe significant correlation among the measures of performance variables, but there are not be used in same model. In general, there is no evidence of severe multicollinearity.
Table 4: The matrix of Pearson correlation coefficients
ROA ROE STATE SOE DPO FOR DIV CONC
ROA 1.000
ROE 0.6835* 1.000
STATE 0.0256 0.0367 1.000
SOE -0.2905* -0.1922* -0.1908* 1.000
DPO 0.2195* 0.0971* -0.0272 -0.3855* 1.000
FOR -0.1966* -0.0261 -0.1087* 0.1146* -0.2816* 1.000
24
CONC -0.1660* -0.0835* 0.0338 0.6410* -0.3978* 0.0998* -0.3075* 1.000
TOP3 -0.2134* -0.1232* 0.1884* 0.7436* -0.2477* 0.2305* -0.0646 0.7885*
LNTA -0.1346* 0.0655 -0.0483 0.2801* -0.4228* 0.3179* -0.1244* 0.4500*
LTD -0.0336 -0.0329 -0.1146* -0.0133 -0.0852* 0.1245* -0.03 0.0147
CAR 0.2160* -0.1602* -0.0157 -0.0022 0.1425* -0.0774* 0.0736* -0.0696*
NPL -0.3412* -0.2524* 0.0850* 0.0032 -0.1801* 0.0313 -0.0247 0.0851*
BLO 0.0441 -0.0186 0.0721* -0.0366 0.6979* -0.0928* 0.2743* -0.4306*
BS -0.1284* -0.0382 -0.1001* -0.0073 -0.1839* 0.2494* -0.0116 -0.0137
IND -0.1176* -0.0385 -0.0841* 0.0765* -0.3162* 0.2771* -0.0547 0.1768*
TOP3 LNTA LTD CAR NPL BLO BS IND
TOP3 1.000
LNTA 0.3000* 1.000
LTD -0.0695* 0.2277* 1.000
CAR -0.0054 -0.2204* -0.1305* 1.000
NPL 0.0484 0.0093 0.0849* -0.2916* 1.000
BLO -0.2031* -0.3931* -0.0780* 0.1273* -0.1546* 1.000
BS -0.1124* 0.5084* 0.2436* -0.0911* -0.0013 -0.0730* 1.000
IND 0.0394 0.6735* 0.2591* -0.0949* -0.0629 -0.2699* 0.6725* 1.000
Note: ROA is ratio of profit to the book value of total assets. ROE is ratio of profit to the book value of total equity. STATE is the percentage of equity shares held by government owners. SOE is the percentage of equity shares held by state owned enterprises (SOE) owners. DPO is the percentage of equity shares held by domestic private owners. FOR is the percentage of equity shares held by foreign owners. DIV is the diversification for ownership type diversity and calculated from equation 2. CONC is the sum of the squared ownership shares held by top ten largest shareholders. TOP3 is the total percentage of equity shares owned by the largest three shareholders. LNTA is the natural logarithm for the amount of total assets in thousands of Chinese Yuan. LTD is the ratio of total loans to total deposit. CAR is risk-weighted capital adequacy ratio. NPL is the ratio of the amount of non-performing loans over the amount of total loans. BLO is the number of block shareholders. BS is the number of board members. IND is the total number of independent member in the board.
5 Empirical results
5.1 OLS estimation results [image:25.595.86.520.77.383.2]These regressions for the estimations of the relationship between the ownership structures and performance are presented from Tables (5) to (7). In the estimation, there is a significant relationship for performance and the different types of ownership.
Table 5: The relationship between ownership and bank performance (only individual type ownership) - OLS
(1) (2) (3) (4) (5)
Dependent
25
STATE 0.001 -0.002
(0.74) (-1.14)
SOE -0.006*** -0.005***
(-8.82) (-6.93)
DPO 0.006*** 0.002**
(6.54) (2.05)
FOR -0.012*** -0.009***
(-5.83) (-4.41)
Constant 1.130*** 1.278*** 1.058*** 1.184*** 1.278*** (62.34) (60.30) (55.94) (71.83) (36.09)
Observation 830 830 830 830 830
F test 0.554 77.801 42.74 33.941 28.172
R 0.001 0.084 0.048 0.039 0.118
Note: ROA is ratio of profit to the book value of total assets. ROE is ratio of profit to the book value of total equity. STATE is the percentage of equity shares held by government owners. SOE is the percentage of equity shares held by state owned enterprises (SOE) owners. DPO is the percentage of equity shares held by domestic private owners. FOR is the percentage of equity shares held by foreign owners. DIV is the diversification for ownership type diversity and calculated from equation 2. CONC is the sum of the squared ownership shares held by top ten largest shareholders. TOP3 is the total percentage of equity shares owned by the largest three shareholders. LNTA is the natural logarithm for the amount of total assets in thousands of Chinese Yuan. LTD is the ratio of total loans to total deposit. CAR is risk-weighted capital adequacy ratio. NPL is the ratio of the amount of non-performing loans over the amount of total loans. BLO is the number of block shareholders. BS is the number of board members. IND is the total number of independent member in the board.
In Table (5), the fundamentals variables are being used individually. A number of interesting results show in the results. First, in the column (1) of Table (5), there is no statistically relationship between the state shareholding and performance. This indicates the state shareholders may not create enough incentive environment and condition for the managers that is conducive to knowledge transfer for enhancing the performance. These results are in line with Altunbas et al. (2001) and Micco et al. (2007), who find no evidence that state-owned banks are less profitable than private
banks. In addition, this result further extends the findings of Fu and Heffernan (2009), who investigate the relation between market structure and performance in China’s banking system from 1985 to 2002 and find no evidence to support the quiet-life
hypothesis in state owned banks. The influence of government ownership on the bank performance is especially complex, as governments impose non-profit-maximizing
26
Moreover, this evidence also can be explained that the state-owned banks do not
enjoy monopoly profits, probably because strict interest rate control.
Second, in the column (2) of Table (5), there is a statistically negative relationship between the extent of SOE ownership i.e., the percentage of SOE shareholding (SOE) and performance measures. Specifically, the SOE ownership has a coefficient of
-0.005 with a t-value of -8.86 which is significant at 1%. The result is not surprising
as in many cases SOE shareholders tend to satisfy their personal interest instead of aligning their interest with that of the bank. Thus, agency problems could be a source of worse performing due to it explains why external pressures, which influence the effort of management, may fail to coerce maximal effort from managers. In highly competitive markets, external pressures are expected to strengthen management’s incentive to be operating efficiently. In addition, increase SOE shareholding may encourage a lack of discipline and risk taking behaviour. The notion of economically efficient SOE owned banks is contentious and revolves around alternative views of government benevolence. Hypothesis (2) is fully confirmed by the this results, banks with high SOE ownership are associated with worse performance.
Third, in the column (3) of Table (5), there is a statistically positive relationship between the domestic private ownership i.e., the percentage of domestic private shareholding (DPO) and performance measures. Specifically, the DPO ownership has a coefficient of 0.00 with a t-value of 6.515 which is significant at 1%. The result
27
advantage source of skills and expertise that help banks with activity diversification (Saghi-Zedek, 2016). Moreover, Altunbas et al. (2001) also conclude that privately
owned banks are more efficient that their counterparts. Indeed, private domestic ownership is expected to reduce agency problems thereby promoting profitability because these shareholders exercise due diligence and monitor manager efficiently. Shaban and James (2017) find that domestic investors tend to select the best performing banks. Hence, the results confirm Hypothesis (3).
Fourth, in the column (4) of Table (5), there is a statistically negative relationship between the foreign ownership i.e., the percentage of foreign shareholding (FOR) and performance measure. Specifically, the FOR variable has a coefficient of -0.012 with
a t-value of -5.85 which is significant at 1%. This indicates that higher foreign
ownership may negatively affect bank performance. This result is in line with the finding of Lensink et al. (2008), who also find that foreign ownership negatively affects bank performance. Besides, this result can be interpreted that foreign owners may find it difficult than domestic owners to deal with a host country’s regulation or related banking supervision requirements. Indeed, foreign shareholders may face strong domestic networks and may also encourage managers to increase shareholder returns through greater risk-taking (Garcia-Meca et al., 2015). Consistent with the
finding of Lee and Hsieh (2014), they find that the home field advantage hypothesis is existence. The results confirm Hypothesis (4).
However, this result is contrast with findings in Berger et al., (2005) that foreign ownership helps mitigate loss of profit or increase in costs from diversification. Jiang et al., (2013) also find that more shares of foreign ownership associated with the high level of cost efficiency. Micco et al. (2007) also offer evidence that foreign ownership improves a bank’s performance through profit increases and cost downs.
28
significant, while the coefficient of DPO is positive and significant, which in line with other specifications.
In table (6), I add the ownership type diversity (DIV) and concentration (CONC) variables, while the table also presents the results for individual type shareholders. The signs of the coefficients on STATE, SOE, DPO and FOR are relatively consistent with regression results in Table (5).
Table 6: The relationship between ownership and bank performance (without control variables) - OLS
(1) (2) (3) (4) (5)
Dependent
variable ROA ROA ROA ROA ROA
STATE -0.001 -0.006***
(-0.04) (-3.74)
SOE -0.006*** -0.006***
(-6.92) (-6.81)
DPO 0.005*** 0.002**
(5.61) (2.15)
FOR -0.013*** -0.013***
(-6.28) (-5.86)
DIV 0.060** 0.048* 0.063** 0.104*** 0.153*** (2.04) (1.95) (2.55) (4.04) (5.01)
CONC -0.407*** 0.142 -0.13 -0.289*** -0.473***
(-3.66) (-1.07) (-1.10) (-2.67) (3.37)
Constant 1.111*** 1.158*** 0.970*** 1.057*** 0.971*** (17.94) (20.08) (15.35) (18.16) (15.22)
Observation 830 830 830 830 830
F test 9.088 25.586 19.935 22.679 23.261
R 0.032 0.085 0.067 0.076 0.144
[image:29.595.89.514.288.650.2]29
There is a statistically positive relationship between the extent of ownership type diversity (DIV) and bank performance variables in all columns of Table (6). Specifically, in column (5) of Table (6), the ownership type diversity has a coefficient of 0.153 with a t-value of 5.01 which is significant at 1%.
More generally, firms with few large, undiversified shareholders such as founding owners may forgo maximum profits because they are unable to separate their financial preferences with those of outside or minority shareholders. Founding owners often limit executive management positions to the members who may have relation. These are suggesting a restricted human resource from which to obtain qualified and capable talent, potentially leading to competitive disadvantages relative to other firms.
There is a statistically negative relationship between the extent of ownership concentration (CONC) and bank performance variables in three columns of Table (6). Specifically, in column (5) of Table (6), the CONC has a coefficient of -0.473 with a
t-value of 3.37 which is significant at 1%. The results are suggesting that banks with
concentrated ownership are poorer performing.
The results can be explained by the views that for the expropriation of minority shareholders in banks, which contrast with the finding of Caprio et al. (2007). Although the dispersed owners lack both the means and the motive to address managerial agency problems, but the incentives of the controlling shareholders are more likely to expropriate resources from the corporation. This situation is generally known as “tunneling,” and is commonly defined as “the transfer of assets and revenues out of firms for the benefit of their controlling shareholders”.
30
profits for private rents. Shleifer and Vishny (1997) suggest that large premiums associated with superior voting shares or control rights provide incentive that larger shareholders seek to extract private benefits from the firm. Indeed, higher ownership concentration may increase the power for shareholder to monitor management, but it may also increase the risk for the power abuse by large controlling shareholders.
Typically, in column (5) of Table (6), STATE ownership has a coefficient of -0.006
with a t-value of -3.74 which is significant at 1%. This result indicate that state
ownership of banks has been associated with subpar bank performance (Cornett et al., 2010; Berger et al., 2009a; Lensink et al., 2008; Lin and Zhang, 2009). The underperformance of the banks associated with high state ownership is consistent with the theoretical arguments of the agency view, the social view, and the political view of state ownership.
The political view claims that government control of financial institutions politicizes resource allocation for the sake of advancing certain political agendas, and, by pursuing such objectives, economic efficiency is impaired (Shleifer and Vishny, 1997). In another word, state ownership of commercial banks was used to assist national economic development policies. In fact, the political views should not be seen as corner solutions without any intermediate possibility; it is possible that state-owned
banks are mandated to engage with some political lending. In addition, the state shareholders may act as both owner and regulator of its banks. As consequence, some banks might be either too-big-to-fail or too-important-to-fail which would allow
worse performing banks to survive. This view can be support by the finding of Faccio et al. (2006), who find that politically connected firms are significantly more likely to be bailed out than similar nonconnected firms. Furthermore, the free-rider problem
31
banks may due to the perverse incentives of political bureaucrats who influence the operation of state-owned banks. My findings provide further support for the political
view of public banks and corroborate previous findings by Micco et al. (2007), who find that state owned banks tend to have lower profitability and higher costs than their private counterparts in developing countries.
Again, the signs of the coefficients on SOE, DPO and FOR are relatively consistent with regression results in previous specifications. Specifically, the SOE ownership has a coefficient of -0.006 with a t-value of -6.81, which is significant at 1% in column (5)
of Table (6). DPO ownership has a coefficient of 0.002 with a t-value of 2.15, which
is significant at 1% in column (5) of Table (6). Moreover, FOR ownership has a coefficient of -0.013 with a t-value of -5.86, which is significant at 1% in column (5)
of Table (6).
The regression results in Table (6) supports proposed hypotheses. Ownership type diversity has a statistically and positively significant effect on performance variable in all estimations. The R2 values, which demonstrates the quality of estimations, increase significantly when ownership type diversity is added in the regressions (e.g., R2 increases from 3.2% in column 1 to 14.4% in column 5), suggesting that ownership diversity and concentration are the essential explanatory factors for determining bank performance.
32
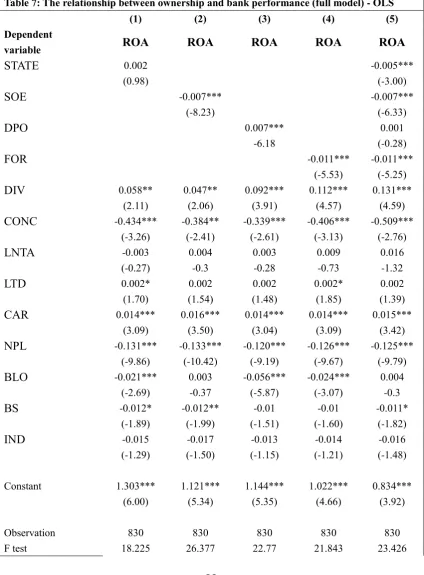
[image:33.595.86.511.195.771.2]coefficient for DPO is positive and significant at the 1% level in column (3) of Table (7). However, for column (5) of Table (7), this result breaks down. It is still positive, yet no longer significant. Furthermore, the coefficients for FOR are negative and significant at the 1% level in both column (4) and column (5) of Table (7).
Table 7: The relationship between ownership and bank performance (full model) - OLS
(1) (2) (3) (4) (5)
Dependent
variable ROA ROA ROA ROA ROA
STATE 0.002 -0.005***
(0.98) (-3.00)
SOE -0.007*** -0.007***
(-8.23) (-6.33)
DPO 0.007*** 0.001
-6.18 (-0.28)
FOR -0.011*** -0.011***
(-5.53) (-5.25)
DIV 0.058** 0.047** 0.092*** 0.112*** 0.131*** (2.11) (2.06) (3.91) (4.57) (4.59)
CONC -0.434*** -0.384** -0.339*** -0.406*** -0.509***
(-3.26) (-2.41) (-2.61) (-3.13) (-2.76)
LNTA -0.003 0.004 0.003 0.009 0.016
(-0.27) -0.3 -0.28 -0.73 -1.32
LTD 0.002* 0.002 0.002 0.002* 0.002 (1.70) (1.54) (1.48) (1.85) (1.39)
CAR 0.014*** 0.016*** 0.014*** 0.014*** 0.015*** (3.09) (3.50) (3.04) (3.09) (3.42)
NPL -0.131*** -0.133*** -0.120*** -0.126*** -0.125***
(-9.86) (-10.42) (-9.19) (-9.67) (-9.79)
BLO -0.021*** 0.003 -0.056*** -0.024*** 0.004
(-2.69) -0.37 (-5.87) (-3.07) -0.3
BS -0.012* -0.012** -0.01 -0.01 -0.011*
(-1.89) (-1.99) (-1.51) (-1.60) (-1.82)
IND -0.015 -0.017 -0.013 -0.014 -0.016
(-1.29) (-1.50) (-1.15) (-1.21) (-1.48)
Constant 1.303*** 1.121*** 1.144*** 1.022*** 0.834*** (6.00) (5.34) (5.35) (4.66) (3.92)
Observation 830 830 830 830 830
33
R 0.182 0.244 0.218 0.211 0.272
Note: ROA is ratio of profit to the book value of total assets. ROE is ratio of profit to the book value of total equity. STATE is the percentage of equity shares held by government owners. SOE is the percentage of equity shares held by state owned enterprises (SOE) owners. DPO is the percentage of equity shares held by domestic private owners. FOR is the percentage of equity shares held by foreign owners. DIV is the diversification for ownership type diversity and calculated from equation 2. CONC is the sum of the squared ownership shares held by top ten largest shareholders. TOP3 is the total percentage of equity shares owned by the largest three shareholders. LNTA is the natural logarithm for the amount of total assets in thousands of Chinese Yuan. LTD is the ratio of total loans to total deposit. CAR is risk-weighted capital adequacy ratio. NPL is the ratio of the amount of non-performing loans over the amount of total loans. BLO is the number of block shareholders. BS is the number of board members. IND is the total number of independent member in the board.
Regarding the control variables in the efficiency equation it appears that most variables are in line with expectation. The coefficients on the majority control variables are significant, except for that of LNTA and IND. The coefficients of loan to deposit ratio (LTD) have a statistically significant and positive effect on performance in column (1) and (4) of Table (7), which suggests that banks with more loans are likely to associate with higher return for the shareholders. The result is in line with the finding of Jiang et al. (2013). In addition, the coefficients of non-performing loan
ratio (NPL) have a statistically significant and negative effect on performance in column (1) and (4) of Table (7), which suggest that banks with lower non-performing
loan are better perform and more profitable. Furthermore, consistent with the finding of Liang et al. (2013), board size has a significantly negative impact on bank performance.
The coefficients of bank sizes (LNTA) have no statistically significant. The result is consistent with the finding of Micco et al. (2007), who find no correlation between absolute bank size and ROA for banks located in developing countries.
34
(e.g., R2 increases from 18.2% in Column 1 to 27.2% in Column 5), meaning that these control variables are reasonable explanatory factor determining bank performance.
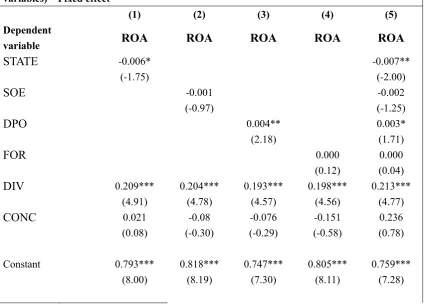
5.2 Fixed effect estimation
In Table (8), the results still clearly suggest that bank ownership matters. In both column (1) and (5), the coefficient on STATE is negatively and significantly at 10% and 5%. This results confirm the previous findings that banks with more percentage shares holding by government are associated with lower profitability. In addition, the coefficient on DPO is positively and significantly at 5% and 10% on column (3) and (5) respectively. This results confirm the previous findings that banks with more shares holding by domestic provide investors are associated with better performing. Moreover, the coefficient on DIV is positively and significantly at 1% on all five columns.
Table 8: The relationship between ownership and bank performance (without control variables) – Fixed effect
(1) (2) (3) (4) (5)
Dependent
variable ROA ROA ROA ROA ROA
STATE -0.006* -0.007**
(-1.75) (-2.00)
SOE -0.001 -0.002
(-0.97) (-1.25)
DPO 0.004** 0.003*
(2.18) (1.71)
FOR 0.000 0.000
(0.12) (0.04)
DIV 0.209*** 0.204*** 0.193*** 0.198*** 0.213*** (4.91) (4.78) (4.57) (4.56) (4.77)
CONC 0.021 -0.08 -0.076 -0.151 0.236
(0.08) (-0.30) (-0.29) (-0.58) (0.78)
[image:35.595.87.514.449.754.2]35
Observation 830 830 830 830 830
F test 8.84 8.101 9.411 7.784 5.433
R 0.036 0.033 0.039 0.032 0.045
Note: ROA is ratio of profit to the book value of total assets. ROE is ratio of profit to the book value of total equity. STATE is the percentage of equity shares held by government owners. SOE is the percentage of equity shares held by state owned enterprises (SOE) owners. DPO is the percentage of equity shares held by domestic private owners. FOR is the percentage of equity shares held by foreign owners. DIV is the diversification for ownership type diversity and calculated from equation 2. CONC is the sum of the squared ownership shares held by top ten largest shareholders. TOP3 is the total percentage of equity shares owned by the largest three shareholders. LNTA is the natural logarithm for the amount of total assets in thousands of Chinese Yuan. LTD is the ratio of total loans to total deposit. CAR is risk-weighted capital adequacy ratio. NPL is the ratio of the amount of non-performing loans over the amount of total loans. BLO is the number of block shareholders. BS is the number of board members. IND is the total number of independent member in the board.
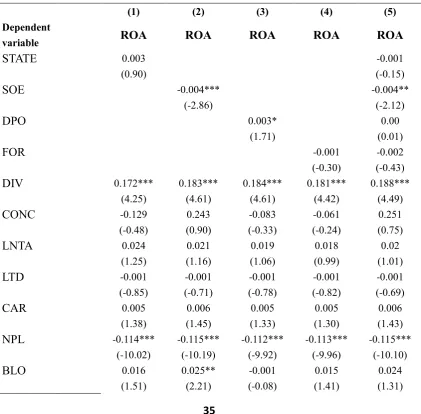
The Table (9) results indicate that controlling for these other bank-specific
characteristics does not change previous findings. In particular, NPL enters negatively and significantly as expected.
Table 9: The relationship between ownership and bank performance (full model) – Fixed effect
(1) (2) (3) (4) (5)
Dependent
variable ROA ROA ROA ROA ROA
STATE 0.003 -0.001
(0.90) (-0.15)
SOE -0.004*** -0.004**
(-2.86) (-2.12)
DPO 0.003* 0.00
(1.71) (0.01)
FOR -0.001 -0.002
(-0.30) (-0.43)
DIV 0.172*** 0.183*** 0.184*** 0.181*** 0.188*** (4.25) (4.61) (4.61) (4.42) (4.49)
CONC -0.129 0.243 -0.083 -0.061 0.251
(-0.48) (0.90) (-0.33) (-0.24) (0.75)
LNTA 0.024 0.021 0.019 0.018 0.02 (1.25) (1.16) (1.06) (0.99) (1.01)
LTD -0.001 -0.001 -0.001 -0.001 -0.001
(-0.85) (-0.71) (-0.78) (-0.82) (-0.69)
CAR 0.005 0.006 0.005 0.005 0.006 (1.38) (1.45) (1.33) (1.30) (1.43)
NPL -0.114*** -0.115*** -0.112*** -0.113*** -0.115***
(-10.02) (-10.19) (-9.92) (-9.96) (-10.10)
BLO 0.016 0.025** -0.001 0.015 0.024
[image:36.595.88.510.364.778.2]36
BS -0.002 -0.001 -0.001 -0.002 -0.001
(-0.20) (-0.11) (-0.13) (-0.29) (-0.11)
IND -0.001 0.000 0.001 -0.001 0.000
(-0.10) (0.02) (0.06) (-0.07) (-0.02)
Constant 0.54 0.552 0.615* 0.650* 0.581 (1.41) (1.51) (1.68) (1.77) (1.51)
Observation 830 830 830 830 830
F test 16.917 17.836 17.182 16.828 13.68
R 0.197 0.205 0.199 0.196 0.206
Note: ROA is ratio of profit to the book value of total assets. ROE is ratio of profit to the book value of total equity. STATE is the percentage of equity shares held by government owners. SOE is the percentage of equity shares held by state owned enterprises (SOE) owners. DPO is the percentage of equity shares held by domestic private owners. FOR is the percentage of equity shares held by foreign owners. DIV is the diversification for ownership type diversity and calculated from equation 2. CONC is the sum of the squared ownership shares held by top ten largest shareholders. TOP3 is the total percentage of equity shares owned by the largest three shareholders. LNTA is the natural logarithm for the amount of total assets in thousands of Chinese Yuan. LTD is the ratio of total loans to total deposit. CAR is risk-weighted capital adequacy ratio. NPL is the ratio of the amount of non-performing loans over the amount of total loans. BLO is the number of block shareholders. BS is the number of board members. IND is the total number of independent member in the board.
[image:37.595.86.513.69.259.2]5.3 Interacting different types of owners with ownership type diversity and concentration
Table 6 reports the results of Equation (3) that examines how the different types of owners in banks' performance behaviors is conditional on the ownership type diversity and concentration. In another word, the marginal effect of percentage of shareholding by different owners may depend on the ownership type diversity and the level of ownership concentration.
37
In column (2) of Table (10), the coefficient on the interaction between SOE and DIV is positively and significantly at 5%, while the interaction term SOE and CONC enters also positively and significantly. The results suggest that the negative impact of SOE shareholders on bank performance are reduced on banks with ownership type diversity and concentrated ownership.
In column (4) of Table (10), the coefficient on the interaction between FOR and CONC is positively and significantly at 1%, while the coefficient of interaction between FOR and DIV is not significantly affected. The result indicates that that FOR and CONC reduce bank performance, but the marginal effect of each diminishes as the other increases. In other words, the results suggest that the negative impact of FOR shareholders on bank performance are reduced when banks with concentrated ownership.
The column (5) of Table (10) results indicates that including all variables does not change previous findings. For instance, the coefficient on interaction term STATE and
[image:38.595.92.511.547.778.2]CONC is still negatively and significantly at 1%. The coefficients on interaction term SOE and DIV is positively and significantly.
Table 10: The relationship between ownership and bank performance (interaction without control variables)
(1) (2) (3) (4) (5)
Dependent
variable ROA ROA ROA ROA ROA
DIV 0.034 -0.000 0.027 0.108*** 0.048
(0.89) (-0.00) (0.77) (3.82) (0.70)
CONC -0.265** -0.757*** -0.154 -0.482*** 0.544
(-2.20) (-2.73) (-1.27) (-3.98) (1.24)
STATE 0.007 -0.003
(1.10) (-0.45)
STATE * DIV 0.001 0.001
(0.44) (0.54)
STATE * CONC -0.035*** -0.025**